Products
SentimenTrader Trading Tools
‍
Backtest Engine
My Trading Toolkit
Correlation Analysis
Seasonality
Market Prediction
Indicators & Data API
‍
Proprietary Indicators & Charts
Market Data API
Strategies & Scanner
‍
50+ Trading Strategies
Smart Stock Scanner
Smart Option Scanner
Research Reports
‍
Research Solutions
Reports Library
Free Resources
Simple Backtest Calculator
Simple Seasonality Calculator
The Kelly Criterion Calculator
Sentiment Geo Map
Public Research Reports
Education
Sentiment Indicators
Technical Indicators
Pricing
Company
About
In the News
Testimonials
Client Success Stories
Contact
Log inLoginSign up
< BACK TO ALL REPORTS

Surveys show lowest relative optimism in 3 years

Jason Goepfert
2022-02-01
The AAII survey last week showed a remarkable spike in bears, investors who expect stocks to fall in the coming months. That's not the only bearish survey, however, and the AIM Model is now below 5%. After other weeks in the bottom 1% of historical readings, the S&P 500's forward returns were well above average.

Key points:

  • Sentiment surveys are showing extreme pessimism relative to recent history
  • The AIM Model is now below 5%, one of the lowest readings in a decade
  • S&P 500 returns after similarly low readings were almost universally positive

Surveys say excessive pessimism

We've seen how much sentiment has soured over the past couple of weeks from multiple perspectives. On Monday, more evidence came from small options traders, who spent a record amount on protective puts last week.

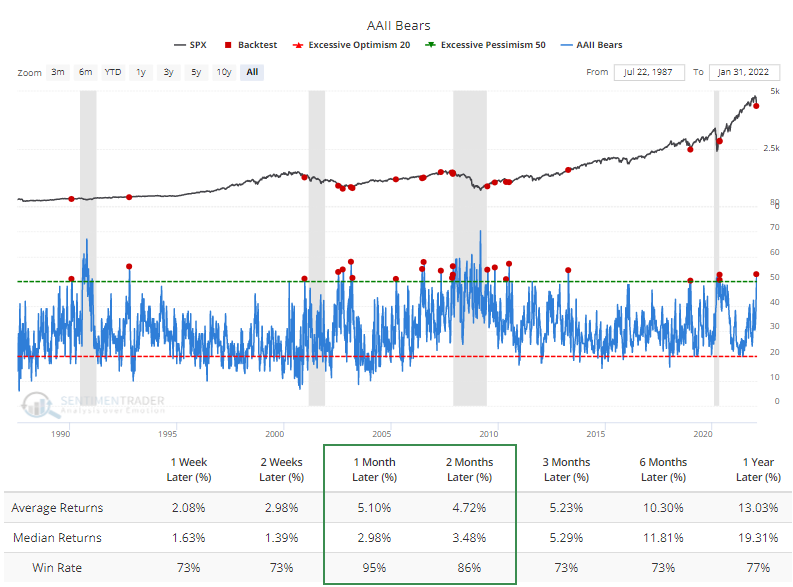
We prefer to focus on real-money gauges as opposed to surveys because people don't always do what they say they're going to do. Still, the survey of individual investors from AAII got quite a bit of attention last week. It showed that for one of the few times in the past decade, bears accounted for more than 50% of respondents.

The Backtest Engine shows that when more than 50% of investors said they were bearish and the U.S. economy was not in a recession at the time, the S&P 500 rallied during the next month after 21 out of 22 signals (and that sole loss was reversed during the subsequent month).

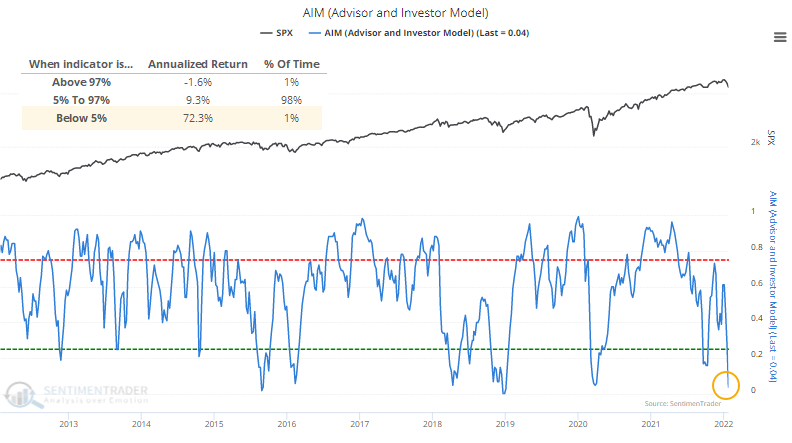
The AIM Model looks at a handful of popular sentiment surveys and calculates the relative amount of optimism in each one. As of the latest reading, there isn't much of it. The AAII survey isn't the only one showing a low degree of confidence among investors.

A reading below 5% in the model is rare, accounting for fewer than 1% of days since 1990. The S&P 500's annualized return following a reading that low was +72.3%, compared to -1.6% when the model was in the top 1% of readings.

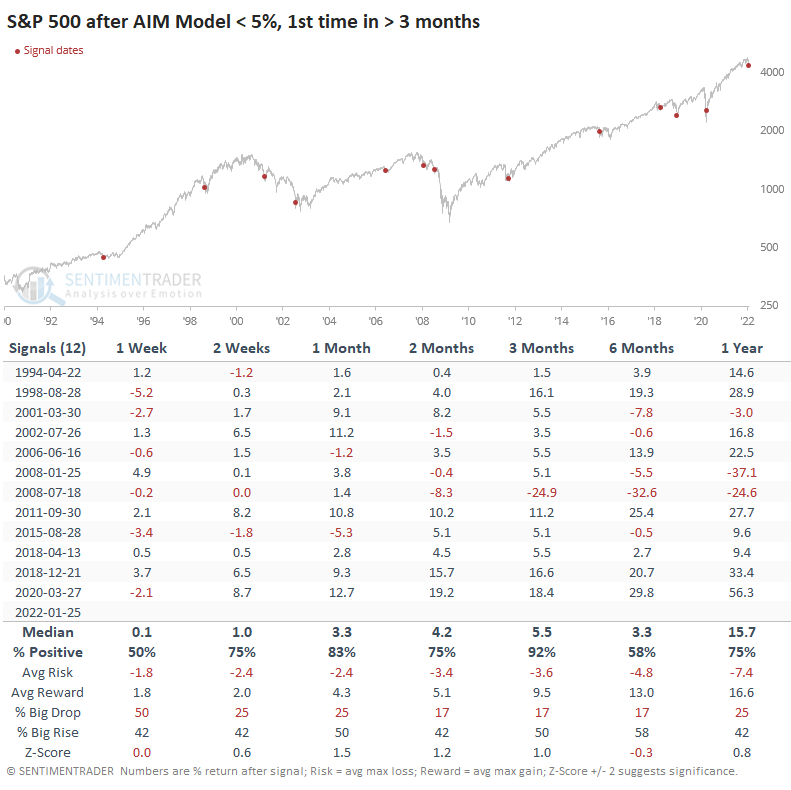
This was the first reading of true pessimism in at least 3 months. The table below shows that the S&P tended to perform well after these first bursts of pessimism. Over the next 3 months, it rose over 11 out of 12 signals, though that loser was dismal.

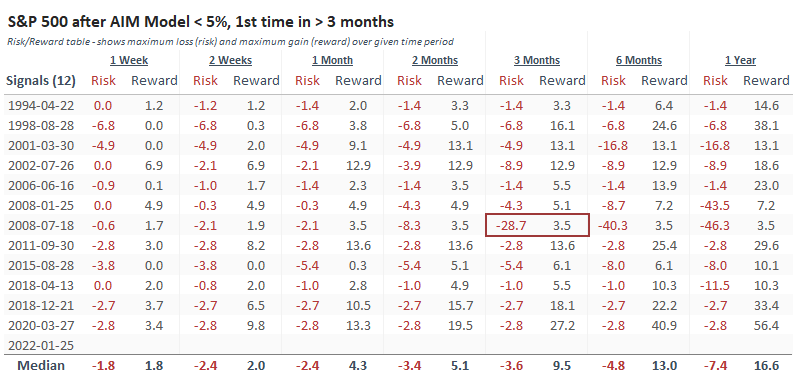
The Risk/Reward Table shows that the only signal that led to a maximum loss of more than -10% at any point within the next 3 months was that one in 2008. Losses after the others were mostly minimal, while double-digit gains were more common than not.

What the research tells us...

As we saw with small options traders, when sentiment gets as extreme as is indicated by the AIM Model, forward returns in stocks tend to be consistently positive, especially over the medium-term of 1-3 months. Since the market environment is unhealthy, we have to be careful about placing too much weight on readings like this, and for too long. For a multi-week or even multi-month rebound, it's fine. Longer than that, we need a marked improvement in the environment.

PRODUCTS
SentimenTrader
Trading Tools
Indicators & Data API
‍
Strategies & Scanner
‍
Research Reports
FREE
RESOUrCES
Simple Backtest
Calculator
Simple Seasonality
Calculator
The Kelly Criterion
Calculator
Sentiment Geo Map
‍
Public Research Reports
‍
Education
Sentiment Indicators
‍
Technical Indicators
‍
Pricing
Bundle pricing
‍
FAQ
‍
Announcements
‍
COMPANY
‍
About
‍
In the News
‍
Testimonials
‍
Client Success Stories
CONTACT
‍
General Inquiries
‍
Media Inquiries
‍
Financial Professionals Inquiries
‍
© 2026 Sundial Capital Research Inc. All rights reserved.
Setsail Marketing
TermsPrivacyAffiliate Program
Risk Disclosure: The information and tools provided are for research and analytical purposes only and are not intended as investment advice. Market analysis involves uncertainty, and outcomes may differ from expectations. Users should conduct their own due diligence and consider their individual circumstances before making any financial decisions. Past performance is not necessarily indicative of future results.

Hypothetical Performance Disclosure: Hypothetical performance results have many inherent limitations, some of which are described below. No representation is being made that any account will or is likely to achieve profits or losses similar to those shown; in fact, there are frequently sharp differences between hypothetical performance results and the actual results subsequently achieved by any particular trading program. One of the limitations of hypothetical performance results is that they are generally prepared with the benefit of hindsight. In addition, hypothetical trading does not involve financial risk, and no hypothetical trading record can completely account for the impact of financial risk of actual trading. for example, the ability to withstand losses or to adhere to a particular trading program in spite of trading losses are material points which can also adversely affect actual trading results. There are numerous other factors related to the markets in general or to the implementation of any specific trading program which cannot be fully accounted for in the preparation of hypothetical performance results and all which can adversely affect trading results.

Testimonial Disclosure: Testimonials appearing on this website may not be representative of other clients or customers and is not a guarantee of future performance or success.