Products
SentimenTrader Trading Tools
‍
Backtest Engine
My Trading Toolkit
Correlation Analysis
Seasonality
Market Prediction
Indicators & Data API
‍
Proprietary Indicators & Charts
Market Data API
Strategies & Scanner
‍
50+ Trading Strategies
Smart Stock Scanner
Smart Option Scanner
Research Reports
‍
Research Solutions
Reports Library
Free Resources
Simple Backtest Calculator
Simple Seasonality Calculator
The Kelly Criterion Calculator
Sentiment Geo Map
Public Research Reports
Education
Sentiment Indicators
Technical Indicators
Pricing
Company
About
In the News
Testimonials
Client Success Stories
Contact
Log inLoginSign up
< BACK TO ALL REPORTS

Tech's Relative Weakness Suggests More To Come

Jason Goepfert
2021-05-12
Even though the S&P 500 was just at a record high, the ratio of the Technology sector to the S&P just fell to a 6-month low. Similar behavior preceded weak returns in Tech stocks, especially relative to the S&P.

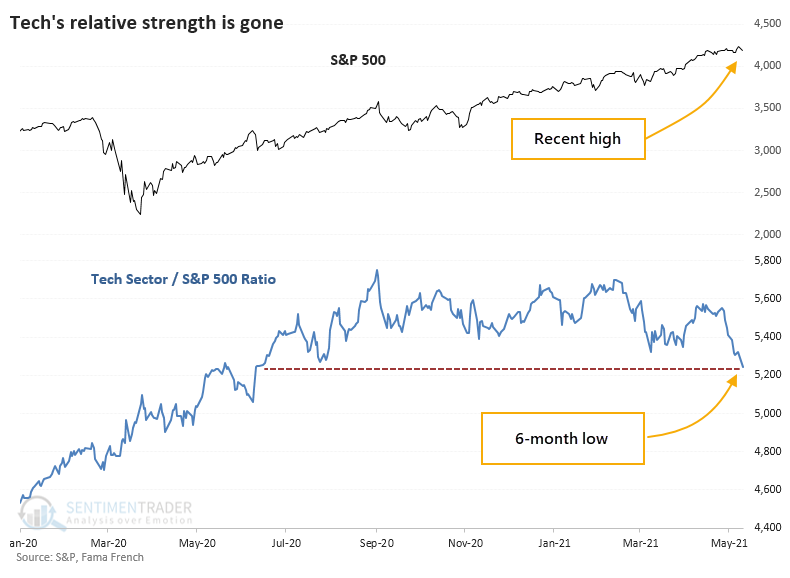
Tech was in the driver's seat for much of the past year. After an option-fueled blowoff in February, those stocks have treaded water, at best, while other parts of the market recover enough to trigger a nearly 80-year extreme in new highs.

This relative weakness in tech stocks has been enough to push the ratio between them and broader indexes nearly to the lowest level in a year. This does not often happen when indexes like the S&P 500 were sitting at all-time highs a few short days ago.

FUTURE RETURNS WERE CHALLENGED

Whenever the S&P 500 had been at a 52-week high, then within 3 days, the ratio of Tech to the S&P fell to a 6-month low, the S&P showed weak short-term returns, but it didn't have much of a consistent impact beyond that.

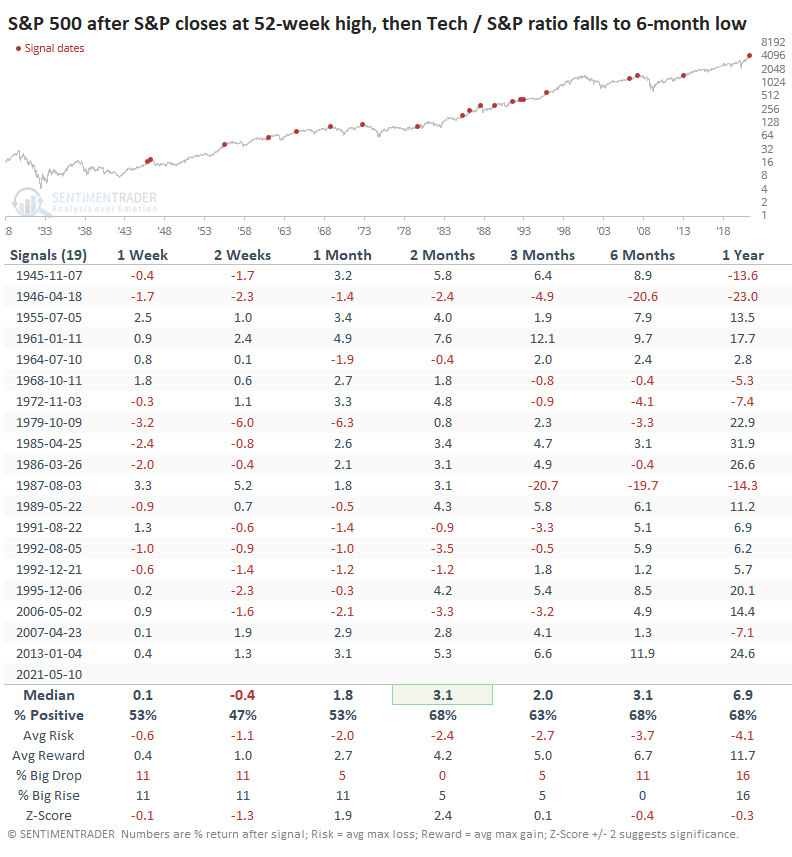
The last two instances, in 2007 and 2013, didn't lead to anything nefarious. Before that, though, the last 6 signals all preceded short- to medium-term losses.

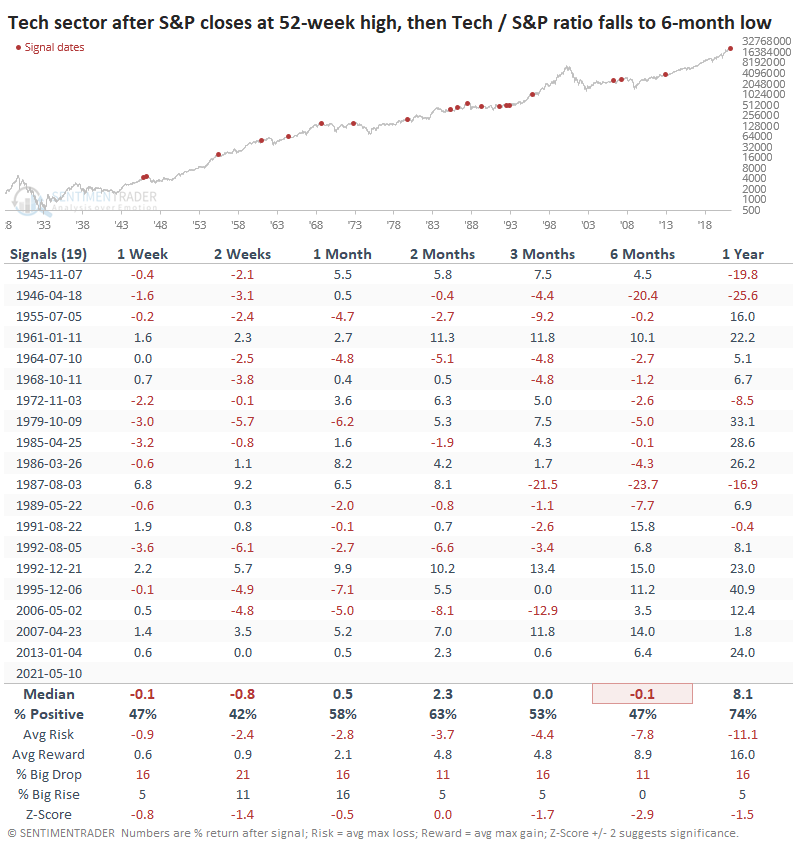
It was a considerably worse sign for the Technology sector, though. Over the next 6 months, it showed a negative average return, was positive less than half the time and suffered risk about equal to reward.

TECH USUALLY DIDN'T RESUME LEADERSHIP

The tendency for Tech to show weaker returns means that the ratio of Tech to the S&P showed a consistently negative bias.

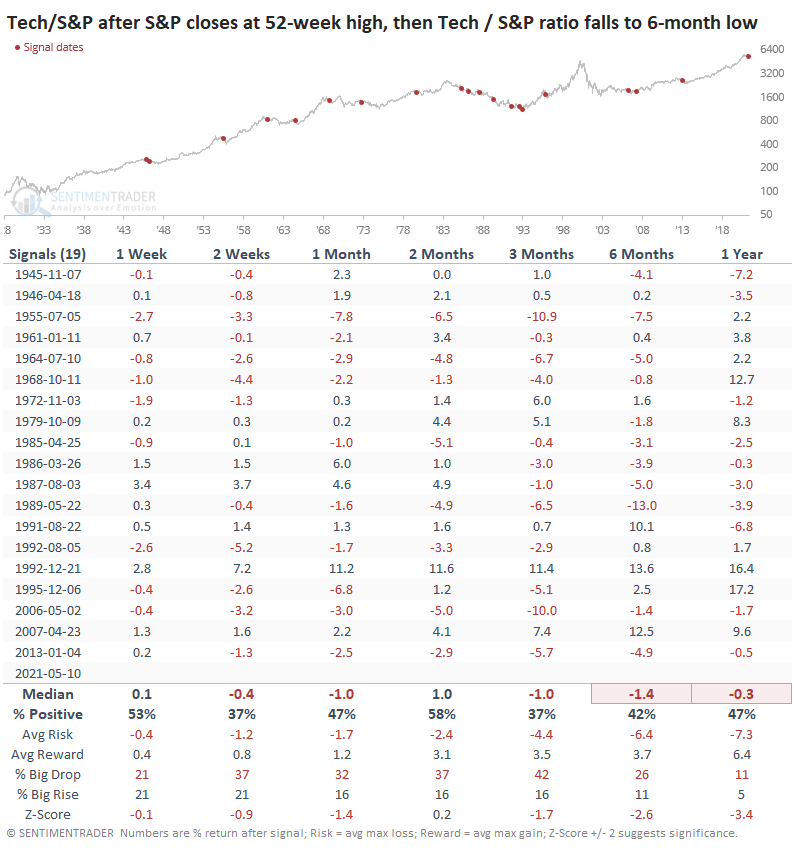
Across almost all time frames, the ratio was negative, and significantly so over the medium- to long-term. Over the past 30 years, there were only 2 exceptions when Tech managed to turn itself around from relative weakness and become a leader again. The others all failed.

A common market tactic is to focus longs on leading groups and shorts on trailing ones. That works, except for those major turning points when the relationships hit an extreme and mean-revert. There isn't much we see lately that suggests Tech is at that point, so we should continue to see these stocks underperform a broader basket.

PRODUCTS
SentimenTrader
Trading Tools
Indicators & Data API
‍
Strategies & Scanner
‍
Research Reports
FREE
RESOUrCES
Simple Backtest
Calculator
Simple Seasonality
Calculator
The Kelly Criterion
Calculator
Sentiment Geo Map
‍
Public Research Reports
‍
Education
Sentiment Indicators
‍
Technical Indicators
‍
Pricing
Bundle pricing
‍
FAQ
‍
Announcements
‍
COMPANY
‍
About
‍
In the News
‍
Testimonials
‍
Client Success Stories
CONTACT
‍
General Inquiries
‍
Media Inquiries
‍
Financial Professionals Inquiries
‍
© 2026 Sundial Capital Research Inc. All rights reserved.
Setsail Marketing
TermsPrivacyAffiliate Program
Risk Disclosure: The information and tools provided are for research and analytical purposes only and are not intended as investment advice. Market analysis involves uncertainty, and outcomes may differ from expectations. Users should conduct their own due diligence and consider their individual circumstances before making any financial decisions. Past performance is not necessarily indicative of future results.

Hypothetical Performance Disclosure: Hypothetical performance results have many inherent limitations, some of which are described below. No representation is being made that any account will or is likely to achieve profits or losses similar to those shown; in fact, there are frequently sharp differences between hypothetical performance results and the actual results subsequently achieved by any particular trading program. One of the limitations of hypothetical performance results is that they are generally prepared with the benefit of hindsight. In addition, hypothetical trading does not involve financial risk, and no hypothetical trading record can completely account for the impact of financial risk of actual trading. for example, the ability to withstand losses or to adhere to a particular trading program in spite of trading losses are material points which can also adversely affect actual trading results. There are numerous other factors related to the markets in general or to the implementation of any specific trading program which cannot be fully accounted for in the preparation of hypothetical performance results and all which can adversely affect trading results.

Testimonial Disclosure: Testimonials appearing on this website may not be representative of other clients or customers and is not a guarantee of future performance or success.