
Testing earnings models for other countries besides the U.S.
I recently examined the S&P 500's trailing earnings and earnings estimates. My conclusion was:
Looking at the trend in earnings can help investors and traders time the market from a long term, fundamental trend following perspective.
I originally only tested this concept on the S&P 500. But does this work in other western markets, like Germany, Australia, UK, Canada? Is this strategy (as Ray Dalio calls it) "timeless and universal?" I ran the following strategy on 4 different countries' stock indices:
- DAX (Germany)
- S&P/ASX 200 (Australia)
- S&P/TSX Composite Index (Canada)
- FTSE 100 (U.K.)
The strategy is as follows:
- If the stock index's 12 month trailing earnings' 7 month average is up or the same as the previous month's 7 month average, buy and hold the stock index.
- Otherwise, SELL and do 1 of 7 things:
1 of 7 things:
- Shift into 100% cash
- Short the stock index
- Buy and hold the Bloomberg Barclays US Aggregate Bond Total Return Index
- Buy and hold the Bloomberg Barclays US Corporate Bond Total Return Index
- Buy and hold the Bloomberg Barclays US Treasury Bond Total Return Index
- Buy and hold the Bloomberg Barclays 1-5 Year US Treasury Bond Total Return Index
- Buy and hold gold
*I would prefer to use the country's own bond index instead of a U.S. bond index, but historical data for ex-U.S. bond indices is limited. Investing in ex-U.S. stock indices + U.S. bond indices also introduces the problem of currency conversions, which I have not included in this study. This study is purely meant to demonstrate the usefulness (or lack of) of trailing earnings as a long term timing indicator.
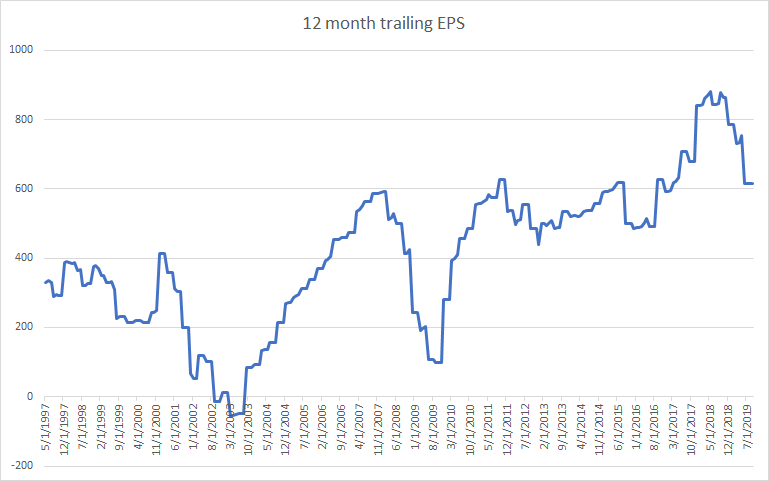
DAX
Here's the DAX's 12 month trailing EPS:
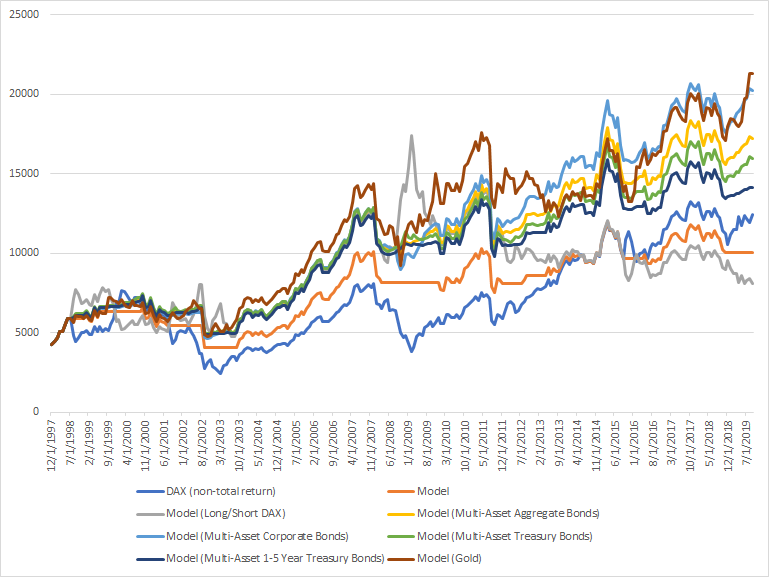
From December 1997 - September 2019:
- Buy and hold = an average of 5.05% per year
- Model (cash) = an average of 4.02% per year
- Model (long/short) = an average of 3.01% per year
- Model (U.S. Aggregate Bonds) = an average of 6.64% per year
- Model (U.S. Corporate Bonds) = an average of 7.43% per year
- Model (U.S. Treasury Bonds) = an average of 6.27% per year
- Model (U.S. 1-5 Year Treasury Bonds) = an average of 5.67% per year
- Model (gold) = an average of 7.68% per year
*Historical returns do not take into consideration dividends reinvested, different currencies & currency fluctuations, transaction costs, slippage, etc.
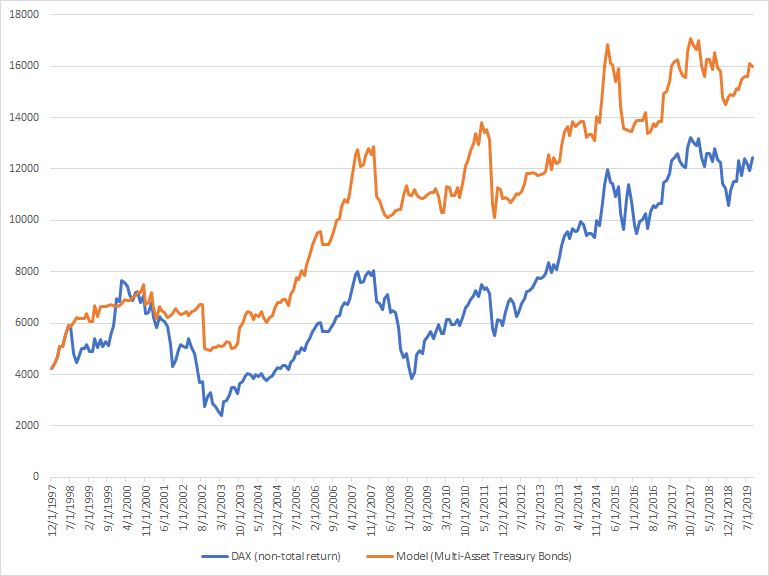
Since the above chart is hard to read (too many equity curves), the following chart only demonstrates the DAX vs. the Model (U.S. Treasury Bonds):
Max Drawdowns (using monthly CLOSE $):
- Model (cash) = -38.02%
- Model (long/short) = -53.33%
- Model (U.S. Aggregate Bonds) = -33.67%
- Model (U.S. Corporate Bonds) = -36.53%
- Model (U.S. Treasury Bonds) = -34.24%
- Model (U.S. 1-5 Year Treasury Bonds) = -33.59%
- Model (gold) = -36.04%
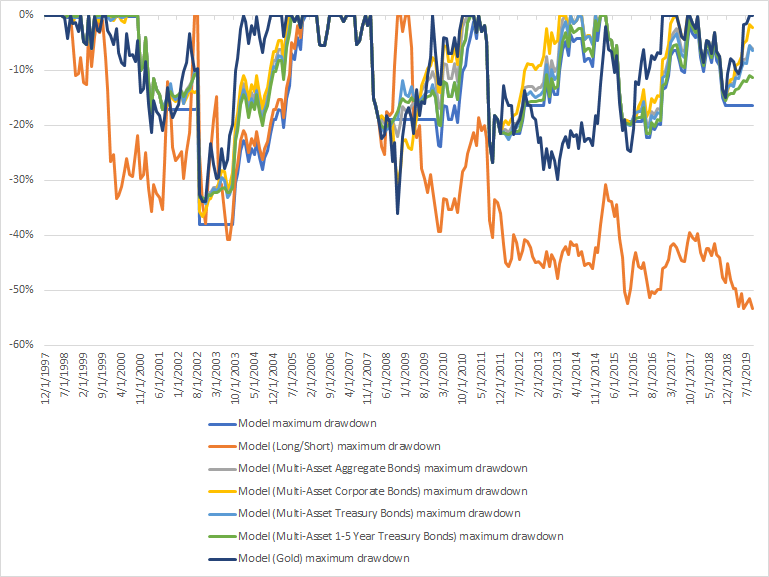
Since the above chart is hard to read (too many drawdown curves), the following chart only demonstrates the Model (U.S. Treasury Bonds)'s drawdowns:
Max Drawdown / Average annual return ratio:
- Model (cash) = 9.43
- Model (long/short) = 17.71
- Model (U.S. Aggregate Bonds) = 5.06
- Model (U.S. Corporate Bonds) = 4.91
- Model (U.S. Treasury Bonds) = 5.45
- Model (U.S. 1-5 Year Treasury Bonds) = 5.92
- Model (gold) = 6.35
S&P/ASX 200
Here's the S&P/ASX 200's 12 month trailing EPS:
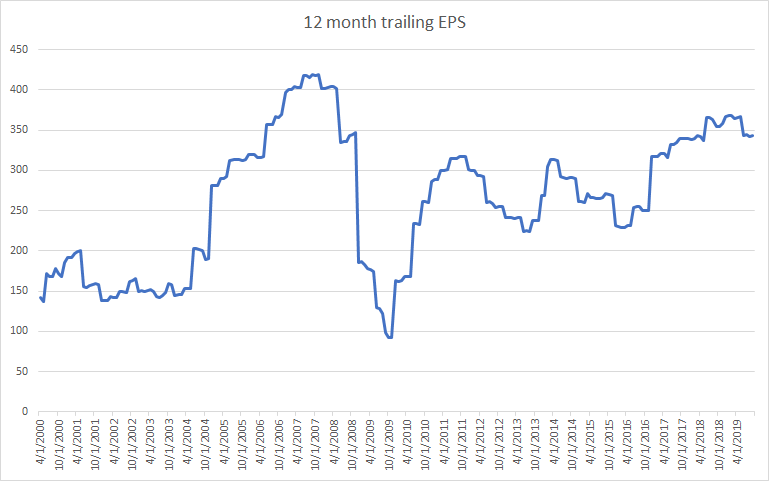
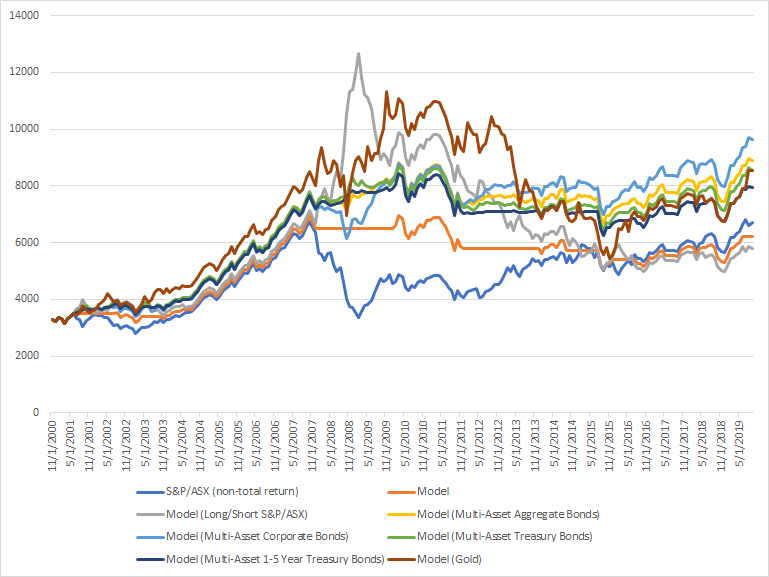
From November 2000 - September 2019:
- Buy and hold = 3.86% per year
- Model (cash) = an average of 3.46% per year
- Model (long/short)= an average of 3.06% per year
- Model (U.S. Aggregate Bonds) = an average of 5.45% per year
- Model (U.S. Corporate Bonds) = an average of 5.89% per year
- Model (U.S. Treasury Bonds) = an average of 5.22% per year
- Model (U.S. 1-5 Year Treasury Bonds) = an average of 4.82% per year
- Model (gold) = an average of 5.2%
*Historical returns do not take into consideration dividends reinvested, different currencies & currency fluctuations, transaction costs, slippage, etc.
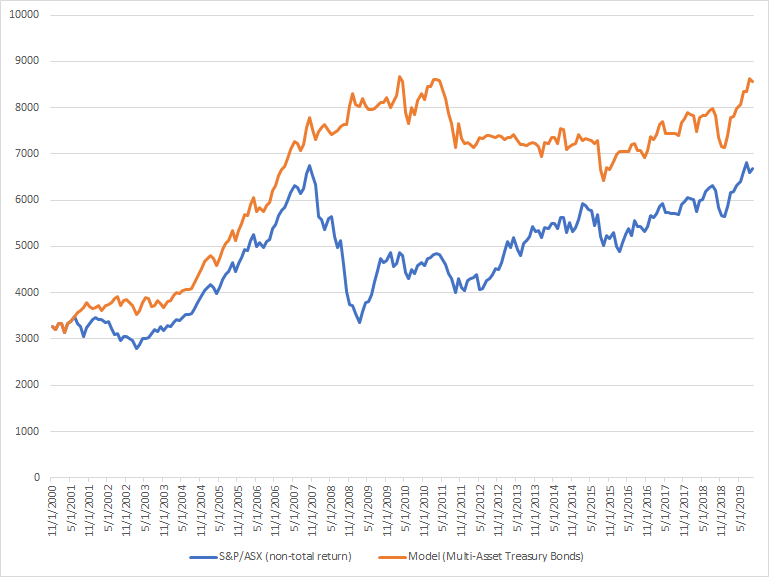
Since the above chart is hard to read (too many equity curves), the following chart only demonstrates the S&P/ASX 200 vs. the Model (U.S. Treasury Bonds):
Max Drawdowns (using monthly CLOSE $):
- Model (cash) = -27.50%
- Model (long/short) = -60.66%
- Model (U.S. Aggregate Bonds) = -24.2%
- Model (U.S. Corporate Bonds) = -20.42%
- Model (U.S. Treasury Bonds) = -26.06%
- Model (U.S. 1-5 Year Treasury Bonds) = -25.83%
- Model (gold) = -51.97%
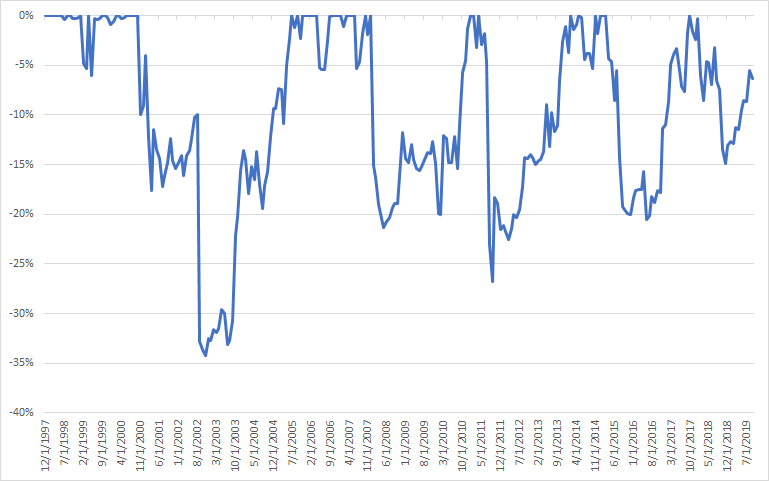
Since the above chart is hard to read (too many drawdown curves), the following chart only demonstrates the Model (U.S. Treasury Bonds)'s drawdowns:
Max Drawdown / Average annual return ratio:
- Model (cash) = 7.94
- Model (long/short) = 19.79
- Model (U.S. Aggregate Bonds) = 4.43
- Model (U.S. Corporate Bonds) = 3.46
- Model (U.S. Treasury Bonds) = 4.98
- Model (U.S. 1-5 Year Treasury Bonds) = 5.35
- Model (gold) = 10.77
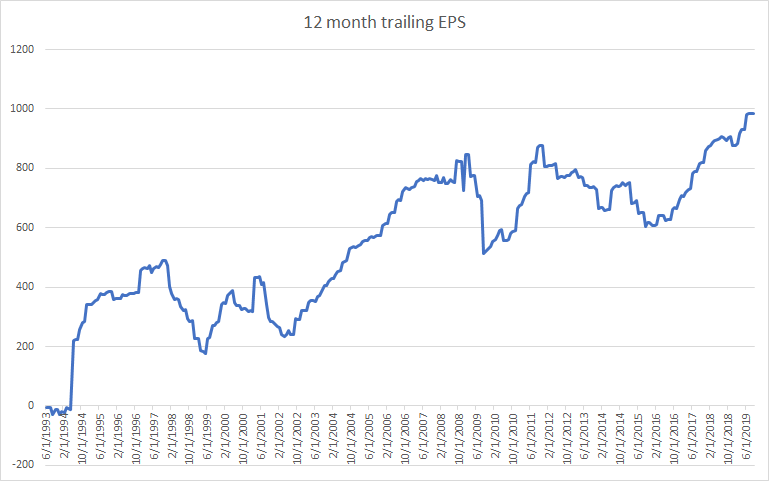
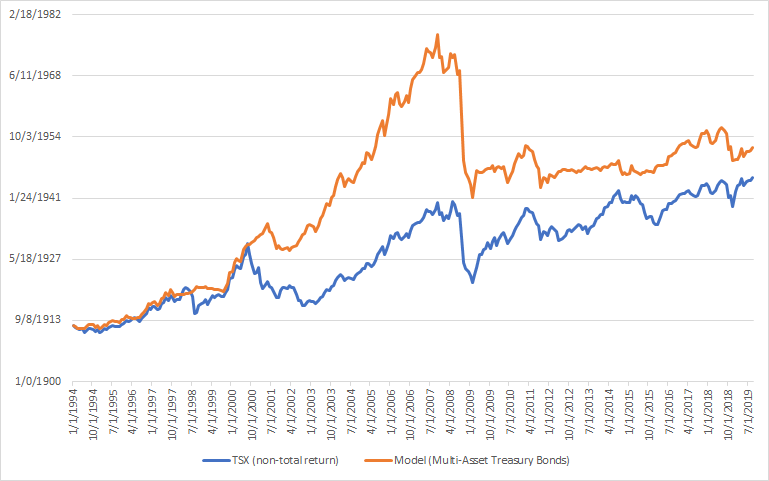
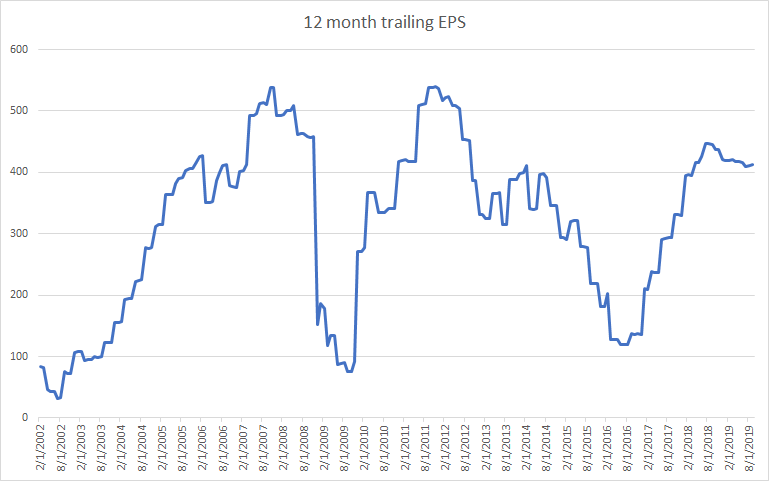
S&P/TSX Composite Index
Here's the S&P/TSX Composite's 12 month trailing EPS:
From January 1994 - September 2019:
- Buy and hold = an average of 5.17% per year
- Model (cash) = an average of 4.77% per year
- Model (long/short) = an average of 4.38% per year
- Model (U.S. Aggregate Bonds) = an average of 6.20% per year
- Model (U.S. Corporate Bonds) = an average of 6.82% per year
- Model (U.S. Treasury Bonds) = an average of 5.74% per year
- Model (U.S. 1-5 Year Treasury Bonds) = an average of 5.87% per year
- Model (gold) = an average of 5.17% per year
*Historical returns do not take into consideration dividends reinvested, different currencies & currency fluctuations, transaction costs, slippage, etc.
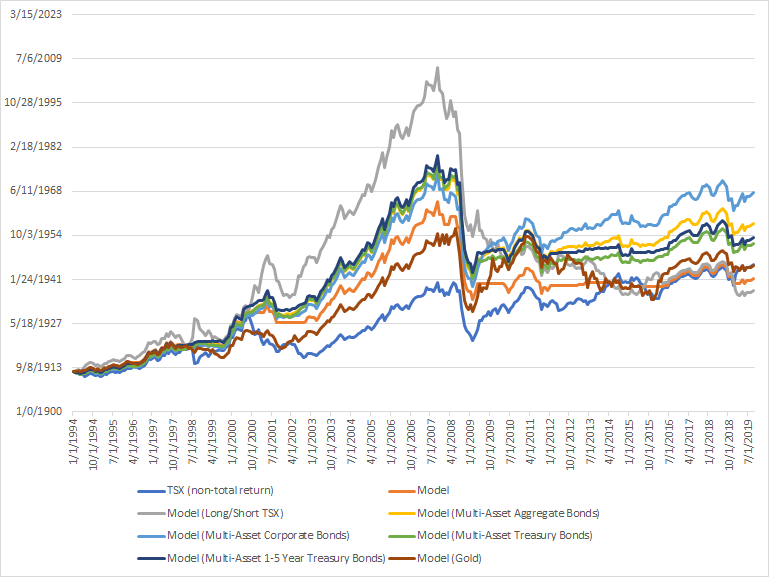
Since the above chart is hard to read (too many equity curves), the following chart only demonstrates the S&P/TSX Composite vs. the Model (U.S. Treasury Bonds):
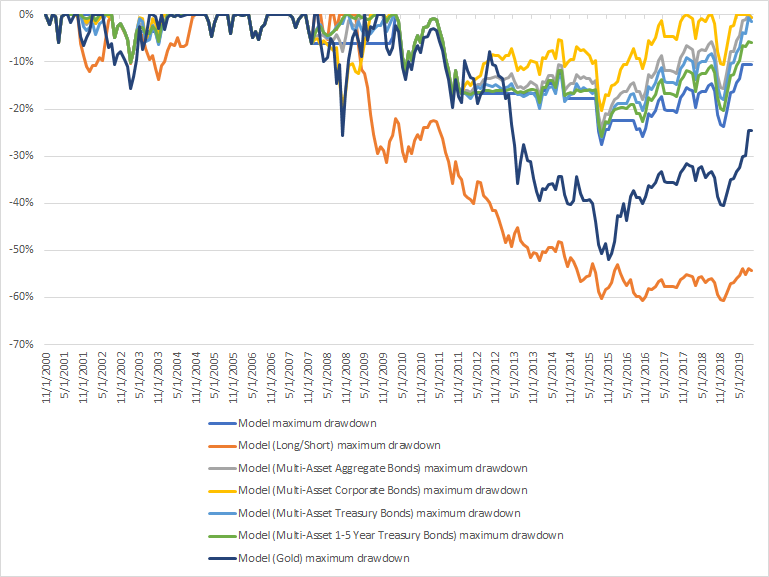
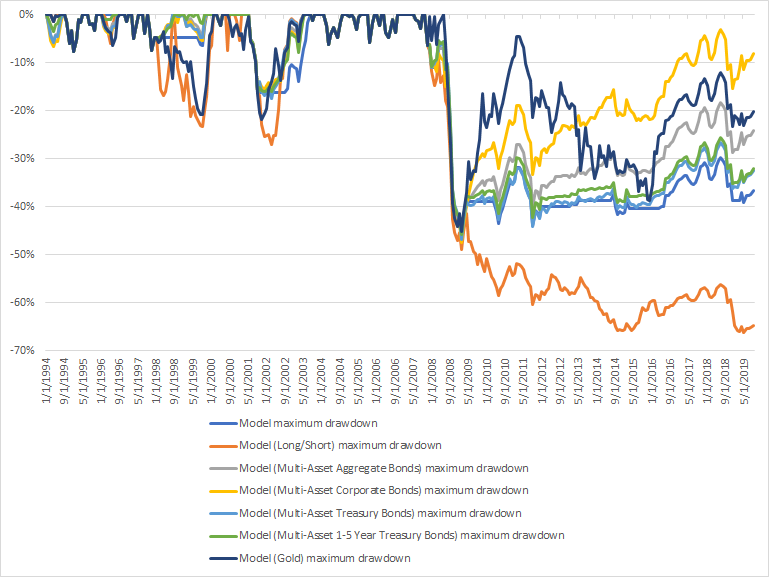
Max Drawdowns (using monthly CLOSE $):
- Model (cash) = -46.76%
- Model (long/short) = -66.15%
- Model (U.S. Aggregate Bonds) = -46.76%
- Model (U.S. Corporate Bonds) = -47.52%
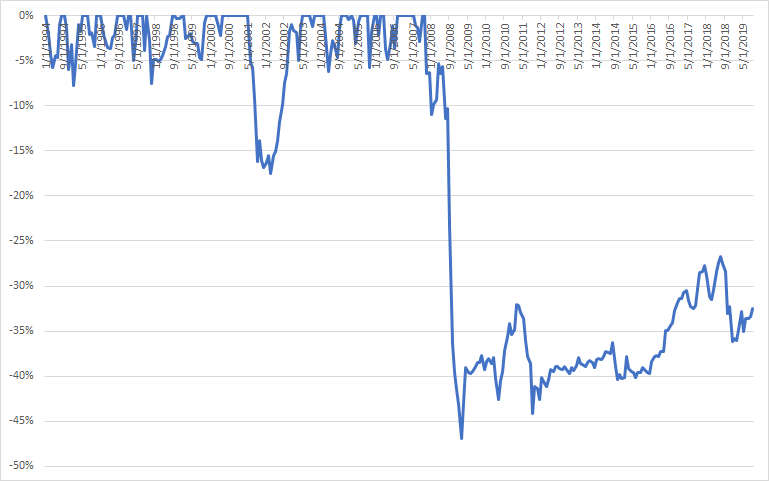
- Model (U.S. Treasury Bonds) = -46.87%
- Model (U.S. 1-5 Year Treasury Bonds) = -45.91%
- Model (gold) = -45.2%
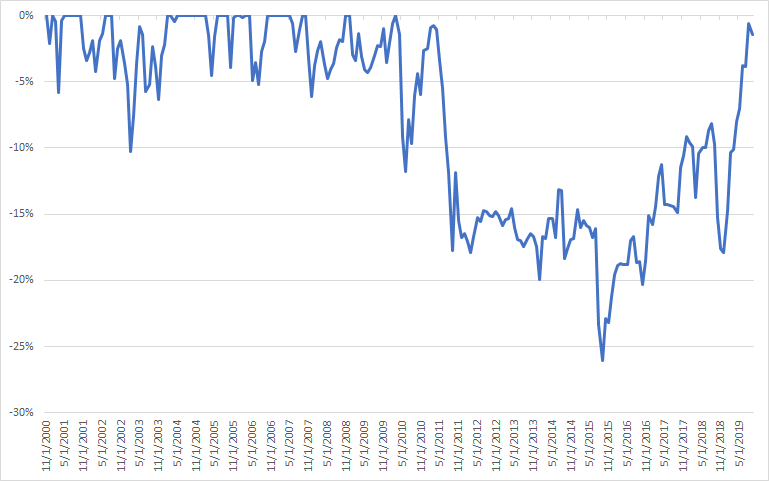
Since the above chart is hard to read (too many drawdown curves), the following chart only demonstrates the Model (U.S. Treasury Bonds)'s drawdowns:
Max Drawdown / Average annual return ratio:
- Model (cash) = 9.78
- Model (long/short) = 15.1
- Model (U.S. Aggregate Bonds) = 7.53
- Model (U.S. Corporate Bonds) = 6.96
- Model (U.S. Treasury Bonds) = 8.15
- Model (U.S. 1-5 Year Treasury Bonds) = 7.81
- Model (gold) = 8.74
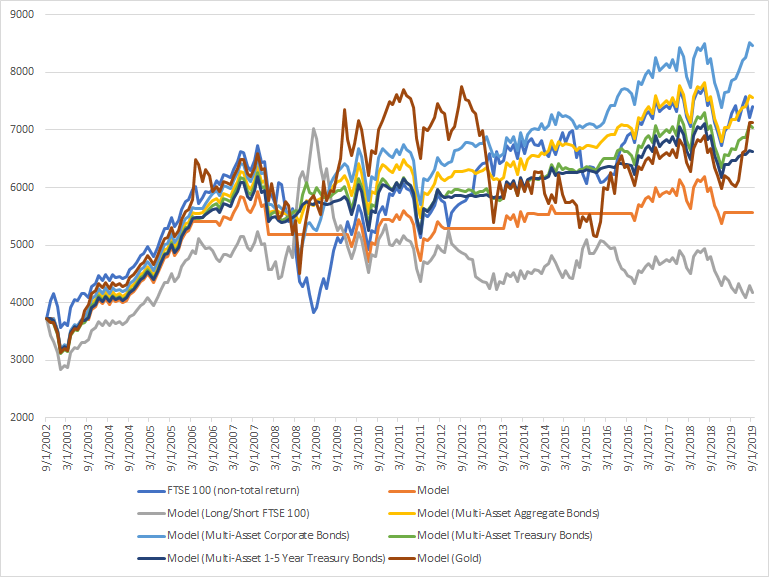
FTSE 100
Here's the FTSE 100's 12 month trailing EPS:
From September 2002 - September 2019:
- Buy and hold = an average of 4.12% per year
- Model (cash) = an average of 2.39% per year
- Model (long/short) = an average of 0.69% per year
- Model (U.S. Aggregate Bonds) = an average of 4.25% per year
- Model (U.S. Corporate Bonds) = an average of 4.94% per year
- Model (U.S. Treasury Bonds) = an average of 3.81% per year
- Model (U.S. 1-5 Year Treasury Bonds) = an average of 3.45% per year
- Model (gold) = an average of 3.9% per year
*Historical returns do not take into consideration dividends reinvested, different currencies & currency fluctuations, transaction costs, slippage, etc.
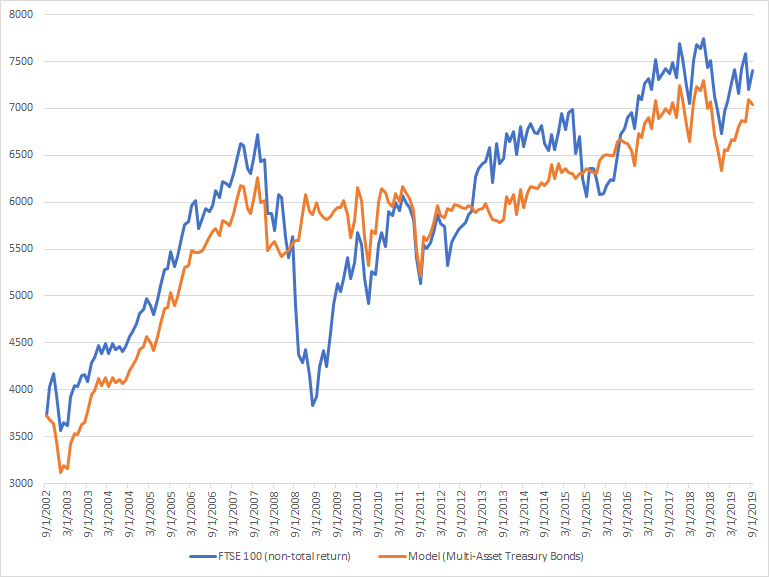
Since the above chart is hard to read (too many equity curves), the following chart only demonstrates the FTSE 100 vs. the Model (U.S. Treasury Bonds):
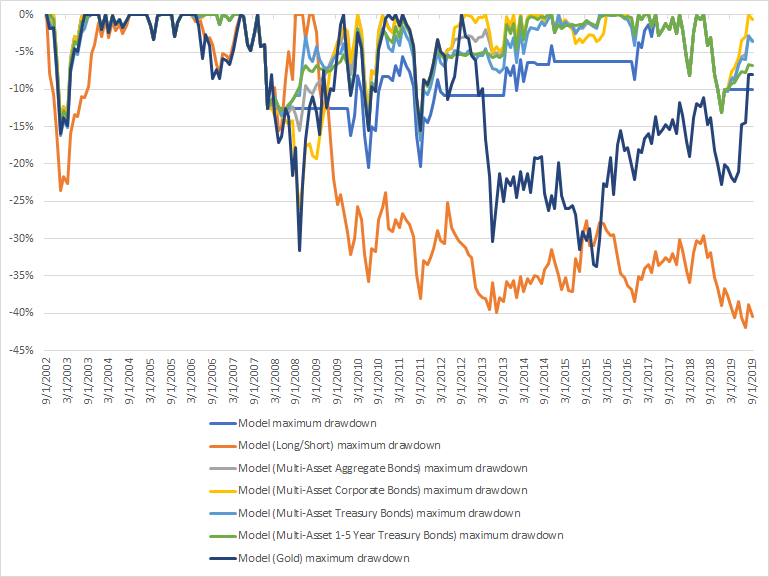
Max Drawdowns (using monthly CLOSE $):
- Model (cash) = -20.53%
- Model (long/short) = -41.87%
- Model (U.S. Aggregate Bonds) = -15.5%
- Model (U.S. Corporate Bonds) = -25.93%
- Model (U.S. Treasury Bonds) = -16.84%
- Model (U.S. 1-5 Year Treasury Bonds) = -15.82%
- Model (gold) = -33.69%
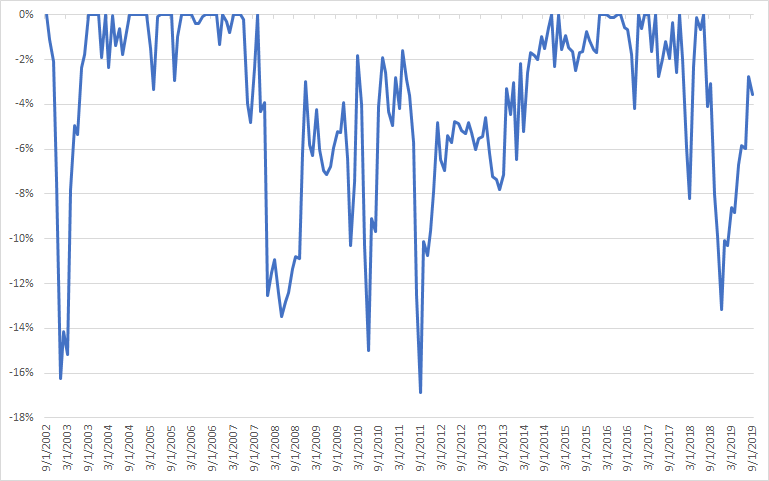
Since the above chart is hard to read (too many drawdown curves), the following chart only demonstrates the Model (U.S. Treasury Bonds)'s drawdowns:
Max Drawdown / Average annual return ratio:
- Model (cash) = 8.56
- Model (long/short) = 60.39
- Model (U.S. Aggregate Bonds) = 3.64
- Model (U.S. Corporate Bonds) = 5.24
- Model (U.S. Treasury Bonds) = 4.41
- Model (U.S. 1-5 Year Treasury Bonds) = 4.58
- Model (gold) = 8.63
Conclusion
My original premise was:
Looking at the trend in earnings can help investors and traders time the market from a long term, fundamental trend following perspective.
Applying this premise to other markets demonstrates that this is not always true:
- Using the trend in earnings helps IF the stock index's earnings have a strong, multi-year trend (big upswings and big downswings). This has occurred in the U.S. stock market from 1990-present. The S&P 500's earnings consistently trended higher from 1990-2000, trended lower from 2001-2002, trended higher from 2003-2007, trended lower from 2008-2009, and trend higher from 2009-present.
- Using the trend in earnings DOESN'T help if the earnings do not have a clear trend, which has been the case for many ex-U.S. stock markets since 2009 (also why ex-U.S. stocks have performed much more poorly than U.S. equities post-2009).
- Like any trend following strategy (whether technical or fundamental), if there is no clear long term trend, then this strategy will get hurt by death-by-a-thousand-cuts.
- Earnings (both estimated EPS and trailing EPS) are not leading indicators. They're lagging indicators.
Corporate earnings don't always consistently trend higher. For example, U.S. corporate earnings in the 1980s were very choppy. In fact, the stock market doesn't need corporate earnings to increase in order for the stock market to go up, hence why using corporate earnings as a trend following system is a flawed strategy. Here's why:
Imagine you own Bond XYZ, which yields 5% per year, and any proceeds can be used to buy more of Bond XYZ. You begin with $100. After Year 1 you have $105. After Year 2 you have $110.25. After year 3 you have $115.76, so so on.
The bond's "earnings" didn't significantly increase. It's still the same 5%. But as time goes up, your holdings accumulate earnings, which increases the total value of your holdings.
Now imagine the stock market is worth $100 (think about stocks as a piece of a business, not as pieces of paper to be bought and sold). If it earns $5 in corporate profits every single year, earnings don't have to trend higher for the stock market to be worth more. The stock market's value increases by $5 each year, hence it's intrinsic value goes up over time.
This is why inflation-adjusted corporate earnings grew very slowly from 1900-1990, even though the stock market's value grew much faster.
*This is especially true in earlier decades when dividend yields were much higher.
Got any questions or comments? Please email me at [email protected]