
Testing indicators + models
I like trading/investment models because they tell you exactly what to do all the time. Once you've settled on a model, there's little room for ambiguity. Here's a popular long term model:
- Buy and hold the S&P 500 if the S&P 500 is >= its 12 month moving average, OR the Unemployment Rate is <= its 12 month moving average
- Otherwise, SELL
You can do 1 of 6 things when you SELL:
- Model: Shift into 100% cash
- Model (long/short): Short the S&P 500
- Model (Multi-Asset Aggregate Bonds): Buy and hold the Bloomberg Barclays US Aggregate Bond Total Return Index
- Model (Multi-Asset Corporate Bonds): Buy and hold the Bloomberg Barclays US Corporate Bond Total Return Index
- Model (Multi-Asset Treasury Bonds): Buy and hold the Bloomberg Barclays US Treasury Bond Total Return Index
- Model (Gold): Buy gold
This model outperforms buy and hold primarily by avoiding the big bear markets. But is it possible to improve returns by using a few technical indicators to avoid some pullbacks and corrections? I tested the following 8 indicators:
- Stock/Bond Ratio
- SPY Liquidity Premium
- NYSE HiLo Logic Index
- Hindenburg Omen
- Medium-Term Risk Levels
- Risk Appetite Index
- Intermediate Term Optimism Index (Optix)
- Smart Money / Dumb Money Confidence Spread
The test for these indicators is simple:
Original model
- Buy and hold the S&P 500 nontotal return index if the S&P 500 nontotal return index is >= its 12 month moving average, OR the Unemployment Rate is <= its 12 month moving average
- Otherwise, SELL and shift 100% into the Bloomberg Barclays US Aggregate Bond Total Return Index
Testing new model
- Buy and hold the S&P 500 nontotal return index if the S&P 500 nontotal return index is >= its 12 month moving average, OR the Unemployment Rate is <= its 12 month moving average
- Buy and hold the S&P 500 nontotal return index UNLESS the following SentimenTrader indicator is on a SELL signal
- Otherwise, SELL and shift 100% into the Bloomberg Barclays US Aggregate Bond Total Return Index
SELL signal from SentimenTrader indicator:
- Stock/Bond Ratio
- SPY Liquidity Premium
- NYSE HiLo Logic Index
- Hindenburg Omen
- Medium-Term Risk Levels
- Risk Appetite Index
- Intermediate Term Optimism Index (Optix)
- Smart Money / Dumb Money Confidence Spread
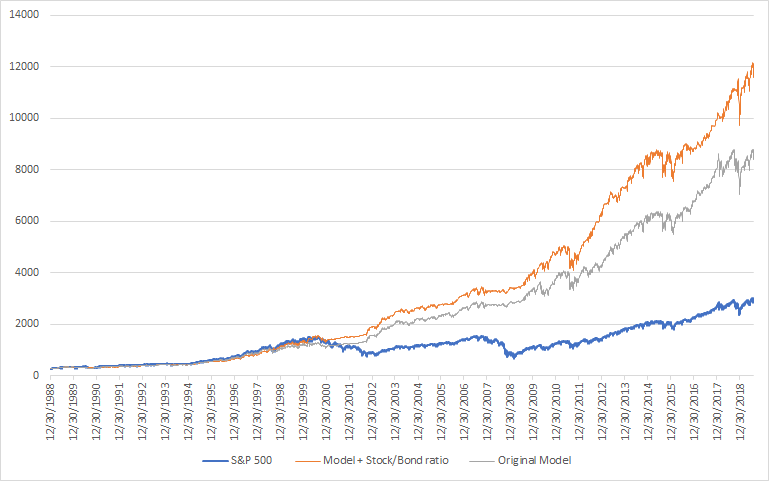
Model + Stock/Bond Ratio
- Buy and hold the S&P 500 nontotal return index if the S&P 500 nontotal return index is >= its 12 month moving average, OR the Unemployment Rate is <= its 12 month moving average. Otherwise, SELL and shift 100% into the Bloomberg Barclays US Aggregate Bond Total Return Index
- Buy and hold the S&P 500 nontotal return index UNLESS sometime over the past 2 months, the Stock/Bond Ratio was > 2.5. If SELL, shift 100% into the Bloomberg Barclays US Aggregate Bond Total Return Index
Linear scale:
Log scale:
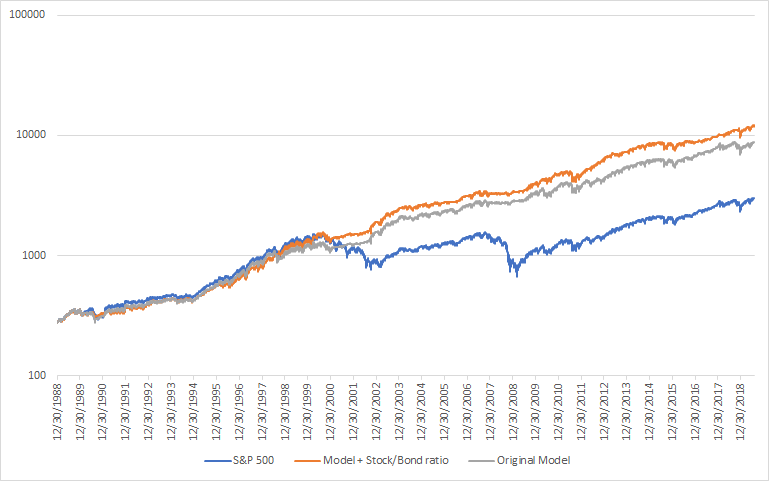
From January 1989 - July 2019:
- Buy and hold = average annual return of 8.11%
- Original model = average annual return of 11.95%
- Model + Stock/Bond Ratio = average annual return of 13.13%
Adding the Stock/Bond Ratio to the original model increases annual returns by approximately 1.18% per year
*Historical returns do not include dividends reinvested, transaction costs, slippage, ETF mismatching, etc.
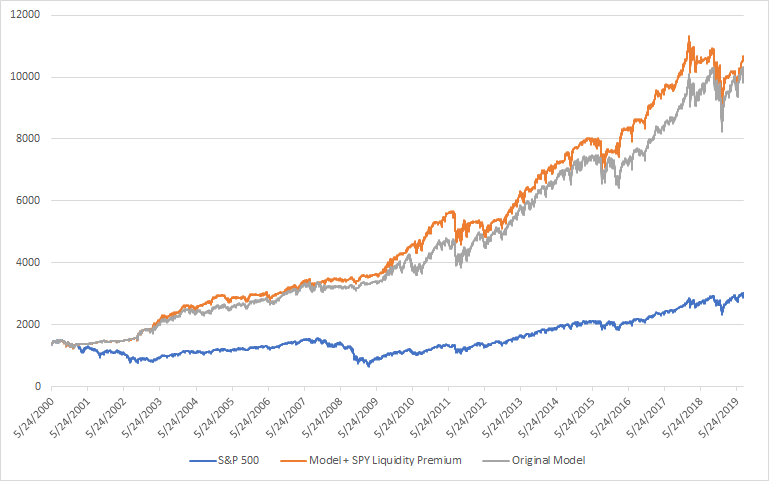
Model + SPY Liquidity Premium
- Buy and hold the S&P 500 nontotal return index if the S&P 500 nontotal return index is >= its 12 month moving average, OR the Unemployment Rate is <= its 12 month moving average. Otherwise, SELL and shift 100% into the Bloomberg Barclays US Aggregate Bond Total Return Index
- Buy and hold the S&P 500 nontotal return index UNLESS sometime over the past 2 months, SPY Liquidity Premium was < -0.3. If SELL, shift 100% into the Bloomberg Barclays US Aggregate Bond Total Return Index
Linear scale:
Log scale:
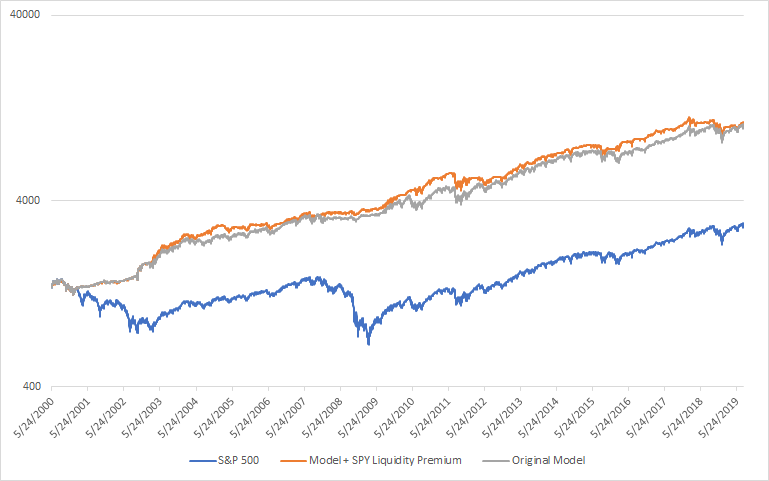
From May 2000 - July 2019:
- Buy and hold = average annual return of 4.09%
- Original model = average annual return of 10.96%
- Model + SPY Liquidity Premium = average annual return of 11.13%
Adding SPY Liquidity Premium to the original model increases annual returns by approximately 0.17% per year
*Historical returns do not include dividends reinvested, transaction costs, slippage, ETF mismatching, etc.
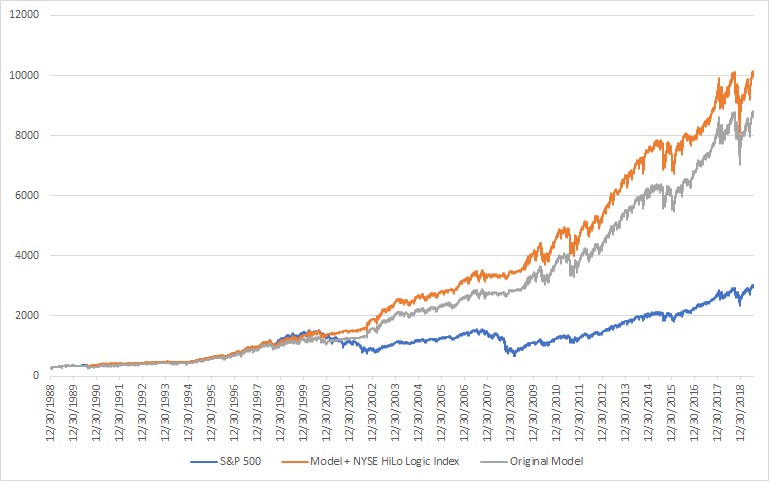
Model + NYSE HiLo Logic Index
- Buy and hold the S&P 500 nontotal return index if the S&P 500 nontotal return index is >= its 12 month moving average, OR the Unemployment Rate is <= its 12 month moving average. Otherwise, SELL and shift 100% into the Bloomberg Barclays US Aggregate Bond Total Return Index
- Buy and hold the S&P 500 nontotal return index UNLESS sometime over the past 2 months, the NYSE HiLo Logic Index was > 3. If SELL, shift 100% into the Bloomberg Barclays US Aggregate Bond Total Return Index
Linear scale:
Log scale:
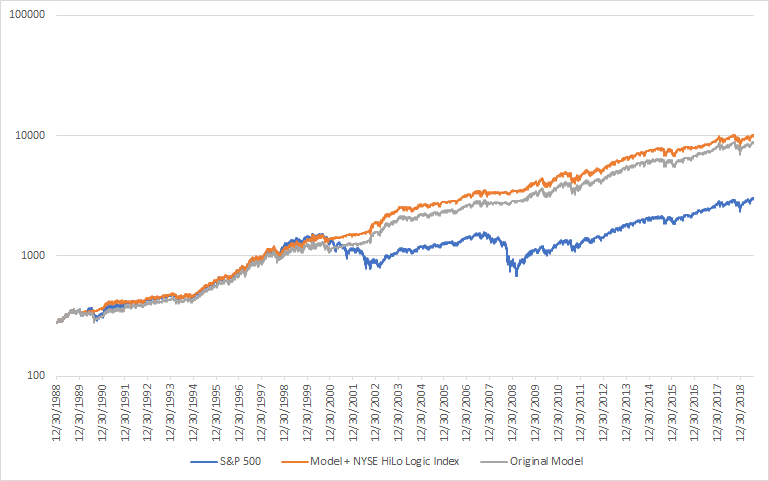
From January 1989 - July 2019:
- Buy and hold = average annual return of 8.11%
- Original model = average annual return of 11.95%
- Model + NYSE HiLo Logic Index = average annual return of 12.47%
Adding the NYSE HiLo Logic Index to the original model increases annual returns by approximately 0.52% per year
*Historical returns do not include dividends reinvested, transaction costs, slippage, ETF mismatching, etc.
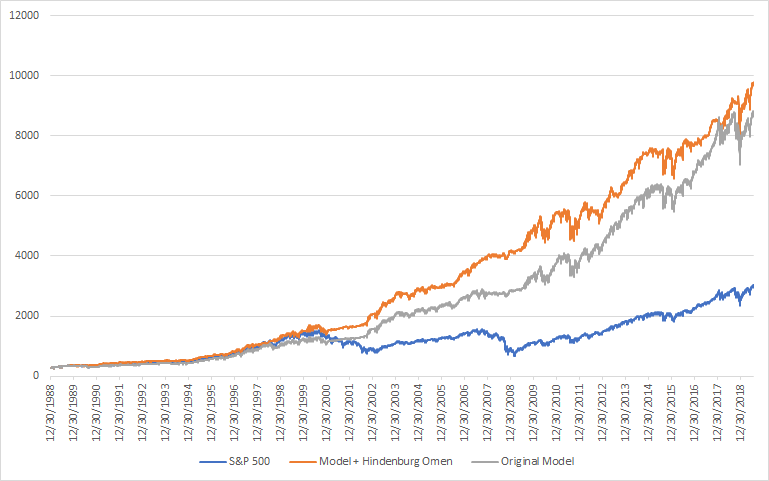
Model + Hindenburg Omen
- Buy and hold the S&P 500 nontotal return index if the S&P 500 nontotal return index is >= its 12 month moving average, OR the Unemployment Rate is <= its 12 month moving average. Otherwise, SELL and shift 100% into the Bloomberg Barclays US Aggregate Bond Total Return Index
- Buy and hold the S&P 500 nontotal return index UNLESS sometime over the past 2 months, the Hindenburg Omen was triggered. If SELL, shift 100% into the Bloomberg Barclays US Aggregate Bond Total Return Index
Linear scale:
Log scale:
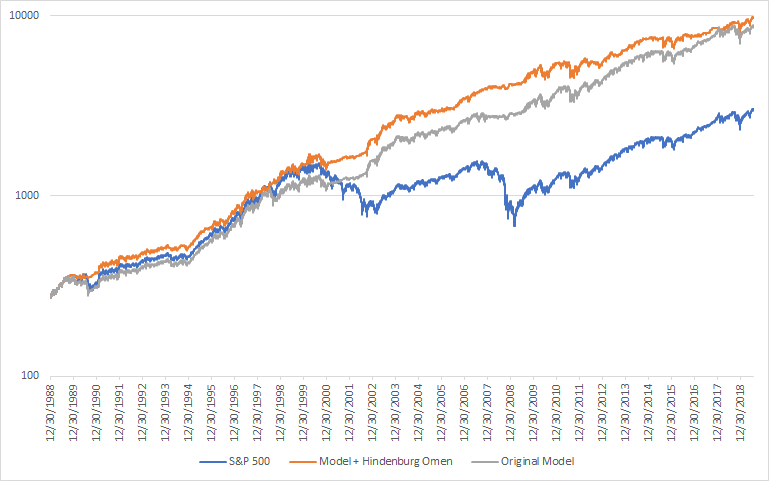
From January 1989 - July 2019:
- Buy and hold = average annual return of 8.11%
- Original model = average annual return of 11.95%
- Model + Hindenburg Omen = average annual return of 12.34%
Adding the Hindenburg Omen to the original model increases annual returns by approximately 0.39% per year
*Historical returns do not include dividends reinvested, transaction costs, slippage, ETF mismatching, etc.
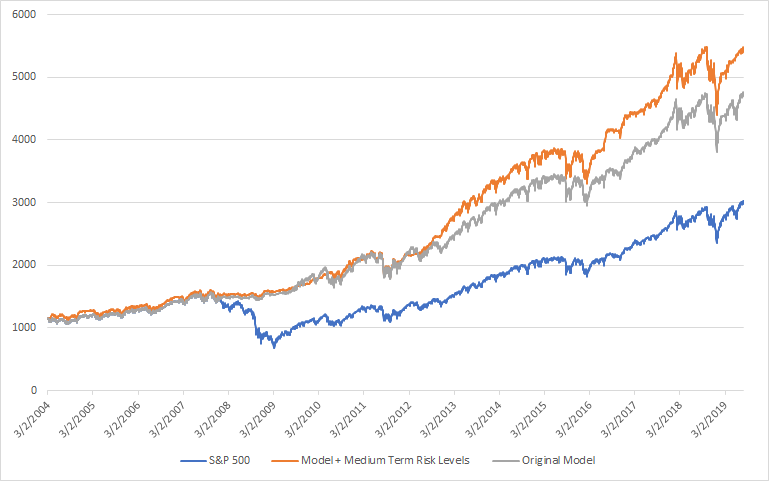
Model + Medium Term Risk Levels
- Buy and hold the S&P 500 nontotal return index if the S&P 500 nontotal return index is >= its 12 month moving average, OR the Unemployment Rate is <= its 12 month moving average. Otherwise, SELL and shift 100% into the Bloomberg Barclays US Aggregate Bond Total Return Index
- Buy and hold the S&P 500 nontotal return index UNLESS sometime over the past 2 months, Medium Term Risk Levels was > 7. If SELL, shift 100% into the Bloomberg Barclays US Aggregate Bond Total Return Index
Linear scale:
Log scale:
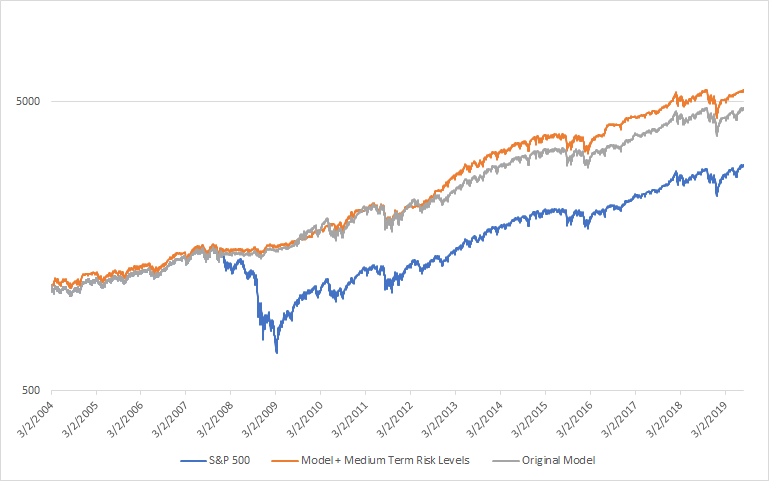
From March 2004 - July 2019:
- Buy and hold = average annual return of 6.47%
- Original model = average annual return of 9.64%
- Model + Medium Term Risk Levels = average annual return of 10.64%
Adding Medium Term Risk Levels to the original model increases annual returns by approximately 1% per year
*Historical returns do not include dividends reinvested, transaction costs, slippage, ETF mismatching, etc.
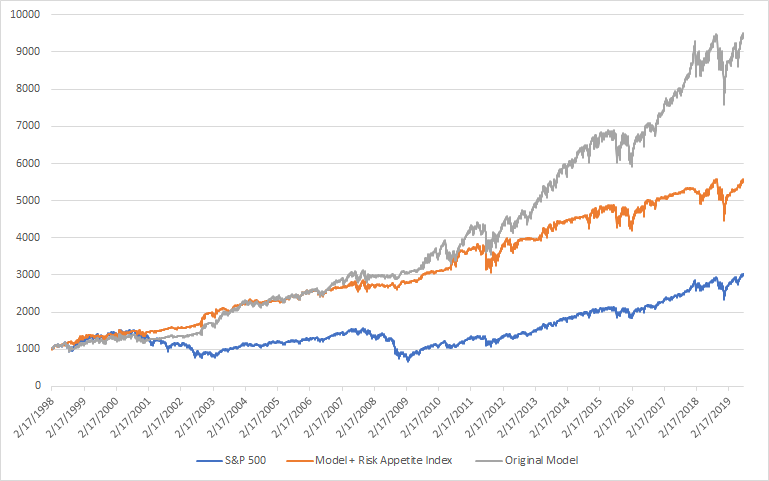
Model + Risk Appetite Index
- Buy and hold the S&P 500 nontotal return index if the S&P 500 nontotal return index is >= its 12 month moving average, OR the Unemployment Rate is <= its 12 month moving average. Otherwise, SELL and shift 100% into the Bloomberg Barclays US Aggregate Bond Total Return Index
- Buy and hold the S&P 500 nontotal return index UNLESS sometime over the past 2 months, the Risk Appetite Index was > 0.8. If SELL, shift 100% into the Bloomberg Barclays US Aggregate Bond Total Return Index
Linear scale:
Log scale:
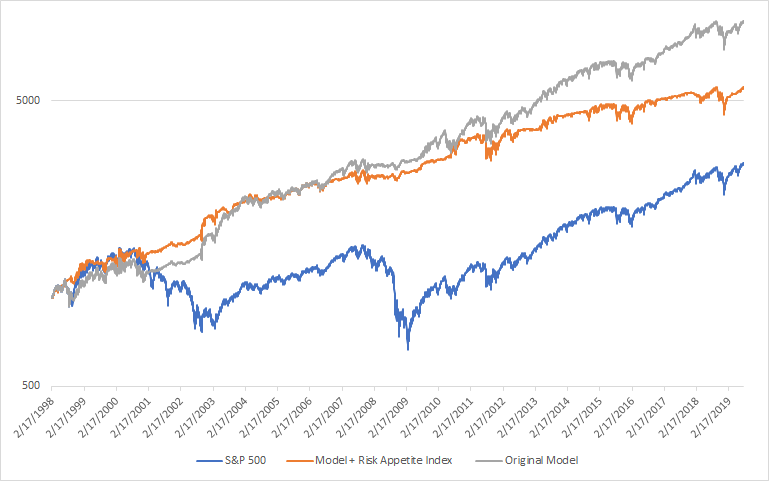
From February 1998 - July 2019:
- Buy and hold = average annual return of 5.18%
- Original model = average annual return of 10.94%
- Model + Risk Appetite Index = average annual return of 8.21%
Adding the Risk Appetite Index to the original model DECREASES annual returns by approximately -2.72% per year
*Historical returns do not include dividends reinvested, transaction costs, slippage, ETF mismatching, etc.
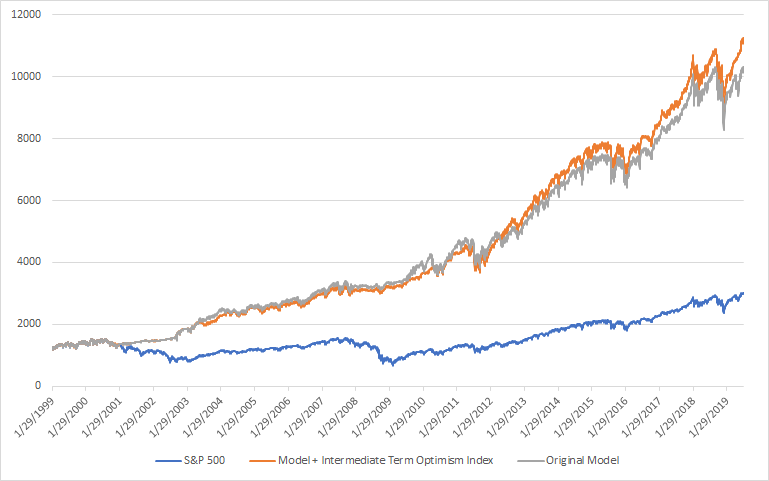
Model + Intermediate Term Optimism Index
- Buy and hold the S&P 500 nontotal return index if the S&P 500 nontotal return index is >= its 12 month moving average, OR the Unemployment Rate is <= its 12 month moving average. Otherwise, SELL and shift 100% into the Bloomberg Barclays US Aggregate Bond Total Return Index
- Buy and hold the S&P 500 nontotal return index UNLESS sometime over the past 2 months, the Intermediate Term Optimism Index was > 80. If SELL, shift 100% into the Bloomberg Barclays US Aggregate Bond Total Return Index
Linear scale:
Log scale:
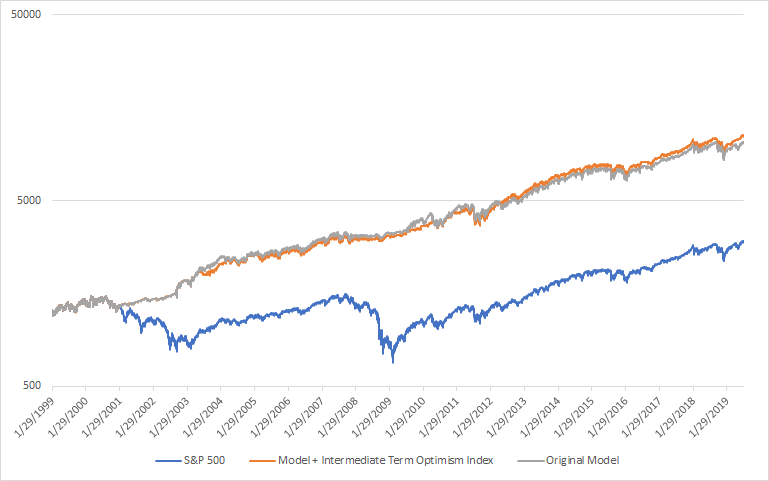
From February 1999 - July 2019:
- Buy and hold = average annual return of 4.28%
- Original model = average annual return of 10.7%
- Model + Intermediate Term Optimism Index = average annual return of 11.17%
Adding the Intermediate Term Optimism Index to the original model increases annual returns by approximately 0.47% per year
*Historical returns do not include dividends reinvested, transaction costs, slippage, ETF mismatching, etc.
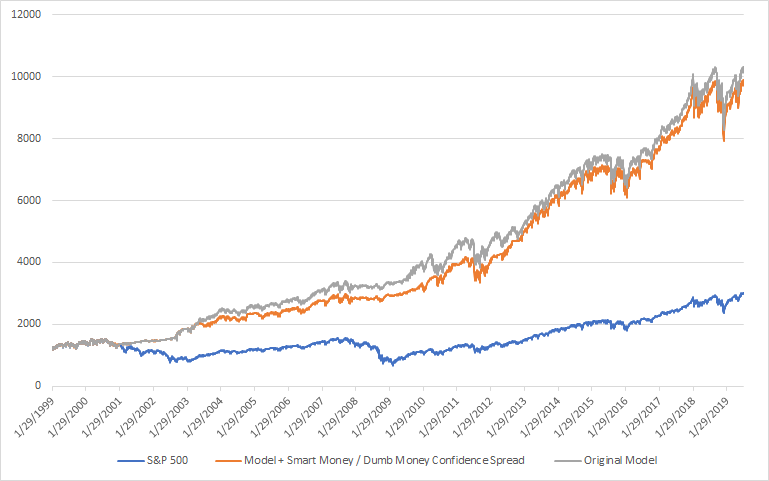
Model + Smart Money / Dumb Money Confidence Spread
- Buy and hold the S&P 500 nontotal return index if the S&P 500 nontotal return index is >= its 12 month moving average, OR the Unemployment Rate is <= its 12 month moving average. Otherwise, SELL and shift 100% into the Bloomberg Barclays US Aggregate Bond Total Return Index
- Buy and hold the S&P 500 nontotal return index UNLESS sometime over the past 2 months, the Smart Money / Dumb Money Confidence Spread was -0.6. If SELL, shift 100% into the Bloomberg Barclays US Aggregate Bond Total Return Index
Linear scale:
Log scale:
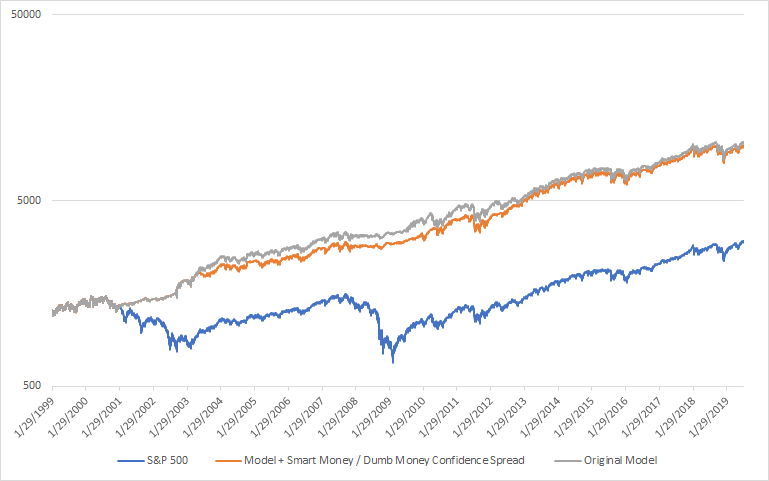
From February 1999 - July 2019:
- Buy and hold = average annual return of 4.28%
- Original model = average annual return of 10.7%
- Model + Smart Money / Dumb Money Confidence Spread = average annual return of 10.47%
Adding the Smart Money / Dumb Money Confidence Spread to the original model DECREASES annual returns by approximately -0.23% per year
*Historical returns do not include dividends reinvested, transaction costs, slippage, ETF mismatching, etc.
Conclusion
Against the original model, adding these indicators increased/decreased average annual returns by:
- Stock/Bond Ratio: +1.18%
- SPY Liquidity Premium: +0.17%
- NYSE HiLo Logic Index: +0.52%
- Hindenburg Omen: +0.39%
- Medium-Term Risk Levels: +1%
- Risk Appetite Index: -2.72%
- Intermediate Term Optimism Index: +0.47%
- Smart Money / Dumb Money Confidence Spread: -0.23%
For the indicators that decreased returns (e.g. Risk Appetite Index), it doesn't mean that they are of no use.
- These tests apply a generic buy signal for each indicator (i.e. buy after 2 months). The most optimal time isn't always to buy after 2 months, so changing time frame or buying strategy might improve their returns.
- The alpha (or lack of) generated by adding these indicators is ONTOP of the alpha that the original model already generated. The original model already significantly beats buy and hold, and in doing so raises the bar for these indicators. If you use these indicators without the original model, you will still beat buy and hold. It's just that there's a lot of overlap between the alpha generated by these indicators and the alpha generated by the original model.
If you have any questions, feel free to email me at [email protected]