
The 50-Week / 100-Week "Death Cross" Is Yet More Bunk

It seems like a cataclysmic technical sell signal triggers on stocks every couple of months or so. Add this one to the pile, as reported by Bloomberg:
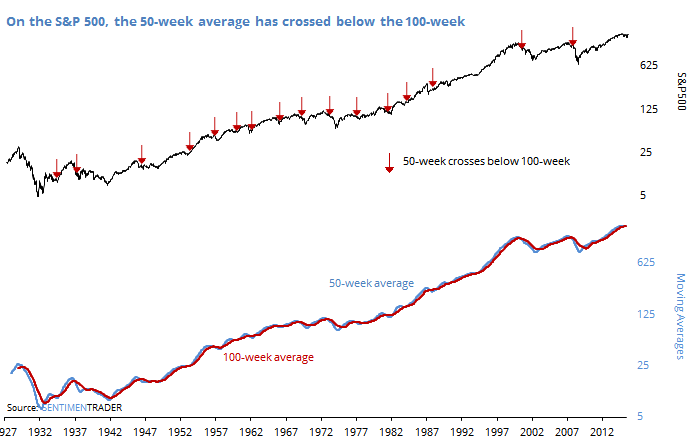
In a note to clients, Intermarket Strategy Ltd. Chief Executive and Strategist Ashraf Laidi points out that the S&P 500's 50-week moving average is falling below its 100-week moving average.This "statistically significant" death cross has only happened twice is the past two decades, Laidi points out. The first took place in 2001 and was followed by a 37 percent decline in the index, while the second pattern occurred in 2008 and preceded a 48 percent drop.
Technically, this signal is not a "death cross", which has its origins in shorter-term moving averages. Regardless, the "statistically significant" claim can easily be tested, so let's do so.
Using S&P 500 data since 1928, the signal has triggered 16 other times, and indeed the last two led to horrid returns in stocks over the next two years.
But there's a reason why proponents of signals like this don't show history prior to 2000 - because it didn't work. Out of the 14 signals prior to 2000, 12 led to a positive return in the S&P over the next two years, and the two losses were both less than 5%.
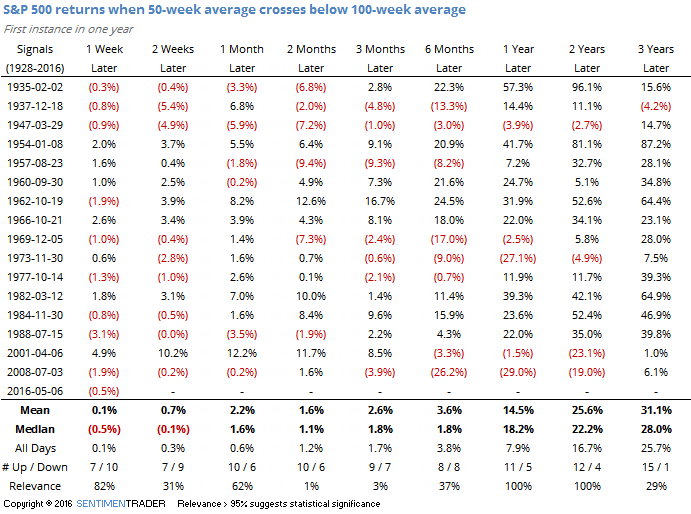
Over a 1-year and 2-year time frame, the S&P's returns were indeed statistically significant, but not in the sense that the article suggests. They were significantly positive.
This is yet another doomsday signal that ranges somewhere between silly and outright misleading. We give it no weight.