The Correlation Between Growth and Value Has Never Been Lower

This is just like the year 2000, and stocks are about to take a tumble.
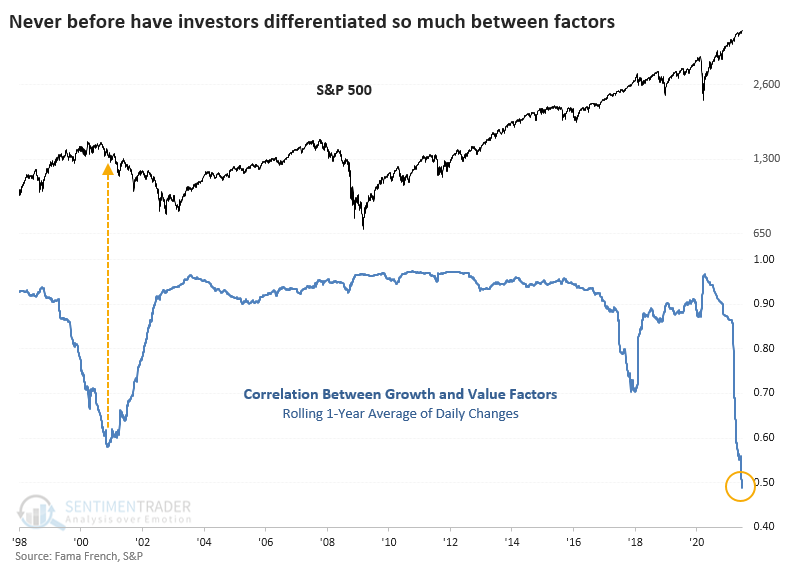
That's the implication from a chart that's being shared around trading desks, relating to the breakdown in correlation between Growth and Value stocks. If we look at a rolling 1-year correlation between daily percentage changes between those two factors, it's now at the lowest point since the pricking of the internet bubble.
In recent weeks, the correlation has plunged, exceeding the prior drop in early 2018. And if we're looking for scare tactics, we can conclude that stocks are about to crash. Full stop.
Theoretically, a bearish argument might make sense. If investors are so complacent about stocks that they don't exit, they just shift their assets from one sector or factor to another, then there really isn't much concern being priced in.
When we go back to 1928 and see if we can find any other periods that might have shown similar behavior, there weren't any. The past year has seen the lowest correlation between Growth and Value in history.
The 2000 scenario is scary, but it's also an outlier. The lowest 1-year correlation, besides the current one, occurred in 1993, before a mild recession and then one of the greatest bull runs in the history of all markets.
What else we're looking at
- The correlation between Growth and Value going back to 1928
- Future returns in the S&P 500 after extremes in this correlation
- What happened to Growth versus Value stocks after low correlations between them
- A look at sector and other factor correlations
- An update to sector, industry, and country ETF relative and absolute trends
- A deep look at a contrarian play in bonds, with options trade potential

| Stat box On Monday, the S&P 500 closed at a record high with fewer than 50% of its member stocks trading above their 50-day moving averages. This is the 2nd time in 3 days this has triggered, one of the starkest internal divergences in the index dating back to 1928. |
Etcetera
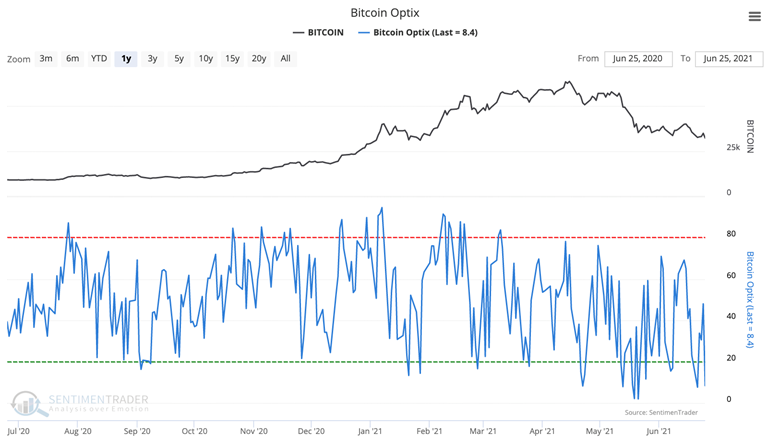
Risky [bit]ness. The Bitcoin Optix hit its fourth lowest point this year, sitting below 9 on the Optix. The three other lows all occurred within the last month.
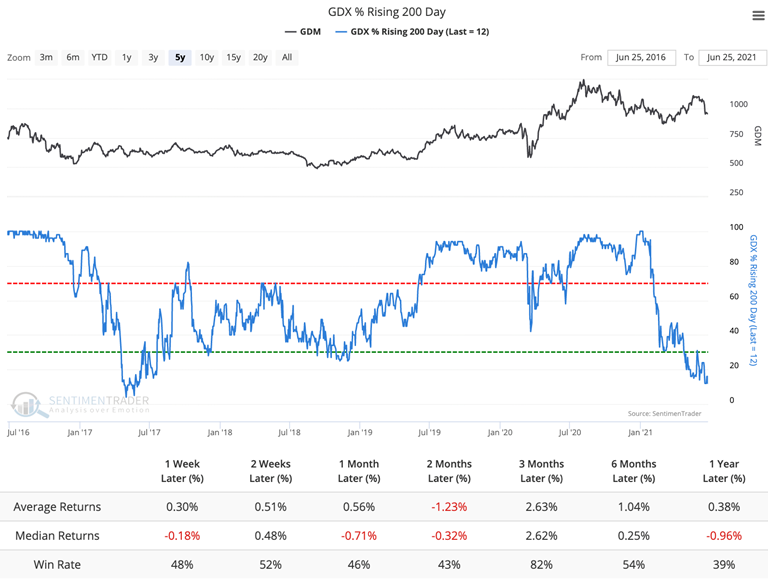
Golden goose. The percentage of gold miners with a rising 200-day moving average has dropped below 15 twice in the past week. This hasn't happened since June of 2017; returns were low when dropping under 15 except for three months later.
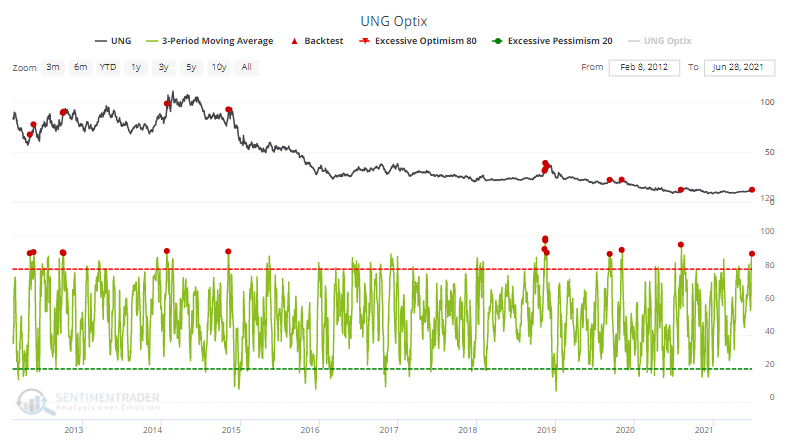
Hot! Natural gas prices can swing wildly in both directions, making it a hard market to trade from either side. Add in leverage, and vehicles like UNG are nearly impossible. And when optimism on the fund gets as high as it is right now, it's been even harder.