
The economy today is just as bad as...
Economic data released in March wasn't all that terrible since most of it was for readings from February. But economic data released in April will be terrible, no doubt. I guarantee you that when this data is released, some in the media/social media will stretch and torture the indicator/charts to show you "the economy today is just as bad as it was during the bottom in 2008/2009!", thereby implying that the worst is over.
*The beauty of economic indicators is that there are so many indicators that one can "support" any narrative they want.
The consensus seems to be that the economy will make a sharp V-shaped recovery. I'm not so sure about that. Many economic indicators are not range-bound the way many sentiment indicators are. Just because "economic indicator XYZ today is as low as it was in March 2009", does not mean that the stock market and economy have bottomed. This is why historical recessions come in all shapes and sizes: they can be as mild as 2001 or as severe as the Great Depression. Moreover, the current recession is so different from historical recessions (the clash between pandemic vs. government action) that using a 2008 or 2001 or 1990 recession playbook doesn't make a lot of sense. These comparisons look pretty on a chart, but I would not trust my own money to them.
Here's an example of a "pretty" comparison:
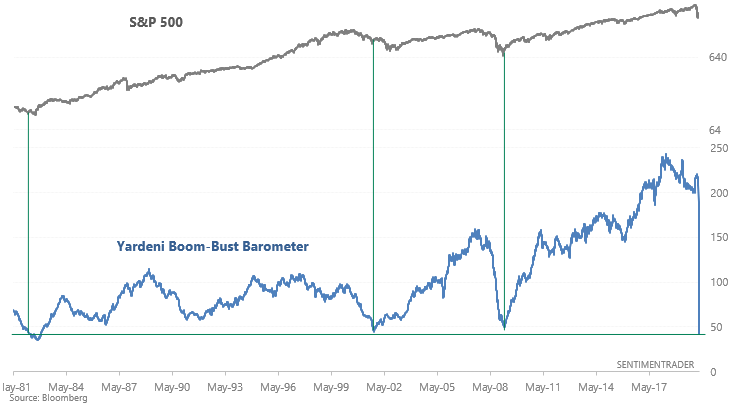
As Zerohedge noted, the Yardeni Boom-Bust Barometer has crashed to the lowest level in years. A hype-y way to support the bullish narrative is to say:
"Yardeni Boom-Bust Barometer is the LOWEST since 1983. The other times Boom-Bust was this low marked *major* medium term or long term bottoms"
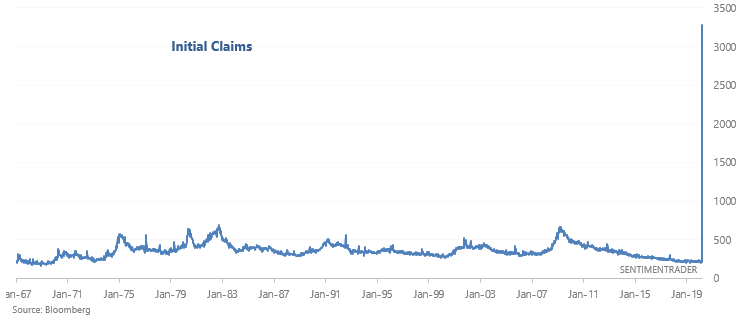
These superficial comparisons aren't really meaningful because they completely ignore context . Why did the Yardeni Boom-Bust Barometer collapse? The Yardeni Boom-Bust Barometer is calculated by dividing the CRB Raw Industrial Price Index by Initial Claims. Initial Claims spiked to the highest level ever, causing this indicator to crash. That's why the "Boom-Bust" barometer collapsed.
In reality, the economy today is nowhere near as bad as it was in 2008/2009. Not yet at least.
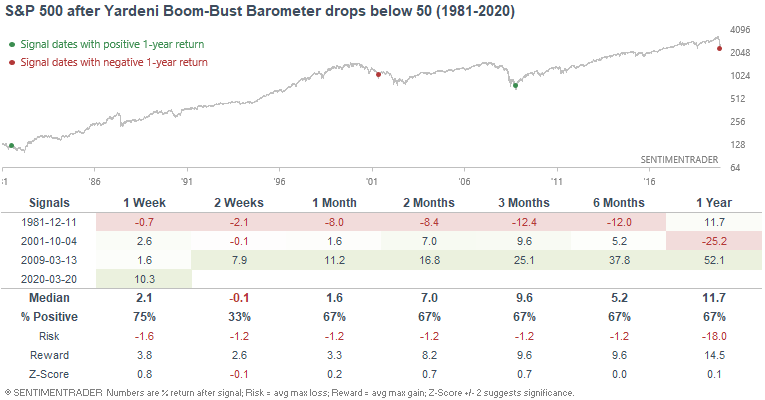
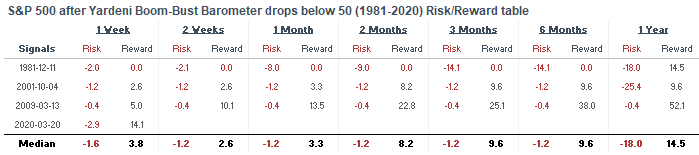
For what it's worth, here's what the S&P 500 did next after the Boom-Bust Barometer was this low:
Here's another example of a seemingly bullish chart.
"Yardeni Global Growth Barometer is as low as it was in late-2008 and early-2016! In both cases the S&P came close to marking a multi-year bottom!":
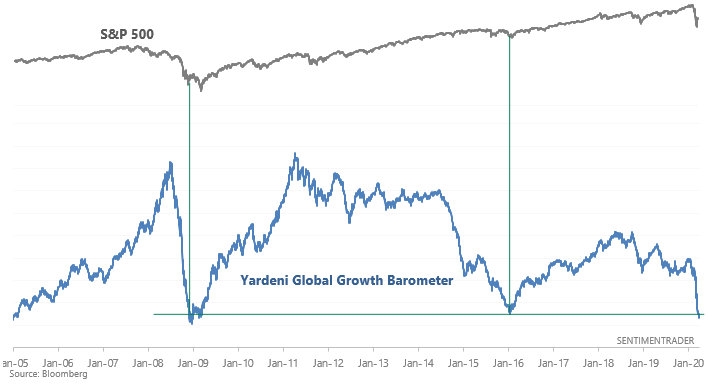
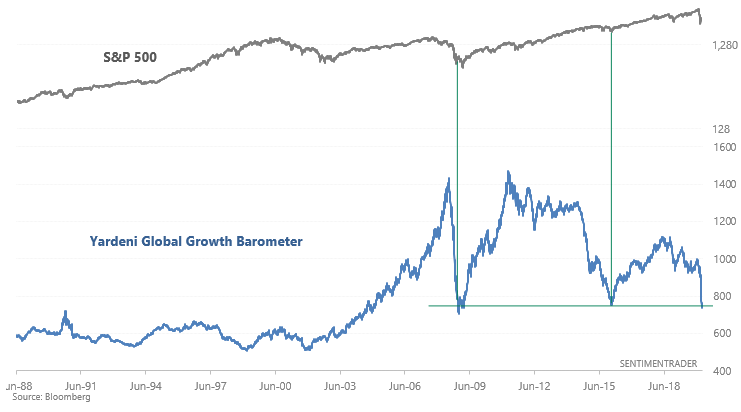
Zooming out on the chart you can see that this data goes back much further than 2005. It can certainly fall much lower since it is not range-bound.
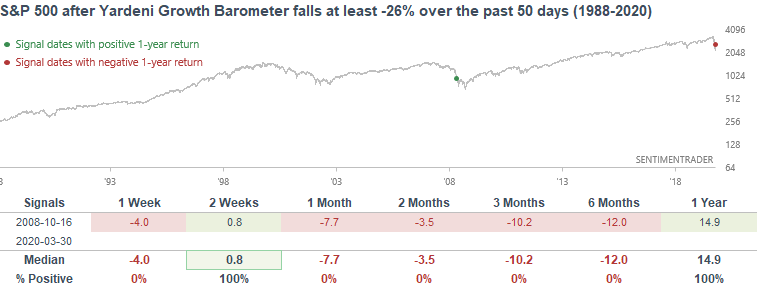
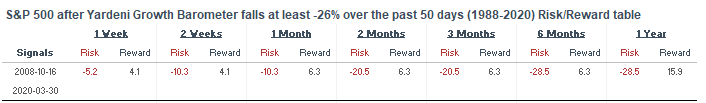
If I want to show you a bearish case, I can show you the Yardeni Global Growth Barometer's 50 day rate of change:
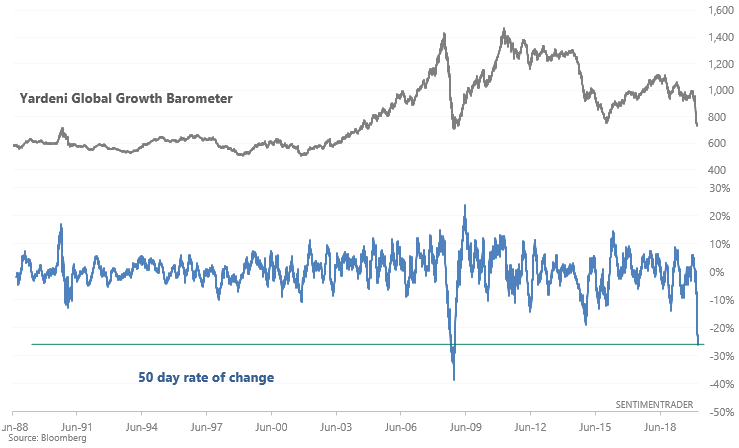
"The only other historical case in which the Yardeni Growth Barometer fell more than -26% over the past 50 days was in October 2008! Back then the S&P fell much more over the next few months before bottoming!"
Bottomline
Economic data released this month will be wild and all over the place. Be careful of hype-y conclusions (e.g. "today is just like the bottom since 2008/2009"). If you take out the context and torture the indicator/chart, you can see whatever narrative you want to believe. I've seen headlines comparing the economic recession today to 1931 (and others to 2008). What were people in 1931 doing? Saying "the recession today is just like the one in 1843?" And were people in 1843 saying "the recession today is just like the one in 1632"? The sample size for recessions is small, and recessions vary significantly from one to another.
Given that the nature of this recession is very different from historical recessions, I would put less weight on economic data and more weight on sentiment/breadth. Take things one step at a time instead of focusing on the next 6-12 months.