Data &
Technology
Research
Reports
Report Solutions
Reports Library
Actionable
Strategies
Free
Resources
Simple Backtest Calculator
Simple Seasonality Calculator
The Kelly Criterion Calculator
Sentiment Geo Map
Public Research Reports
Free Webinar
Pricing
Company
About
Meet Our Team
In the News
Testimonials
Client Success Stories
Contact
Log inLoginSign up
< BACK TO ALL REPORTS

The Nasdaq's internal momentum is trying to recover

Jason Goepfert
2022-02-03
The McClellan Summation Index for the Nasdaq is reversing from a severe oversold reading. Sentiment on the Technology sector is starting to improve.

The Nasdaq McClellan Summation Index is curling up

The Summation Index is based on work pioneered by Sherman and Marian McClellan and is carried on by their son Tom. It is a longer-term look at the momentum of the underlying breadth of the market, adding each day's McClellan Oscillator reading to the day before. Momentum is positive when it is above zero; below zero, it is negative. It also works as an overbought/oversold indicator when it pushes above +500 or below -1000. 

With many overbought/oversold, the catch is that one never really knows how low is low until after the fact. As a result, buying in at the first sign of a slightly oversold condition can result in losses as the market continues to plummet to its ultimate bottom. An alternate approach is waiting for signs of a reversal of an oversold condition before jumping in. That is the approach Jay took for this test.  

The red dots in the chart below highlight those days when the NASDAQ McClellan Summation index crossed back above a reading of -1200. You can run this test in our Backtest Engine. 

Nasdaq McClellan Summation Index is reversing from oversold

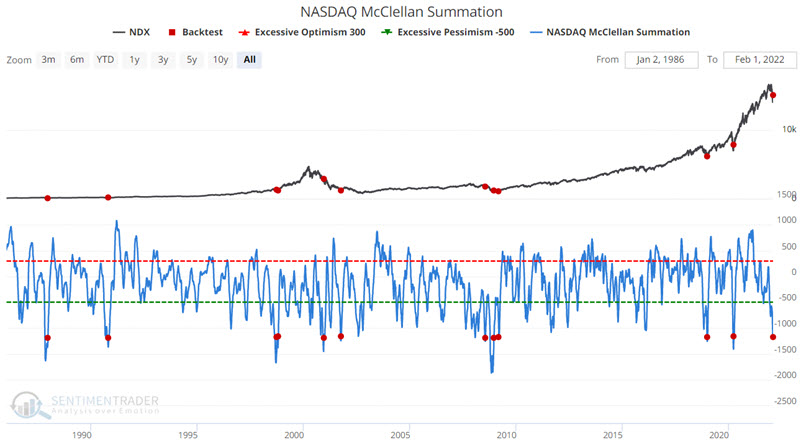
Of particular interest is the performance 1-month after each signal - with an 82% Win Rate.

Stat box

For only the 3rd time in its history, the 5-day average Optimism Index for the UNG Natural Gas fund has surged above 90%. The others were May 2009 and November 2018, per our Backtest Engine.


Technology sentiment is reversing

A trading model that uses our Optimism Index to identify when sentiment reverses from a period of pessimism issued a buy signal for the technology sector at the close of trading on Tuesday. 

Dean's model looks at current sentiment relative to recent history for the XLK ETF. A new buy signal occurs when sentiment crosses back above neutral from extreme pessimism and market momentum is positive.

Technology sentiment is becoming more optimistic

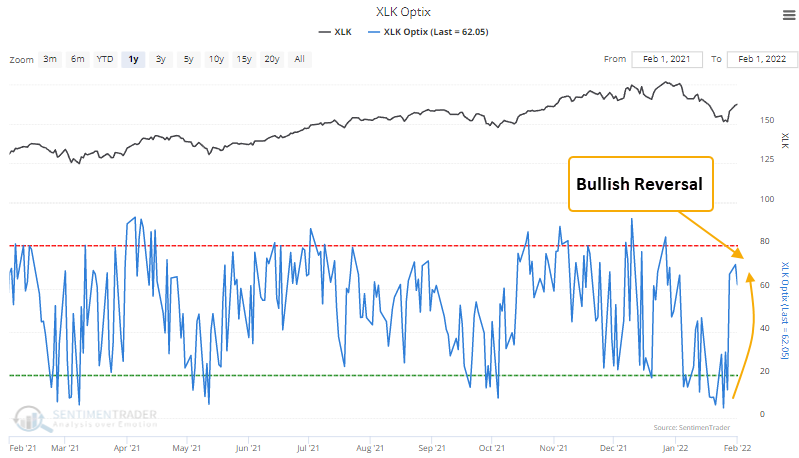
This signal has triggered 63 other times over the past 22 years. After the others, the technology sector's future returns, win rates, and risk/reward profiles were solid across almost all time frames. 

DATA &
TECHnologies
IndicatorEdge
‍
BackTestEdge
‍
Other Tools
‍
DataEdge API
RESEARCH
reports
Research Solution
‍
Reports Library
‍
actionable
Strategies
Trading Strategies
‍
Smart Stock Scanner
‍
FREE
RESOUrCES
Simple Backtest
Calculator
Simple Seasonality
Calculator
The Kelly Criterion
Calculator
Sentiment Geo Map
‍
Public Research Reports
‍
Free Webinar
COMPANY
‍
About
‍
Meet our Team
‍
In the News
‍
Testimonials
‍
Client Success Stories
Pricing
Bundle pricing
‍
Announcements
‍
FAQ
© 2024 Sundial Capital Research Inc. All rights reserved.
Setsail Marketing
TermsPrivacyAffiliate Program
Risk Disclosure: Futures and forex trading contains substantial risk and is not for every investor. An investor could potentially lose all or more than the initial investment. Risk capital is money that can be lost without jeopardizing ones’ financial security or life style. Only risk capital should be used for trading and only those with sufficient risk capital should consider trading. Past performance is not necessarily indicative of future results.

Hypothetical Performance Disclosure: Hypothetical performance results have many inherent limitations, some of which are described below. No representation is being made that any account will or is likely to achieve profits or losses similar to those shown; in fact, there are frequently sharp differences between hypothetical performance results and the actual results subsequently achieved by any particular trading program. One of the limitations of hypothetical performance results is that they are generally prepared with the benefit of hindsight. In addition, hypothetical trading does not involve financial risk, and no hypothetical trading record can completely account for the impact of financial risk of actual trading. for example, the ability to withstand losses or to adhere to a particular trading program in spite of trading losses are material points which can also adversely affect actual trading results. There are numerous other factors related to the markets in general or to the implementation of any specific trading program which cannot be fully accounted for in the preparation of hypothetical performance results and all which can adversely affect trading results.

Testimonial Disclosure: Testimonials appearing on this website may not be representative of other clients or customers and is not a guarantee of future performance or success.