
The Nasdaq's momentum bubble gets pricked

Last week, we looked at other times the Nasdaq Composite formed major peaks. The index tended to go pretty much straight up into the peak then straight down afterward. There wasn't a lot of back-and-forth choppiness.
That's a bit of concern now because that's exactly what the index is doing, and it has set a new 10-day low which ended a couple of its other massive runs.
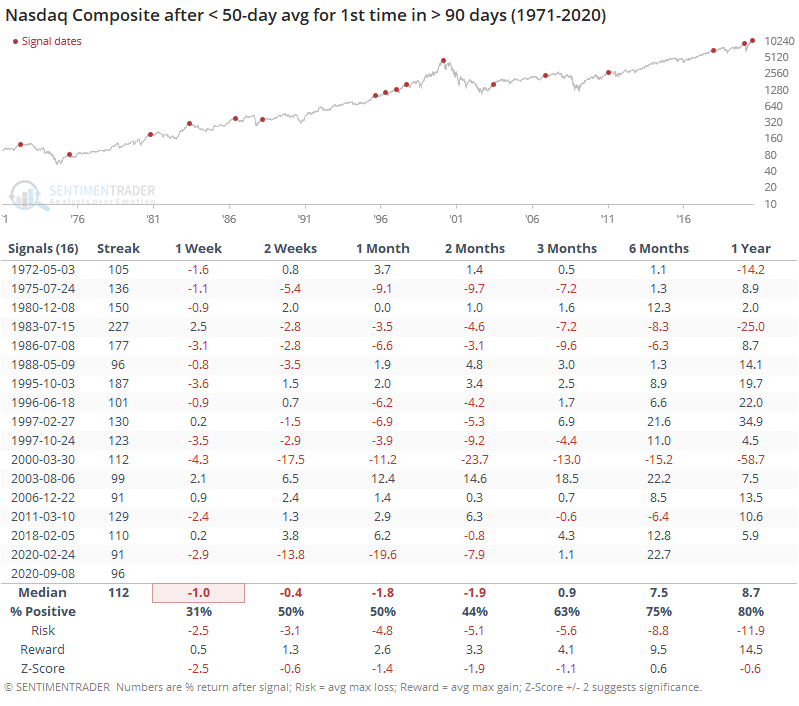
It has also finally dropped below its 50-day moving average for the first time in more than 90 days, ending one of the longer streaks since its 1971 inception.
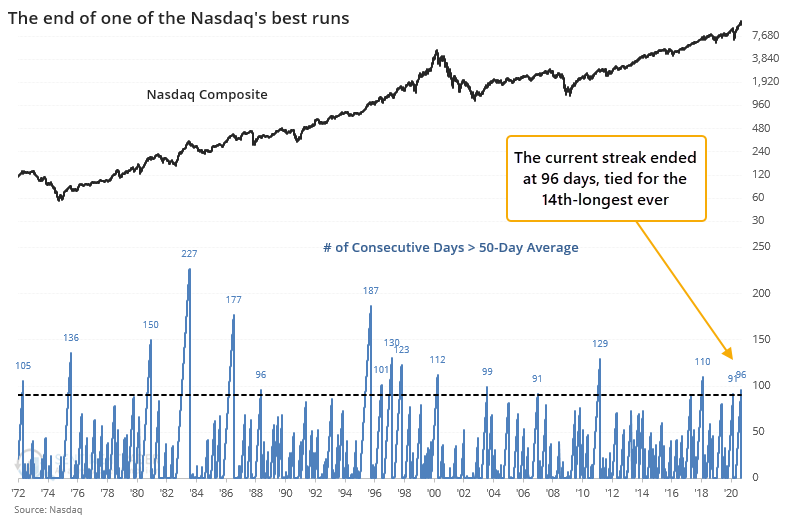
The ends of other long streaks tended to lead to more short-term downside follow-through.
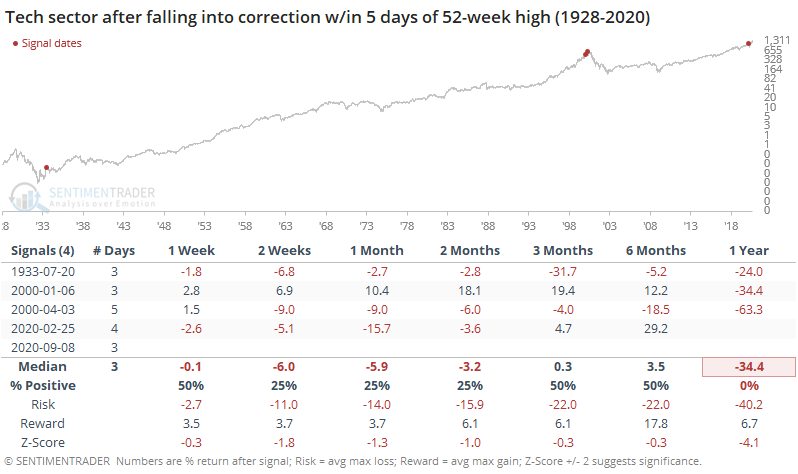
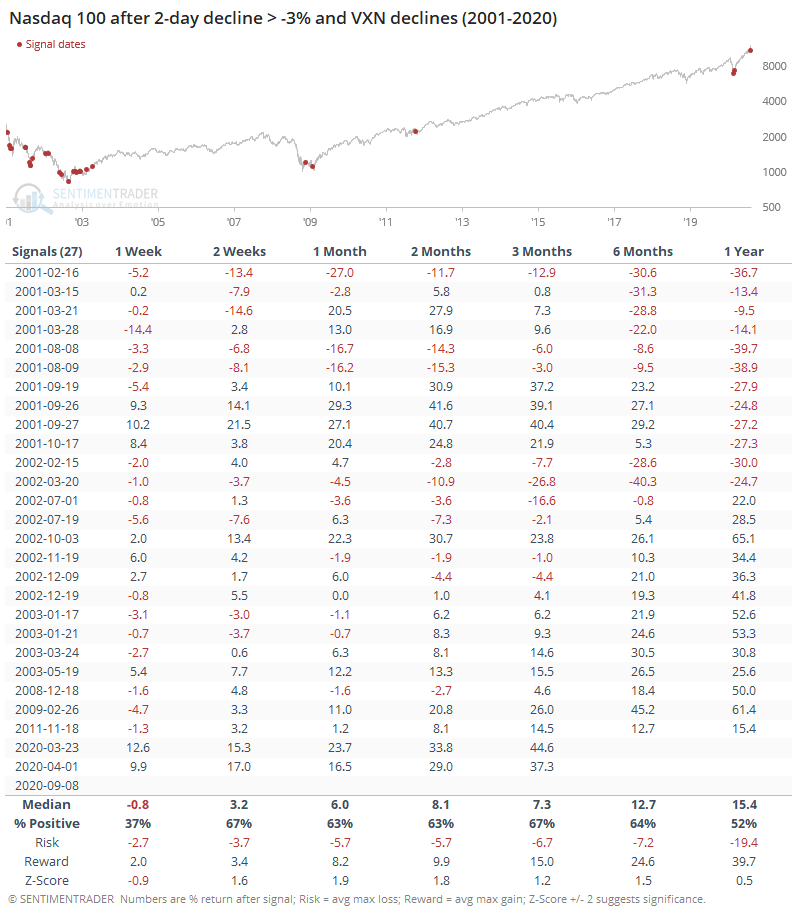
Adding some context, the table below shows what happened when it had reached a multi-year high sometime within the past two weeks.
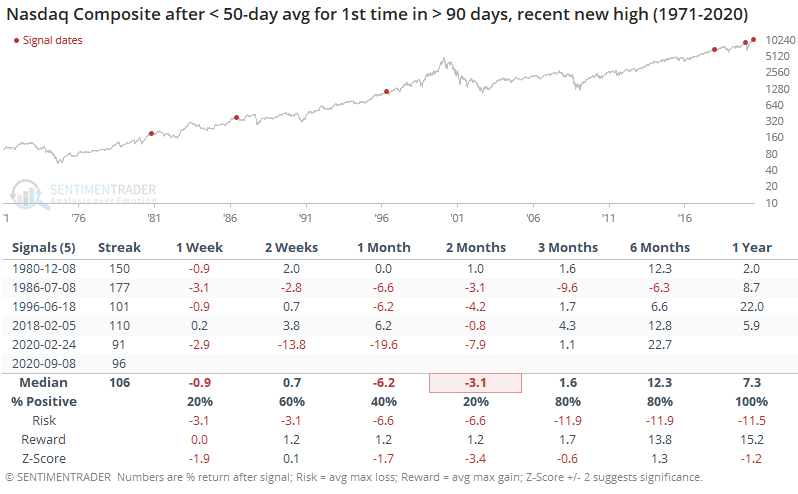
These quick changes in trend tended to persist, though the sample size is painfully small. Over the next 2 months, returns were tepid at best, with high risk relative to reward.
Because of the quick selloff, tech stocks have fallen more than 10% below their 52-week high in only 3 sessions, tied for the fastest-ever correction since 1928.
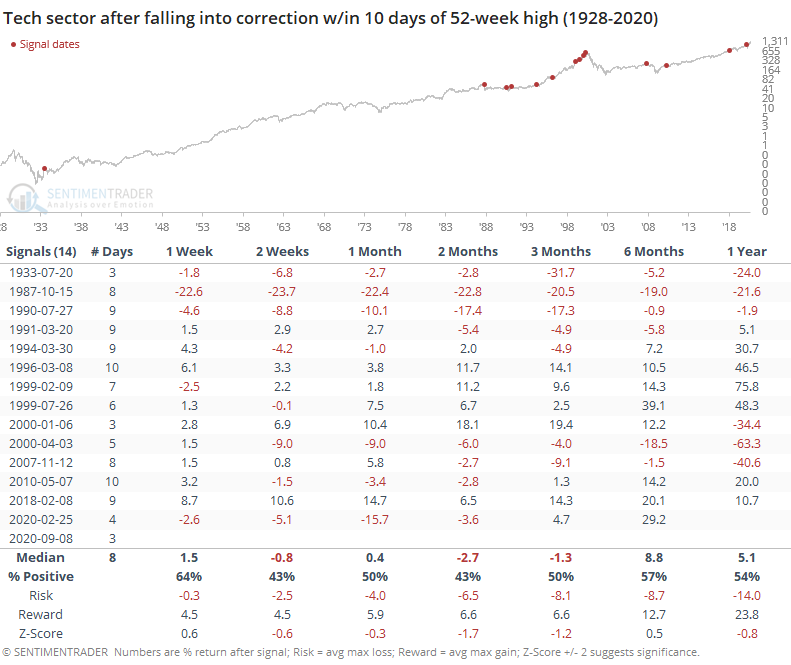
We saw last week that major peaks in the Nasdaq tend to pretty much go straight up, then straight down. So it's not a surprise that the few times the Nasdaq fell into a correction in only a handful of days preceded some of the worst returns.
It's not just the Nasdaq Composite or Nasdaq 100 indexes that fell more than 10% below their highs, most of the underlying stocks have as well. About 73% of Nasdaq 100 stocks dropped more than 10% below their 52-week highs.
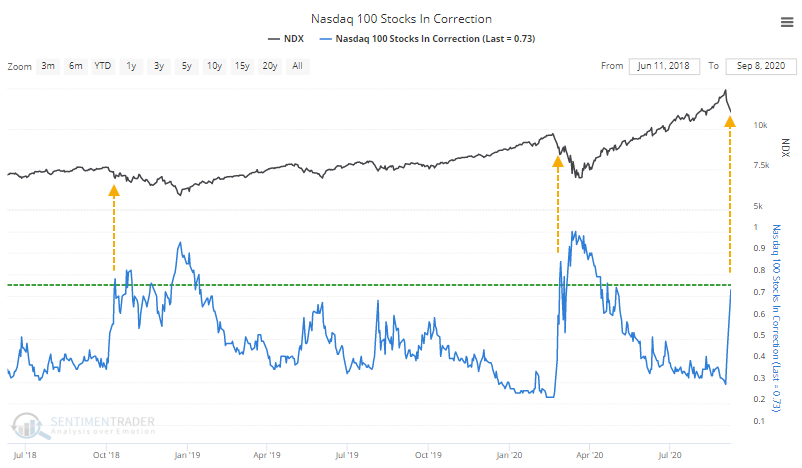
This is about the "oversold" level in healthy markets. Often, this nears the 75% threshold, and then stocks rebound. The problem is when it doesn't - the last two times we saw so many stocks fall into correction territory, it was much closer to the start of a sustained pullback than the end.
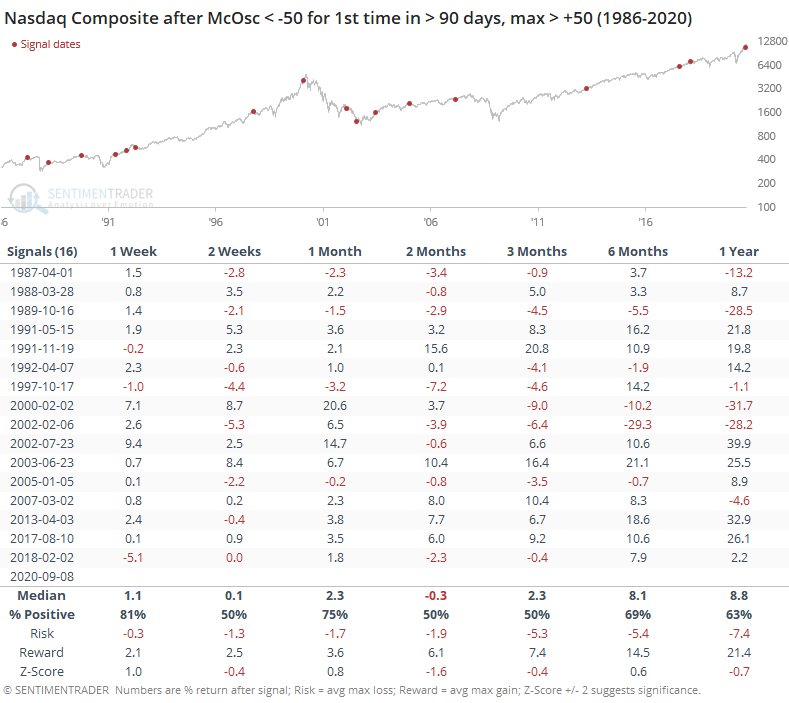
For weeks now, we've been documenting the Nasdaq's oddly negative breadth, even on days when the Composite index soared higher. Now that there have been a few days of heavy selling, the breadth figures are quickly generating oversold readings. The McClellan Oscillator has dropped into oversold territory for the first time since March.
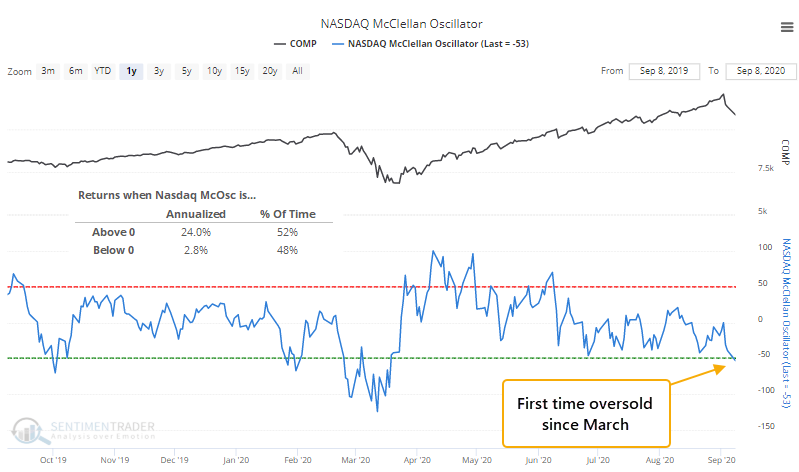
When the Oscillator is above zero, the Nasdaq has returned an annualized +24.0%, compared to only +2.8% when it's below zero. The saving grace could be that breadth has been so bad that it's now stretched too far to the downside. The Backtest Engine shows decent returns when the Oscillator is below -50 during a rising market.
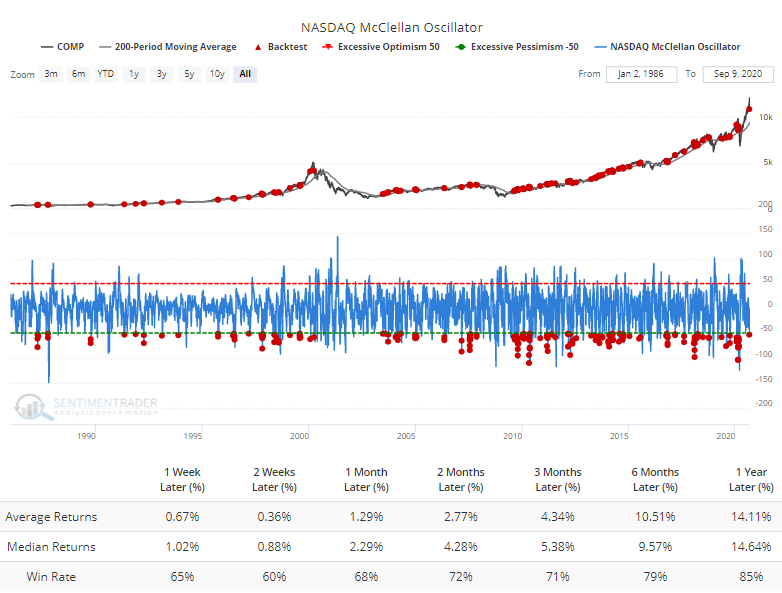
If we investigate that a little further and only look for times when the Oscillator only fell below -50 for the first time in months, after showing impressive positive momentum, then returns were less impressive, especially over the next 2 months.
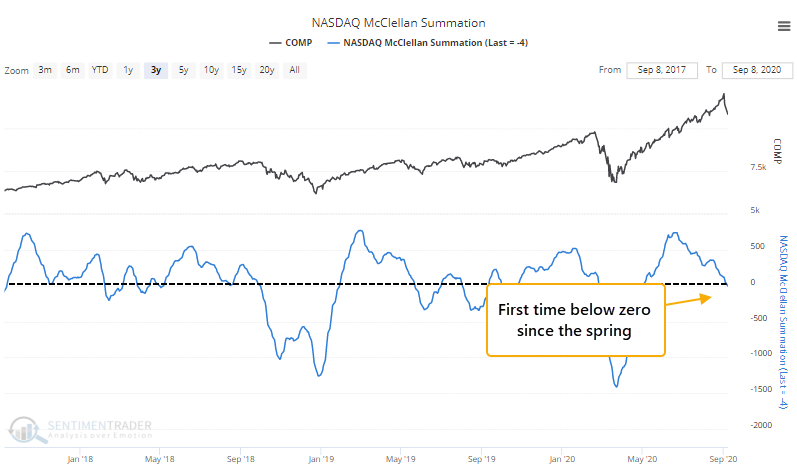
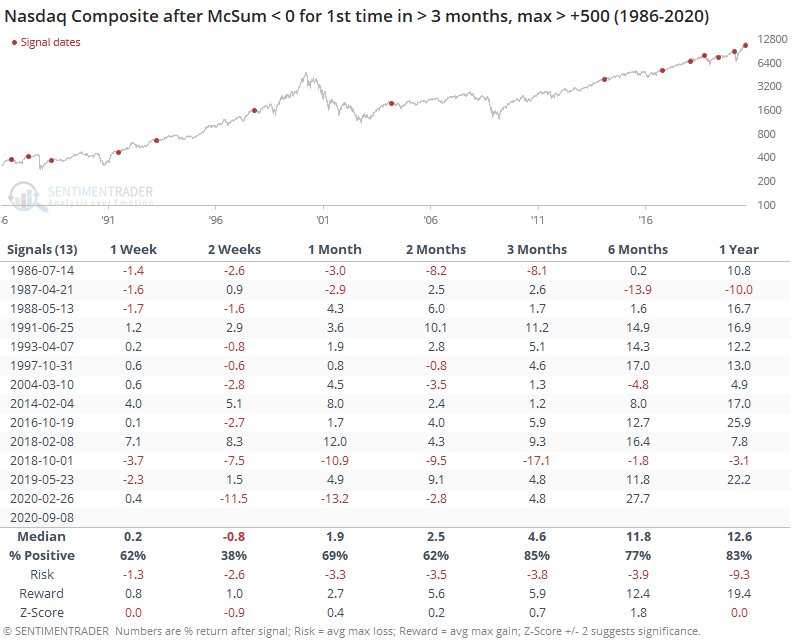
Because the Nasdaq breadth has been waning for a sustained period, the longer-term McClellan Summation Index has also dropped below zero for the first time since the spring.
This kind of waning momentum, following impressive positive readings, also led to some weakness but it tended to be more focused on the shorter-term. Longer-term returns were decent.
Because options traders were scrambling to get exposure to the upside crash in tech stocks, implied volatility on those options was exploding higher as stocks rose, an extremely unusual condition as we noted last week. Now that they've fallen back some, volatility is actually dropping, also an extremely unusual situation.
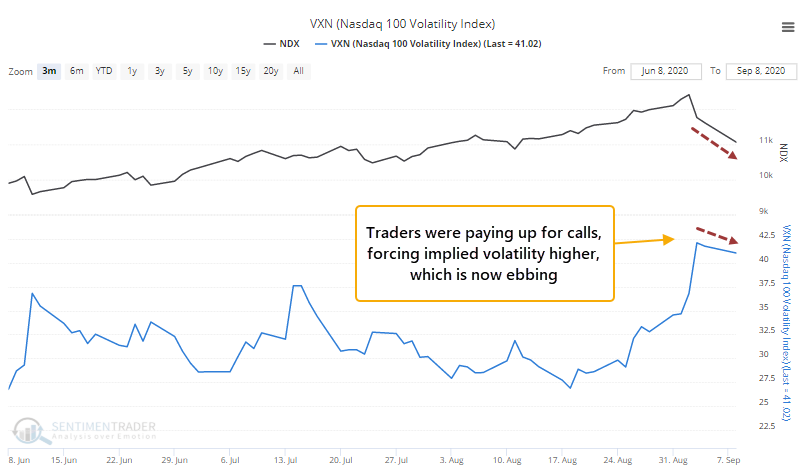
This has usually only happened when options prices were pumped up even more than they are now because traders had panicked during a falling market. It's never happened when volatility was high because of a rally.
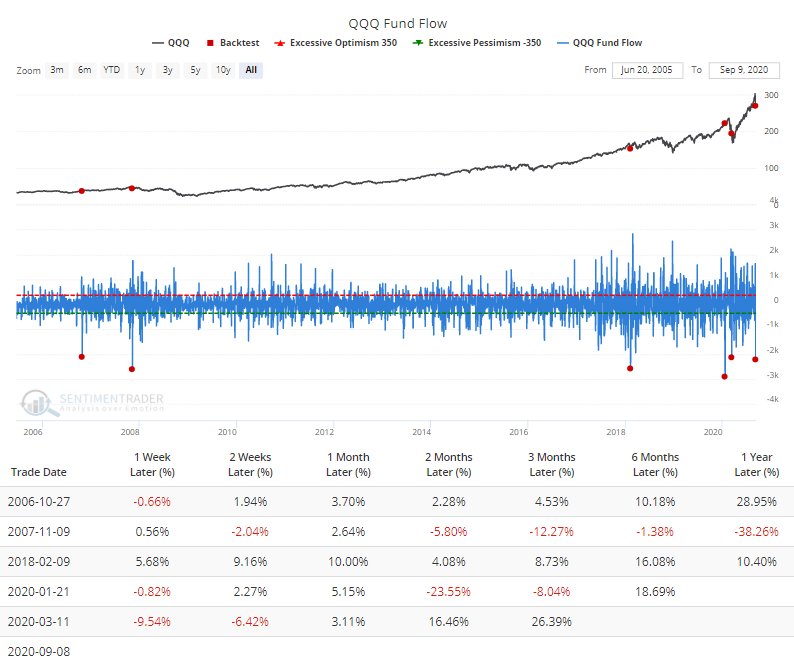
The sudden losses were enough to scare some ETF traders, who pulled more than $2 billion from QQQ in a single day, among the most ever. Fund flows on ETFs are tricky beasts, though, and not always a reliable contrary indicator.
Momentum tends to be sticky. When it ends, it usually doesn't just simply reverse and start up again. We see that with most of the developments above - forward returns up to 2 months later tended to be poor, or at least below average. Longer-term returns were average or a little above. Given the massive amount of speculative fervor built up in recent weeks, this pricking of the Nasdaq's momentum is another worrying sign over the short- to medium-term.