Products
SentimenTrader Trading Tools
‍
Backtest Engine
My Trading Toolkit
Correlation Analysis
Seasonality
Market Prediction
Indicators & Data API
‍
Proprietary Indicators & Charts
Market Data API
Strategies & Scanner
‍
50+ Trading Strategies
Smart Stock Scanner
Smart Option Scanner
Research Reports
‍
Research Solutions
Reports Library
Free Resources
Simple Backtest Calculator
Simple Seasonality Calculator
The Kelly Criterion Calculator
Sentiment Geo Map
Public Research Reports
Education
Sentiment Indicators
Technical Indicators
Pricing
Company
About
In the News
Testimonials
Client Success Stories
Contact
Log inLoginSign up
< BACK TO ALL REPORTS

The Nasdaq's short road back to even is golden

Jason Goepfert
2020-06-04
The Nasdaq Composite has almost fully recovered from its large pandemic decline. It has gone from more than 30% below its 52-week high to within 1.5% of it. Every time it has cycled so far, it has been able to fully retake its previous high, usually within weeks.

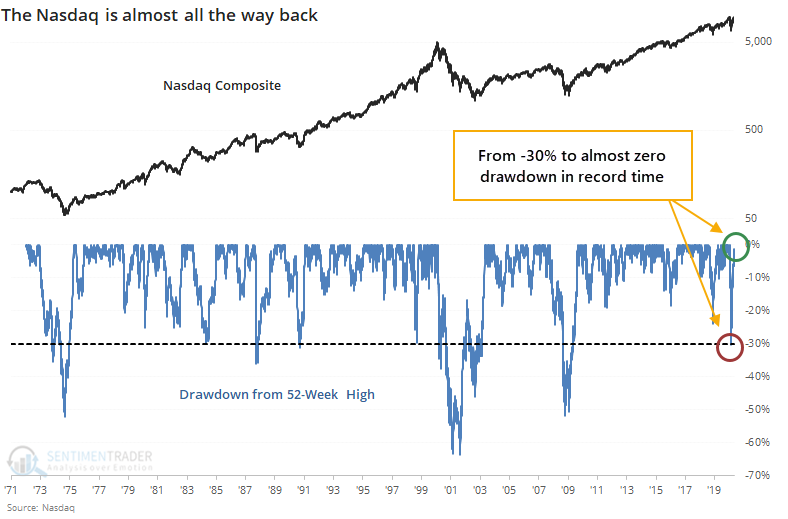
The Nasdaq Composite has almost fully made back all of its losses. After falling more than 30% from its 52-week high, the tech-heavy index has almost retaken that high, pulling within 1.5% by Wednesday. This is, by far, the fastest turnaround in its history.

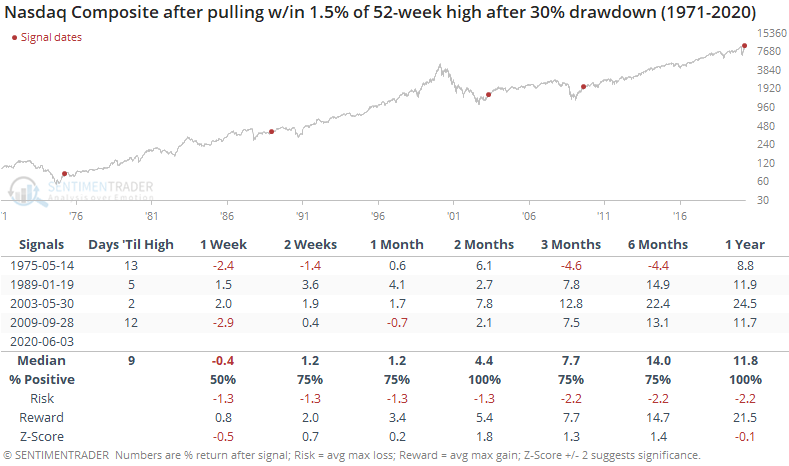
By the time the index cycled from more than 30% below a 52-week high to within 1.5% of it, as it did on Wednesday, it never failed. It closed at a fresh 52-week high within three weeks every time.

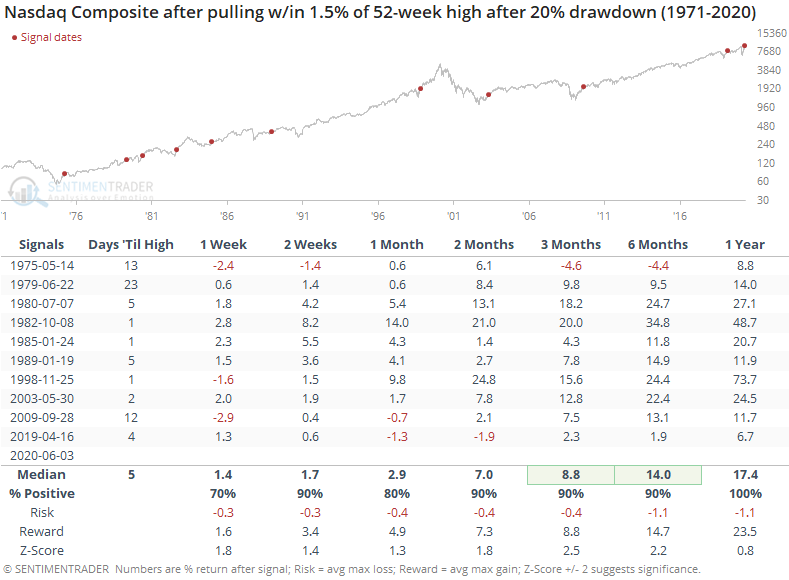
Even when looking at smaller 20% drawdowns, it also never failed, closing at a new high within 23 days every time, and showing gains a year later every time as well.

The risk/reward ratio after these recoveries was impressive across all time frames. While the Nasdaq didn't necessarily keep soaring every day, shorter-term periods of digestion tended to be minor. By the time buyers had reached this point, they were not about to give up.

For the S&P 500, the Nasdaq's recovery was also a good sign.

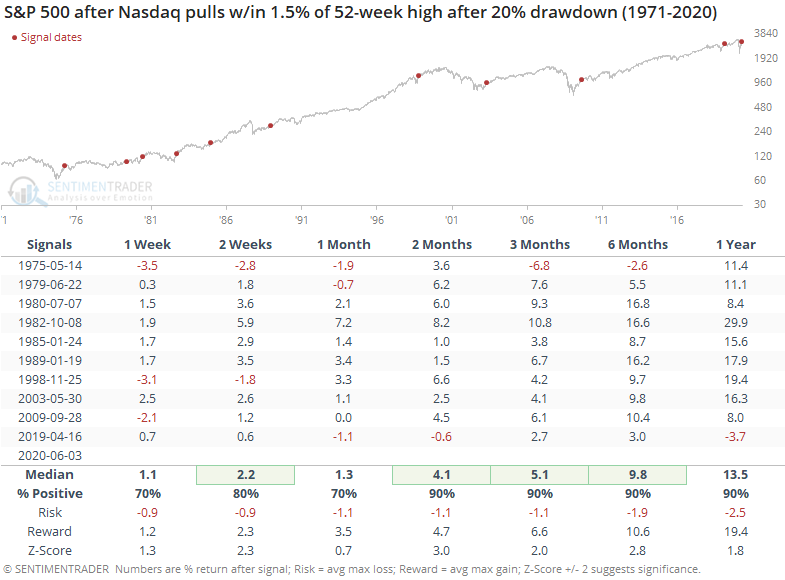
The S&P didn't show as pristine a record as the Nasdaq, but it's forward returns were still excellent. If buyers had enough interest in the higher-risk stocks trading on the Nasdaq, then it was a generally good sign all around.

Like the breadth thrusts and recoveries, signs like this are hard to ignore, especially over medium- to long-term time frames.

The Nasdaq has also enjoyed a "golden cross", a mostly ineffective signal that gets a lot of attention regardless. The curious thing about the current cross, when the 50-day moving average rises above the 200-day average, is that it triggered when the Nasdaq was already so close to an all-time high.

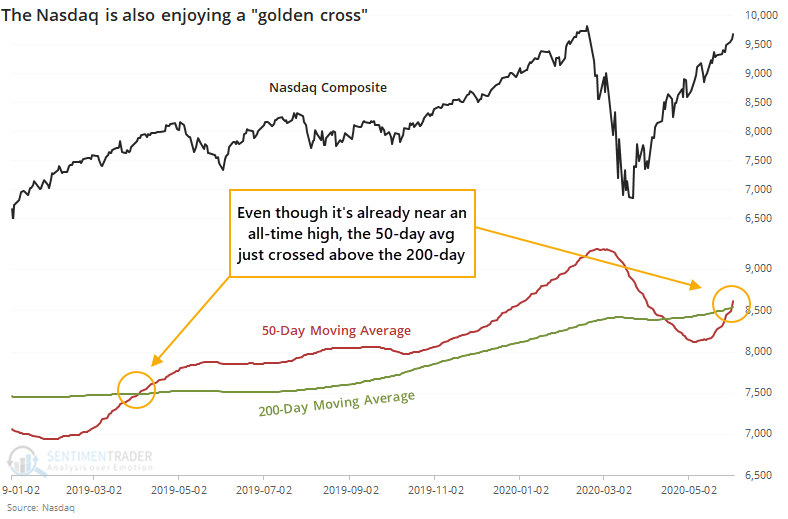
That didn't seem to dampen its forward returns much. It was not a great buy signal, but it was not a consistent reason to sell, either.

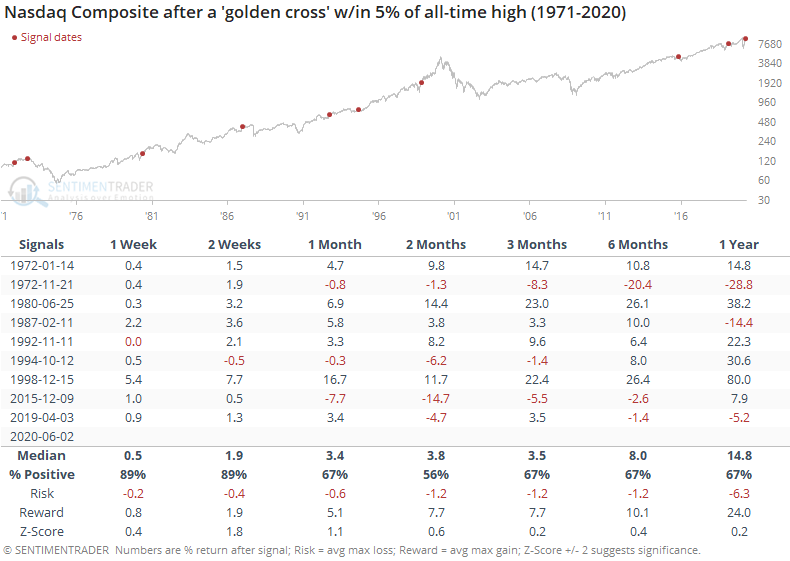
Returns were more consistently positive when the cross happened with the Nasdaq more than 5% below its all-time high, so it would have been more of a buy signal if prices hadn't already run so much. 

PRODUCTS
SentimenTrader
Trading Tools
Indicators & Data API
‍
Strategies & Scanner
‍
Research Reports
FREE
RESOUrCES
Simple Backtest
Calculator
Simple Seasonality
Calculator
The Kelly Criterion
Calculator
Sentiment Geo Map
‍
Public Research Reports
‍
Education
Sentiment Indicators
‍
Technical Indicators
‍
Pricing
Bundle pricing
‍
FAQ
‍
Announcements
‍
COMPANY
‍
About
‍
In the News
‍
Testimonials
‍
Client Success Stories
CONTACT
‍
General Inquiries
‍
Media Inquiries
‍
Financial Professionals Inquiries
‍
© 2026 Sundial Capital Research Inc. All rights reserved.
Setsail Marketing
TermsPrivacyAffiliate Program
Risk Disclosure: The information and tools provided are for research and analytical purposes only and are not intended as investment advice. Market analysis involves uncertainty, and outcomes may differ from expectations. Users should conduct their own due diligence and consider their individual circumstances before making any financial decisions. Past performance is not necessarily indicative of future results.

Hypothetical Performance Disclosure: Hypothetical performance results have many inherent limitations, some of which are described below. No representation is being made that any account will or is likely to achieve profits or losses similar to those shown; in fact, there are frequently sharp differences between hypothetical performance results and the actual results subsequently achieved by any particular trading program. One of the limitations of hypothetical performance results is that they are generally prepared with the benefit of hindsight. In addition, hypothetical trading does not involve financial risk, and no hypothetical trading record can completely account for the impact of financial risk of actual trading. for example, the ability to withstand losses or to adhere to a particular trading program in spite of trading losses are material points which can also adversely affect actual trading results. There are numerous other factors related to the markets in general or to the implementation of any specific trading program which cannot be fully accounted for in the preparation of hypothetical performance results and all which can adversely affect trading results.

Testimonial Disclosure: Testimonials appearing on this website may not be representative of other clients or customers and is not a guarantee of future performance or success.