
The NYSE advance decline line suggests caution

Key points:
- NYSE declining issues are outnumbering advancing issues
- At the same time, the S&P 500 recorded a new multi-year high, creating a market divergence
- Similar conditions preceded slightly negative to flat returns from 1-12 weeks later
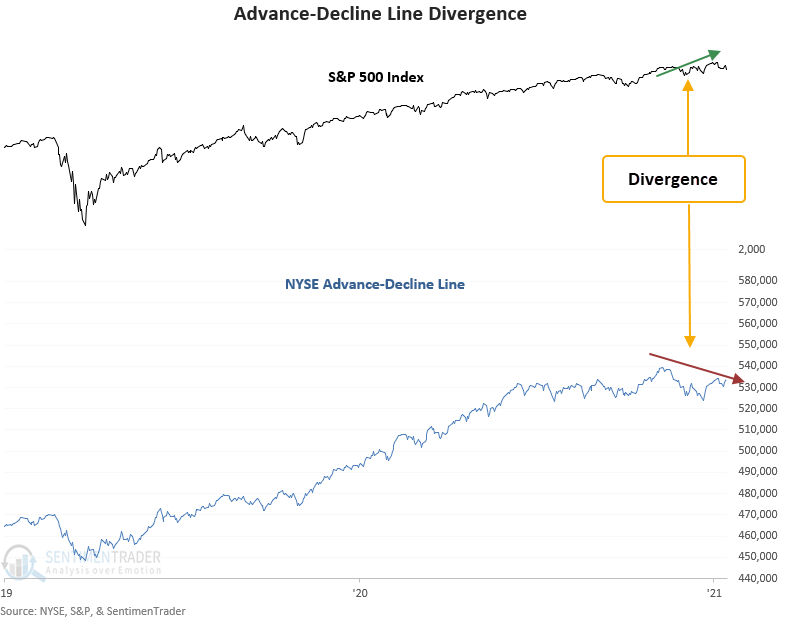
Declining issues are outnumbering advancing issues, triggering a new risk-off signal
A new signal from a voting member in the TCTM Risk Warning Model registered an alert on Thursday. The component is called the Advance-Decline Line Divergence Model.
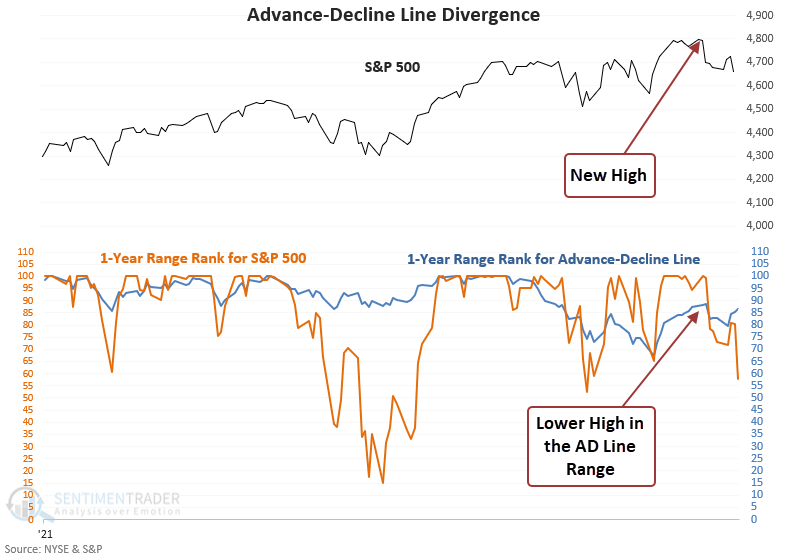
The model identifies the following:
1.) The 1-year range rank for the NYSE advance-decline line is below 89.75%
2.) The S&P 500 records a new 2-year high
3.) The advance-decline line has not registered a new high in 30 days or longer.
Once those conditions are confirmed, an alert is triggered when the S&P 500 closes at a 3-week low.
The advance-decline line is a classic market breadth indicator
When the advance-decline line indicator registers a series of lower lows, and an index records a new high, something is amiss with market participation. The shot across the bow is a warning that we should be alert to rising risks. As always, it's essential to use a weight-of-the-evidence approach and not rely upon any single indicator.
The AD line model utilizes a range rank to identify the divergence
The previous advance-decline line alert was triggered in October 2007, eight days after the peak in the S&P 500.
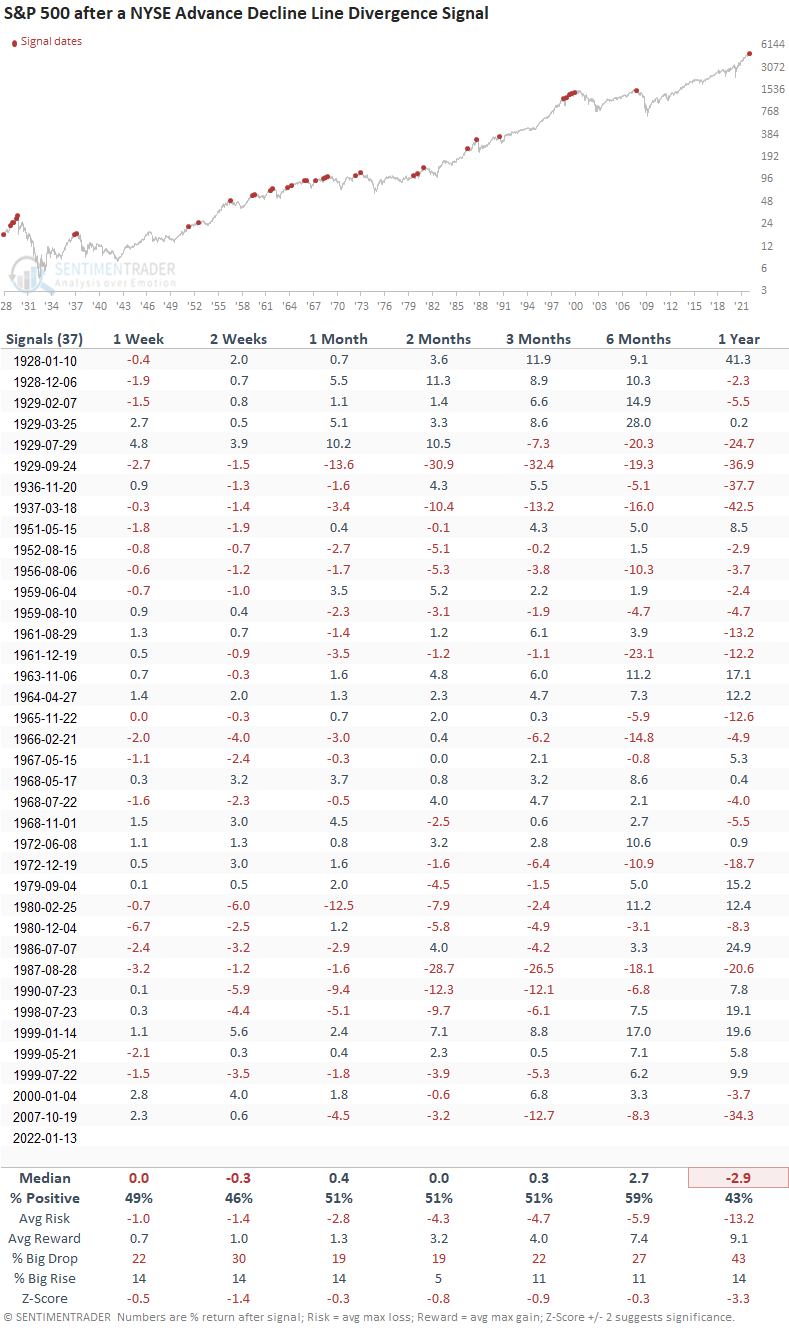
Similar signals preceded slightly weak to flat returns
This signal triggered 37 other times over the past 94 years. After the others, S&P 500 future returns and win rates were slightly weak to flat on a short and medium-term time frame. The 1-year results, while negative, are influenced by whether a signal occurred around a bear market peak. Historically, the AD line can be early. For instance, four alerts occurred between January 1999 and January 2000, which led to consolidations and corrections, but not the ultimate Dotcom peak.
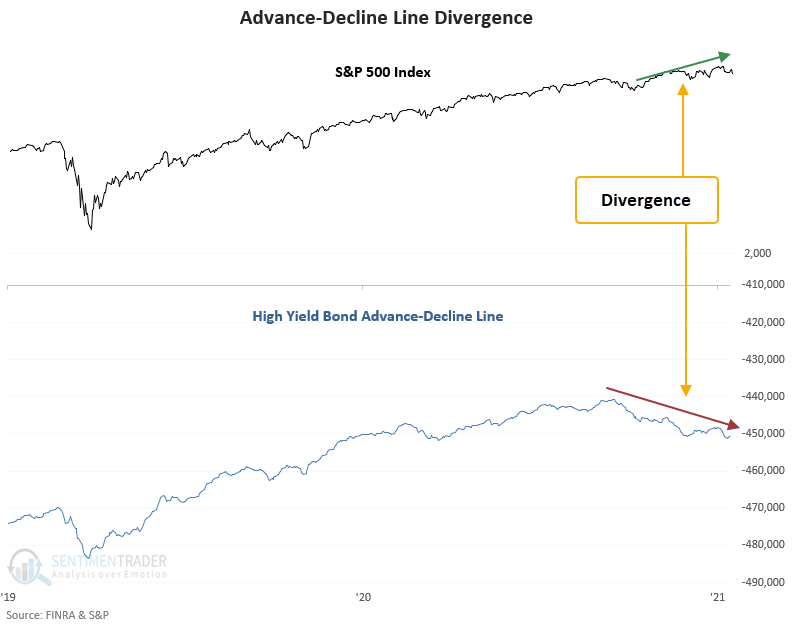
The same concept also triggered a signal for high-yield bonds on Thursday
We monitor high yield bond data closely as it can provide an early warning of potential trouble in the credit markets. So, the critical question we need to be asking is the following. Does a signal from NYSE data, which contains bond constituents, and high yield bonds, represent an adjustment to higher interest rates or a credit problem? Interest rate adjustments are typically associated with consolidations, whereas credit problems usually lead to significant corrections and bear markets. I suspect the former is what is causing the current equity market consolidation.
What the research tells us...
When the AD line trends lower as the S&P 500 records a new high, something is amiss with market participation, suggesting rising risks. Similar setups to what we're seeing now have preceded slightly weak to flat returns on a short and medium-term basis. As it appears now, the stock market is adjusting to higher interest rates, leading to more volatility and a sideways market.