Products
SentimenTrader Trading Tools
‍
Backtest Engine
My Trading Toolkit
Correlation Analysis
Seasonality
Indicators & Data API
‍
Proprietary Indicators & Charts
Market Data API
Strategies & Scanner
‍
50+ Trading Strategies
Smart Stock Scanner
Research Reports
‍
Research Solutions
Reports Library
Free Resources
Simple Backtest Calculator
Simple Seasonality Calculator
The Kelly Criterion Calculator
Sentiment Geo Map
Public Research Reports
Pricing
Company
About
In the News
Testimonials
Client Success Stories
Contact
Log inLoginSign up
< BACK TO ALL REPORTS

The only weakness in junk is that there is no weakness

Jason Goepfert
2021-02-23
In the high-yield (junk) bond market, bonds reaching 52-week highs continue to overwhelm those falling to 52-week lows. This indicates good health. About the only issue is that things have been so positive for so long, it equals past extremes when those bonds, and stocks, took a breather.

Given the paroxysm of speculative activity over the past 1-2 months, we've been keeping an eye on some other markets that have had a decent tendency to provide a heads-up that risk appetite was starting to wane.

One of those is the high-yield bond market. Watching for deterioration there gives us a sense as to whether bond investors are starting to price in more defaults, which can often happen before stock investors take notice.

So far, there isn't much evidence of that. Fund flows in HYG have been quite negative (but not as negative as investment-grade funds like LQD or Treasury funds like TLT). But that hasn't had much of an impact on the internal health of that market.

One of the primary gauges for that is the net percentage of high-yield bonds that are hitting 52-week highs minus those falling to 52-week lows. If it's positive, then it's a good sign for both high-yield bonds and the stock market.

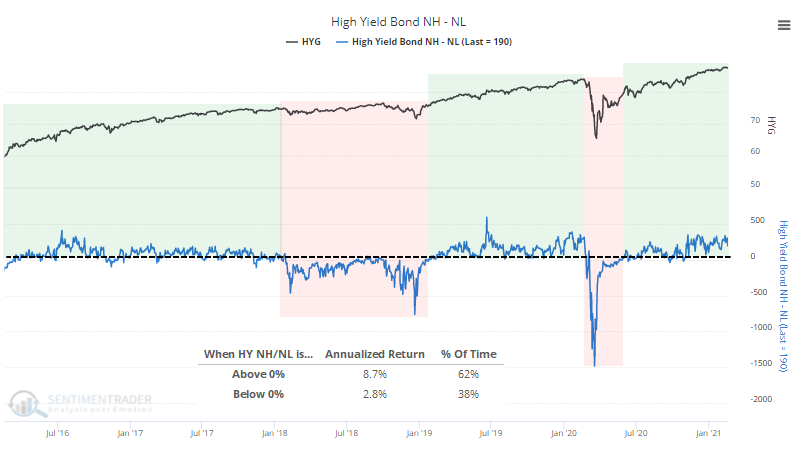
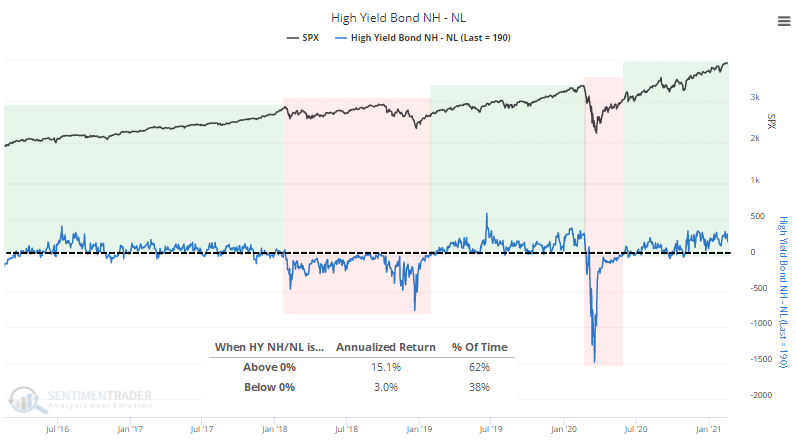
The S&P 500 has held up well when this is positive. The difference in its annualized return is stark depending on whether there are more junk bonds hitting new highs or new lows. The fact that this is still well above zero indicates a healthy junk-bond market, or at least one that buyers are still supporting, and that has indicated good forward returns.

The biggest caveat is simply that things have been so positive for so long.

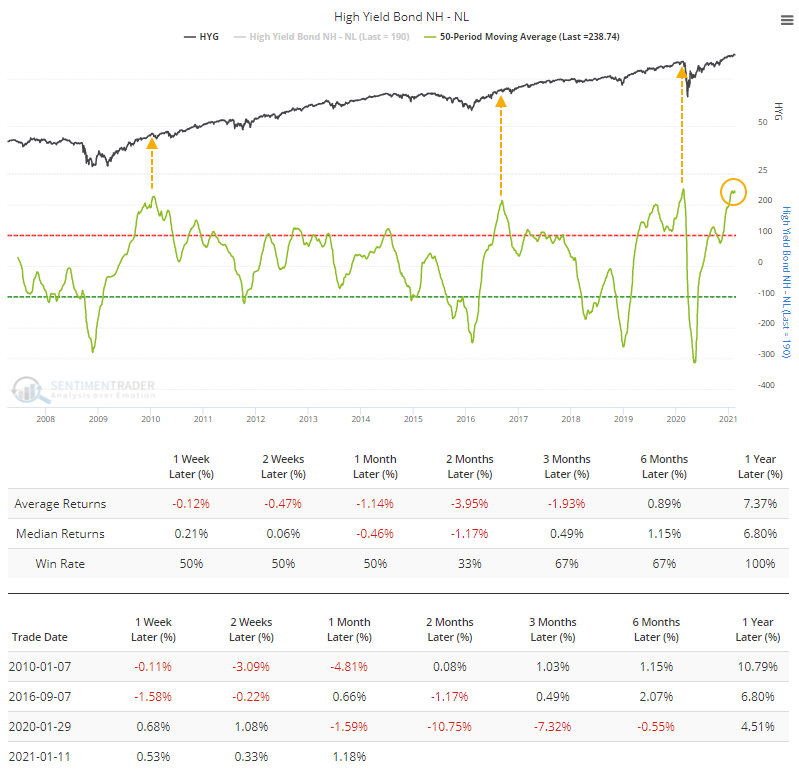
The 50-day average of net new highs is now the highest in at least 14 years. Other times it first reached a very high level, HYG struggled over the next couple of months according to the Backtest Engine. It first became extreme a little over a month ago, so it has been defying gravity since then. It has been a challenge for it to levitate much longer.

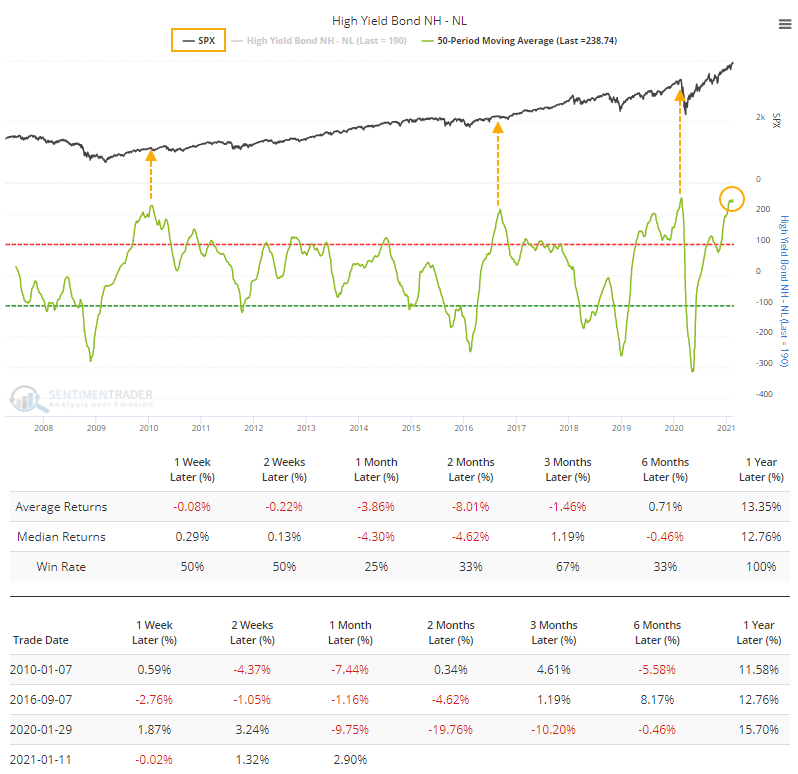
It was the same suggestion for the S&P 500. The Backtest Engine shows losses across most time frames.

Each of those times, while forward gains were limited, by the time that losses in bonds (and stocks) were enough to push the net percentage of bonds much below the zero line, the bulk of the selling pressure was nearly done, at least time-wise. Last year, of course, the losses were deep but it's relatively safe to say that was an unusual circumstance.

Like a lot of what we've been looking at, this suggests that things have been so good for so long, that it's unlikely to lead to large, sustained gains from here. But the momentum has been so strong that if we do see some multi-week or multi-month selling, buyers won't go away easily.

Sorry, you don't have access to this report

Upgrade your subscription plan to get access
Go to Dasboard
PRODUCTS
SentimenTrader
Trading Tools
Indicators & Data API
‍
Strategies & Scanner
‍
Research Reports
FREE
RESOUrCES
Simple Backtest
Calculator
Simple Seasonality
Calculator
The Kelly Criterion
Calculator
Sentiment Geo Map
‍
Public Research Reports
‍
Pricing
Bundle pricing
‍
Announcements
‍
FAQ
COMPANY
‍
About
‍
In the News
‍
Testimonials
‍
Client Success Stories
CONTACT
‍
General Inquiries
‍
Media Inquiries
‍
Financial Professionals Inquiries
‍
© 2025 Sundial Capital Research Inc. All rights reserved.
Setsail Marketing
TermsPrivacyAffiliate Program
Risk Disclosure: Futures and forex trading contains substantial risk and is not for every investor. An investor could potentially lose all or more than the initial investment. Risk capital is money that can be lost without jeopardizing ones’ financial security or life style. Only risk capital should be used for trading and only those with sufficient risk capital should consider trading. Past performance is not necessarily indicative of future results.

Hypothetical Performance Disclosure: Hypothetical performance results have many inherent limitations, some of which are described below. No representation is being made that any account will or is likely to achieve profits or losses similar to those shown; in fact, there are frequently sharp differences between hypothetical performance results and the actual results subsequently achieved by any particular trading program. One of the limitations of hypothetical performance results is that they are generally prepared with the benefit of hindsight. In addition, hypothetical trading does not involve financial risk, and no hypothetical trading record can completely account for the impact of financial risk of actual trading. for example, the ability to withstand losses or to adhere to a particular trading program in spite of trading losses are material points which can also adversely affect actual trading results. There are numerous other factors related to the markets in general or to the implementation of any specific trading program which cannot be fully accounted for in the preparation of hypothetical performance results and all which can adversely affect trading results.

Testimonial Disclosure: Testimonials appearing on this website may not be representative of other clients or customers and is not a guarantee of future performance or success.