Products
SentimenTrader Trading Tools
‍
Backtest Engine
My Trading Toolkit
Correlation Analysis
Seasonality
Indicators & Data API
‍
Proprietary Indicators & Charts
Market Data API
Strategies & Scanner
‍
50+ Trading Strategies
Smart Stock Scanner
Research Reports
‍
Research Solutions
Reports Library
Free Resources
Simple Backtest Calculator
Simple Seasonality Calculator
The Kelly Criterion Calculator
Sentiment Geo Map
Public Research Reports
Pricing
Company
About
In the News
Testimonials
Client Success Stories
Contact
Log inLoginSign up
< BACK TO ALL REPORTS

The past 3 months' "everything rally"

Jason Goepfert
2020-07-28
Over the past 3 months, stocks, bonds, commodities, and gold have all rallied strongly. This is unusual due to shifting correlations over the years. When other widespread buying spurts got this extreme, all the assets typically settled back over the ensuing months.

It's been a monster few months for stocks and just about every other financial asset.

As the WSJ noted, this is one of the few times in history when it seems like everything is rallying, and rallying hard. Stocks, bonds, commodities, and gold have all rallied strongly over the past three months, even though their historical relationships are not often positively correlated.

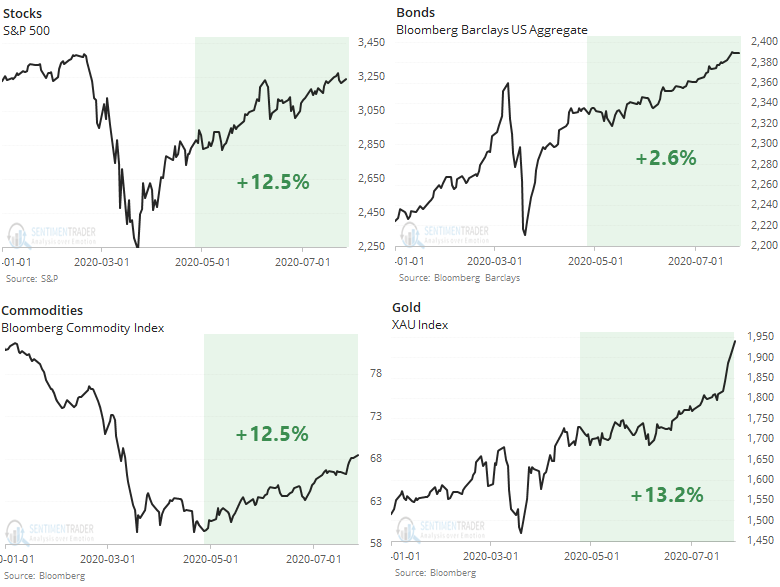
Every one of the assets has rallied over a 3-month span, and their median return is a whopping 12%. That ranks among the highest in nearly 45 years.

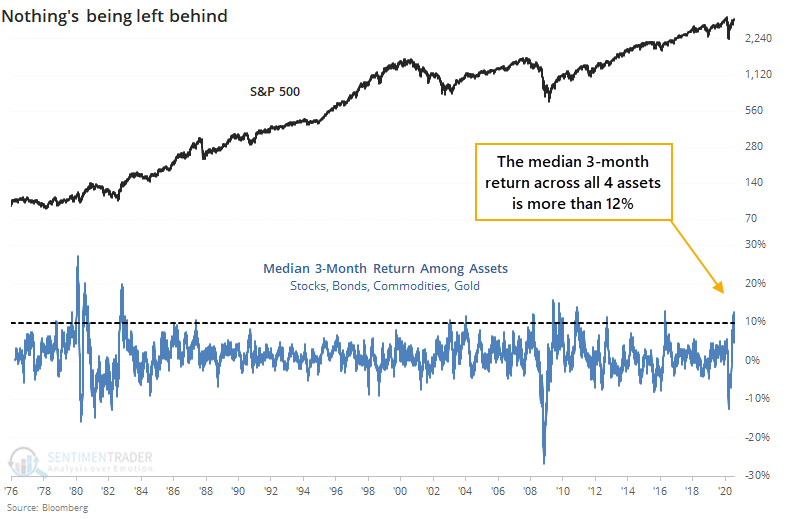
When this happens, it is typically touted as a sign that "something" structural is driving all assets higher (usually the Federal Reserve, for better or worse). Opinions always vary widely whether this kind of activity is sustainable.

At the risk of relying on historical precedents during an unprecedented time, for stocks, this kind of behavior was a medium-term issue, but longer-term positive.

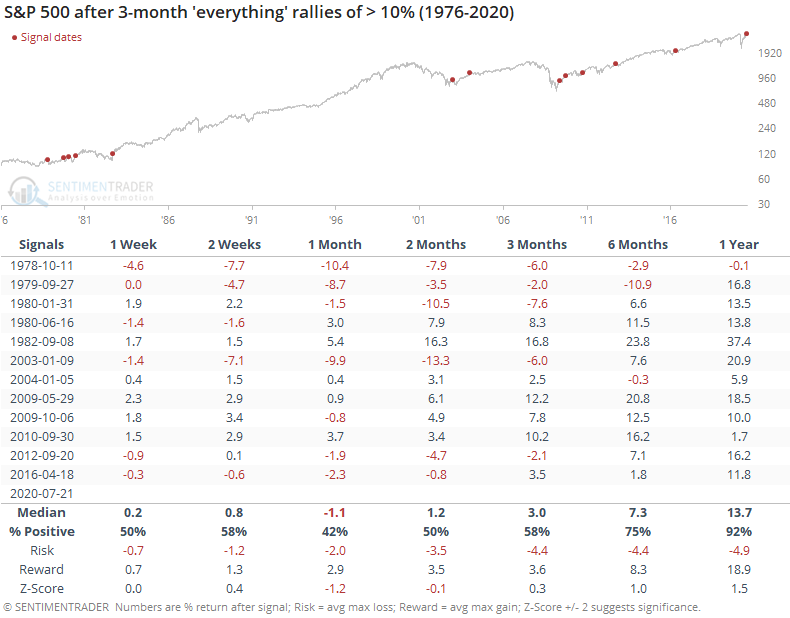
Over the following 1-2 months, the S&P tended to decline or tread water, with a couple of breakout gains at the starts of major bull markets like 1982 and 2009. Otherwise, investors took a slight breather, and the risk/reward was negative up to three months later.

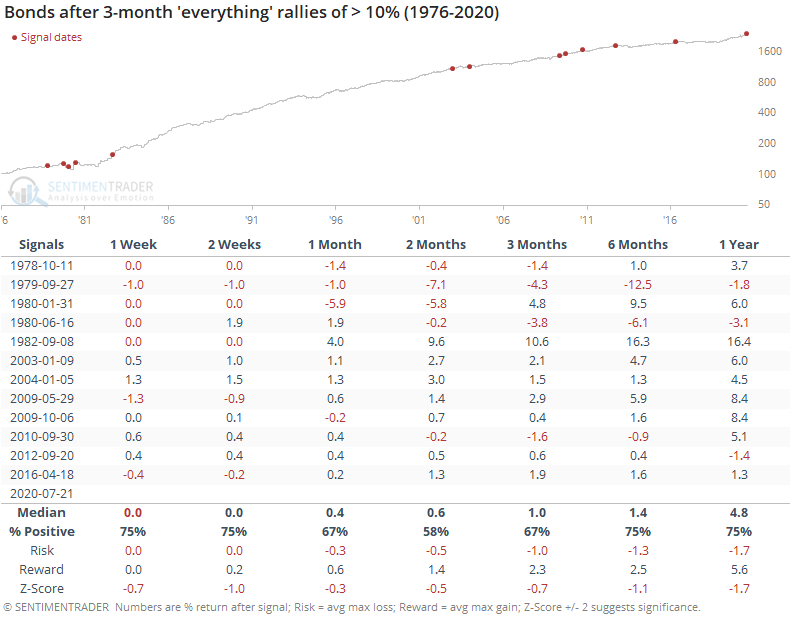
Bonds struggled during the early precedents but the unrelenting bull market since then led to positive returns (note that this is total return and not just price gains).

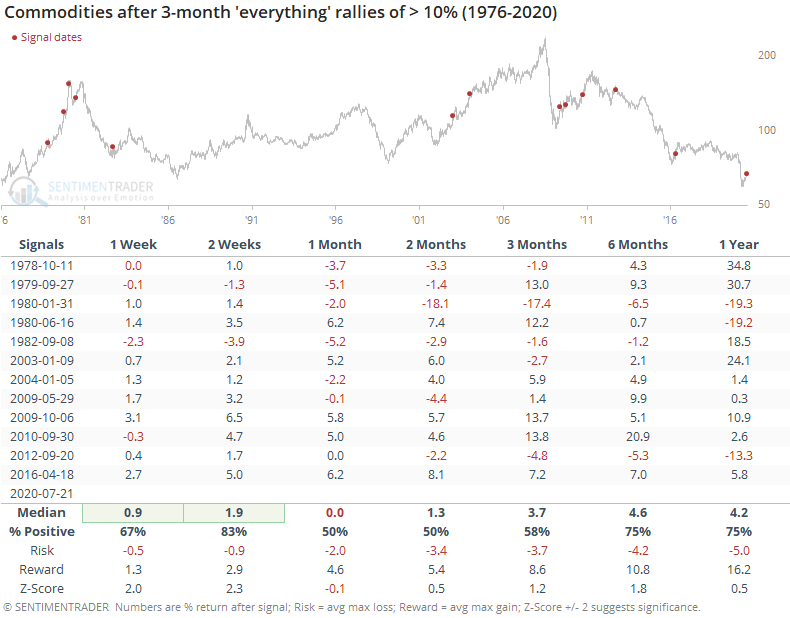
The broad-based buying momentum across assets tended to carry commodities further short-term, and while there were some wobbles, longer-term returns were positive as well. Signals near peaks in 1980 and 2012 were the biggest outliers.

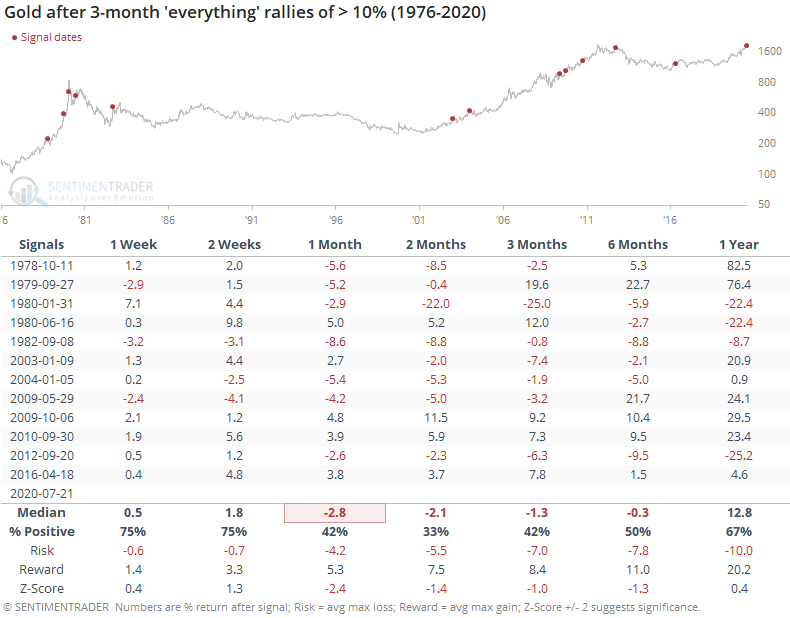
The most consistent asset going forward was gold, and not in a good way. The metal struggled to hold its gains over the medium-term, with well-below-average returns up to six months later. The most notable exceptions were in 2009-10 as it embarked on the 2nd half of its decade-long bull market.

The factors that have contributed to the intense and widespread buying interest over the past three months are still largely intact, so maybe these assets can keep going. Historically, that would be unusual, especially during the next several months. The assets all saw relatively poor medium-term returns after spurts like this, none more so than gold. 

Sorry, you don't have access to this report

Upgrade your subscription plan to get access
Go to Dasboard
PRODUCTS
SentimenTrader
Trading Tools
Indicators & Data API
‍
Strategies & Scanner
‍
Research Reports
FREE
RESOUrCES
Simple Backtest
Calculator
Simple Seasonality
Calculator
The Kelly Criterion
Calculator
Sentiment Geo Map
‍
Public Research Reports
‍
Pricing
Bundle pricing
‍
Announcements
‍
FAQ
COMPANY
‍
About
‍
In the News
‍
Testimonials
‍
Client Success Stories
CONTACT
‍
General Inquiries
‍
Media Inquiries
‍
Financial Professionals Inquiries
‍
© 2025 Sundial Capital Research Inc. All rights reserved.
Setsail Marketing
TermsPrivacyAffiliate Program
Risk Disclosure: Futures and forex trading contains substantial risk and is not for every investor. An investor could potentially lose all or more than the initial investment. Risk capital is money that can be lost without jeopardizing ones’ financial security or life style. Only risk capital should be used for trading and only those with sufficient risk capital should consider trading. Past performance is not necessarily indicative of future results.

Hypothetical Performance Disclosure: Hypothetical performance results have many inherent limitations, some of which are described below. No representation is being made that any account will or is likely to achieve profits or losses similar to those shown; in fact, there are frequently sharp differences between hypothetical performance results and the actual results subsequently achieved by any particular trading program. One of the limitations of hypothetical performance results is that they are generally prepared with the benefit of hindsight. In addition, hypothetical trading does not involve financial risk, and no hypothetical trading record can completely account for the impact of financial risk of actual trading. for example, the ability to withstand losses or to adhere to a particular trading program in spite of trading losses are material points which can also adversely affect actual trading results. There are numerous other factors related to the markets in general or to the implementation of any specific trading program which cannot be fully accounted for in the preparation of hypothetical performance results and all which can adversely affect trading results.

Testimonial Disclosure: Testimonials appearing on this website may not be representative of other clients or customers and is not a guarantee of future performance or success.