
The Persistent Seasonality of International Stocks

Because of the relentless performance of U.S. large-cap stocks over the past decade, international stocks have fallen off the radar for many investors. And that's not the worst thing in the world. Typically swings favoring domestic versus international - and vice versa - take years to play out.
But in the financial market, absolutely nothing lasts forever. As a result, it may be useful for investors to start looking ahead at gaining an "edge" in the international stock market.
U.S VERSUS INTERNATIONAL
Attempting to pinpoint when things start to favor international stocks is likely to be done in vain. However, it can be useful to keep an eye on things. The chart below (courtesy of www.StockCharts.com) displays the weekly performance of the EAFE Index versus the S&P 500 Index over the past 5 years on a weekly basis. The EAFE Index (MSCI EAFE Index) is an international stock index comprised of over 900 non-U.S. and Canadian companies in 21 countries.
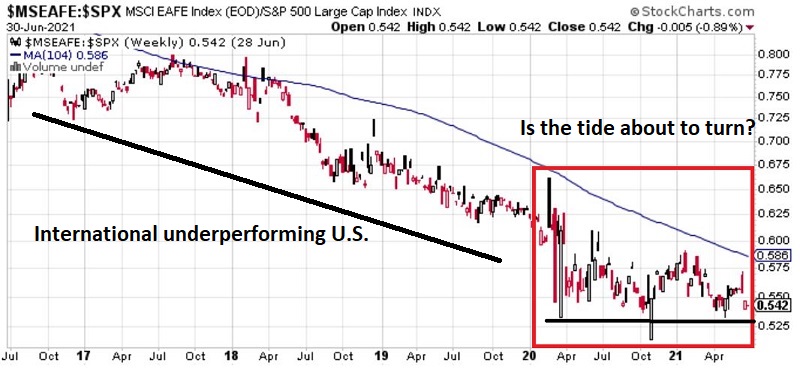
Things to note in the chart above:
- The long downward trend is indicative of international stocks underperforming U.S. stocks
- The choppy, sideways action in recent months may be indicative of a turn
- A true turn favoring international stocks will only be confirmed if this chart begins to rise (indicating EAFE outperforming SPX)
I cannot predict if and when the tide will turn back in favor of internationals (although a reversal to the upside in the chart above would likely be a good clue). However, I can highlight a simple way to gain an edge within the realm of international stocks for those who choose to invest there, either now or in the future.
FAVORABLE VERSUS UNFAVORABLE SEASONAL PERIODS
For testing purposes, we will use monthly total return data for the EAFE Index, starting in January 1970. This gives us over 50 years of returns to analyze. As it turns out, several favorable and unfavorable periods within the calendar have proven extremely useful with international stocks.
The table below displays the cumulative total return for the EAFE Index on a month-by-month basis, from January 1970 through May 2021.
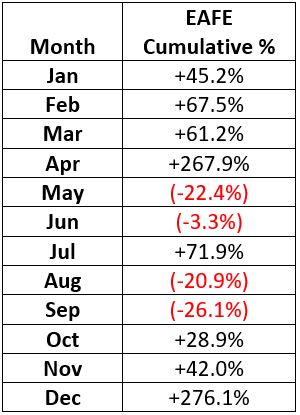
We find two "favorable" periods and two "unfavorable" periods, as shown below.
Favorable Periods:
- October through April
- July
Unfavorable Periods
- May and June
- August and September
A LOOK AT THE HISTORICAL BACK AND FORTH
Now let's look alternatingly at each "favorable" and "unfavorable" period for international stocks.
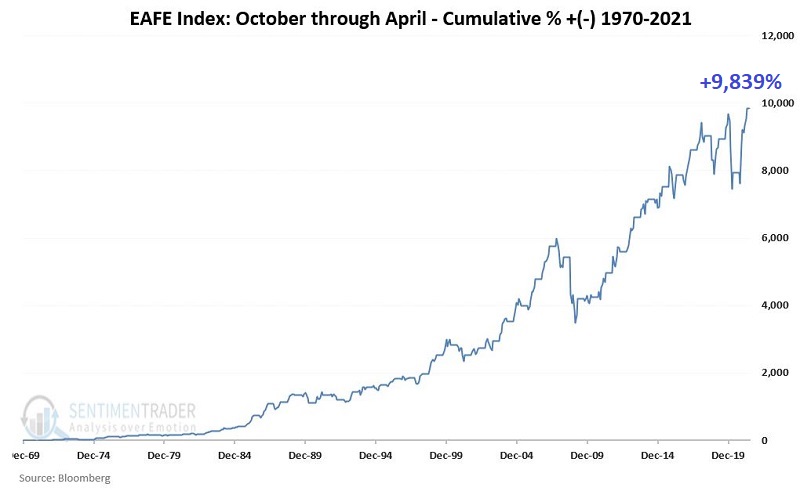
The chart below displays the cumulative % total return for the EAFE Index if held ONLY during the favorable months of October through April every year.
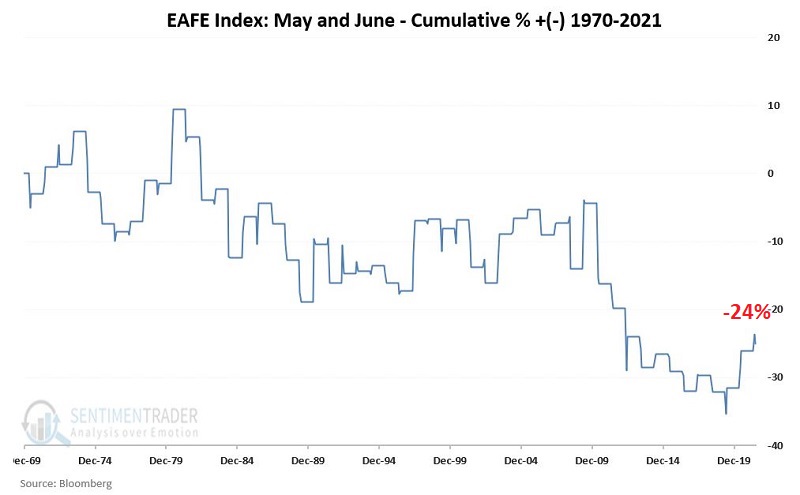
The chart below displays the cumulative % total return for the EAFE Index if held ONLY during the unfavorable months of May and June every year.
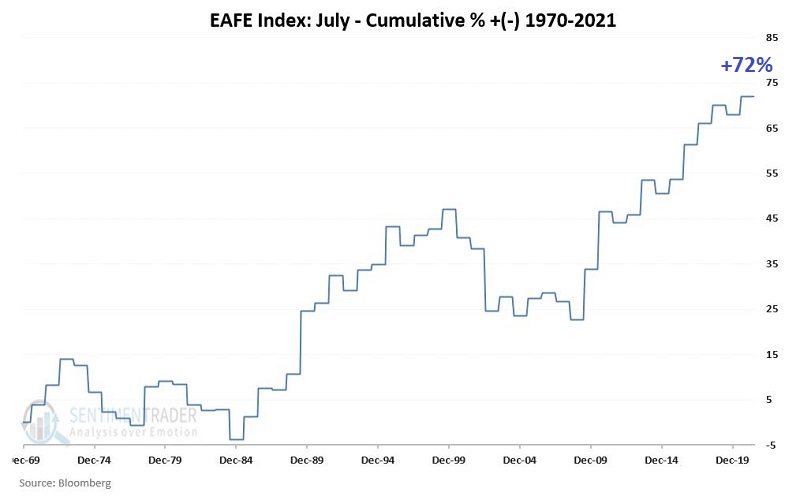
The chart below displays the cumulative % total return for the EAFE Index if held ONLY during the favorable month of July every year.
The chart below displays the cumulative % total return for the EAFE Index if held ONLY during the unfavorable months of August and September every year.
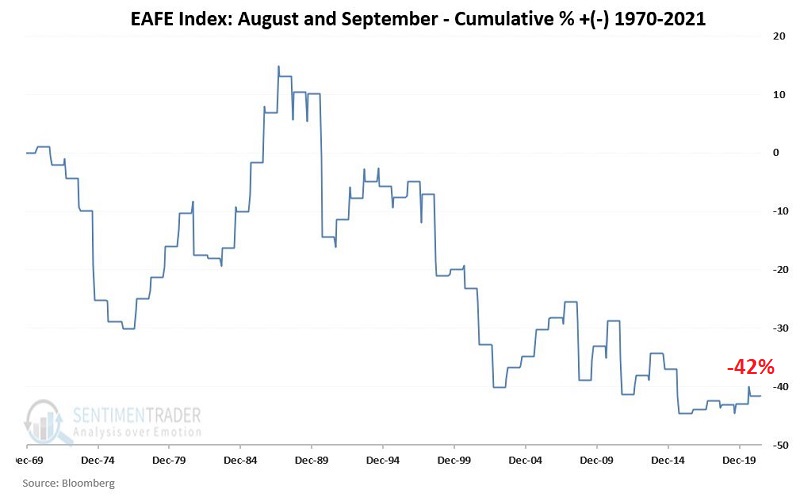
While no seasonal pattern or trend will ever be perfect, the steady upward trend during the favorable periods and the steady downward trend during the unfavorable periods are visible to the naked eye in the charts above.
PUTTING FAVORABLE PERIODS TOGETHER
To emphasize the differences in performance between favorable and unfavorable periods, let's combine both favorable periods and then separately both unfavorable periods.
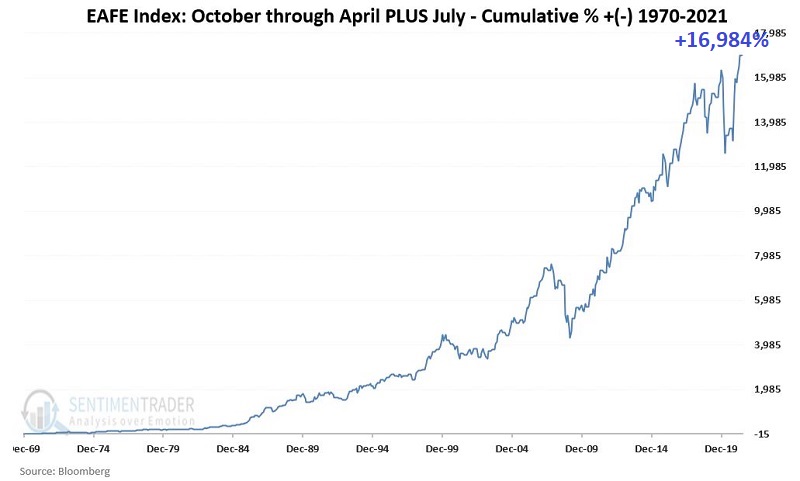
The chart below displays the cumulative total return for the EAFE Index if held every year ONLY during October through April PLUS the month of July.
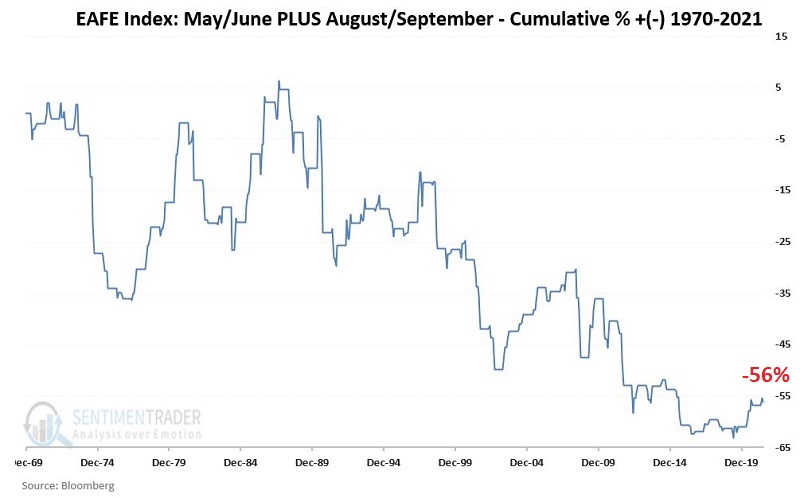
The chart below displays the cumulative total return for the EAFE Index if held every year ONLY during May, June, August, and September.
COMPARING CUMULATIVE RETURNS
To get a better sense of the consistency of this particular seasonal pattern, note that from January 1970 through May 2021:
- $1000 invested in EAFE ONLY during the favorable months grew to $170,385 (or +16,984%)
- $1000 invested in EAFE ONLY during the unfavorable months declined to $438 (or -56%)
If we divide the growth of $1,000 during favorable months by $1,000 during unfavorable months, we get the chart below.
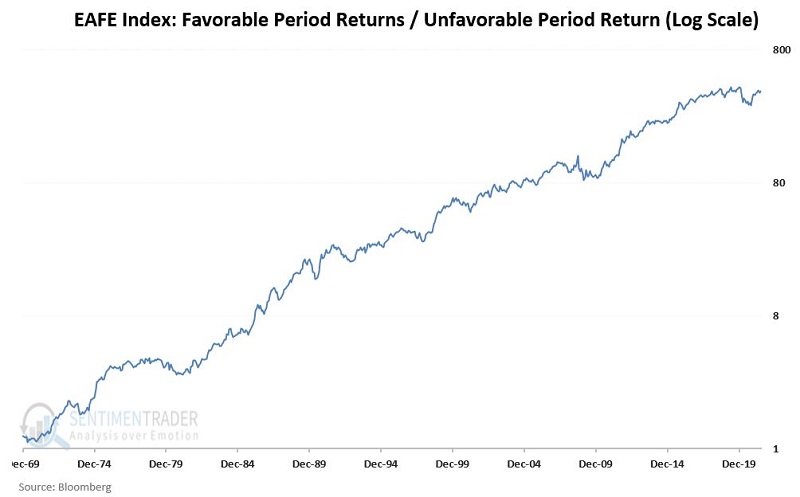
The key thing to note in the chart above is the consistent nature of the uptrend - i.e., the long-term persistence in outperformance during favorable months versus unfavorable months.
The EAFE Index can be traded via the ticker EFA (iShares MSCI EAFE ETF).