
The Probability Of "Gap And Go"

For the 2nd day in a row, the S&P 500 futures are gapping up to a new 52-week high. We've discussed quite a few studies related to gaps and the price action last week that suggested a higher likelihood of risk versus reward for late buyers, so yet another new high is notable.
The emotional part of this is the worry that we will "gap and go", that buyers will see the new highs, get optimistic about an improving outlook, and continue to push stocks higher. That is always a possibility but we try to focus less on possibilities than probabilities.
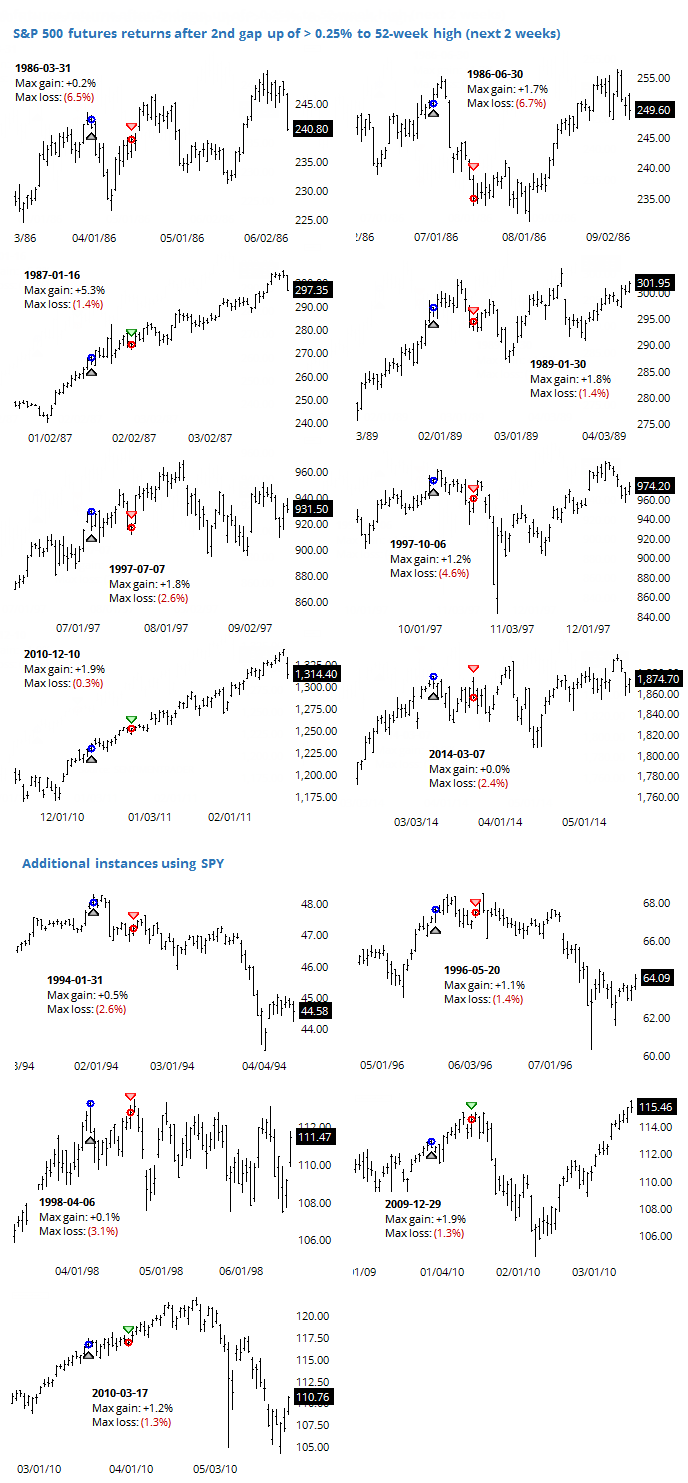
With that in mind, let's take a look at double gaps to a 52-week high, using the S&P 500 futures and any additional instances using SPY. We'll focus on the next two weeks' performance.
The thumbnails below show every instance since 1982 and we can see from the charts and stats that the risk/reward still tended to be tilted toward "risk".
Out of the 13 occurrences, only two led to "gap and go" scenarios when stocks didn't pull back much at all in the shorter-term. Another (March 2010) could also be considered, but the "go" part only lasted another couple of weeks before it all fell apart.
Among the majority of instances that saw some backing-and-filling over the next couple of weeks, the upside was limited to under +2%. Most of them topped out either within 2 trading days. That would suggest that if stocks manage to climb higher and/or longer than that, then we're seeing something different and the precedents we've been relying on are invalid.