
The Short-Term Bear Put Spread

In the most succinct terms possible, trading can be boiled down to two a two-step process:
- Spot opportunity
- Exploit opportunity
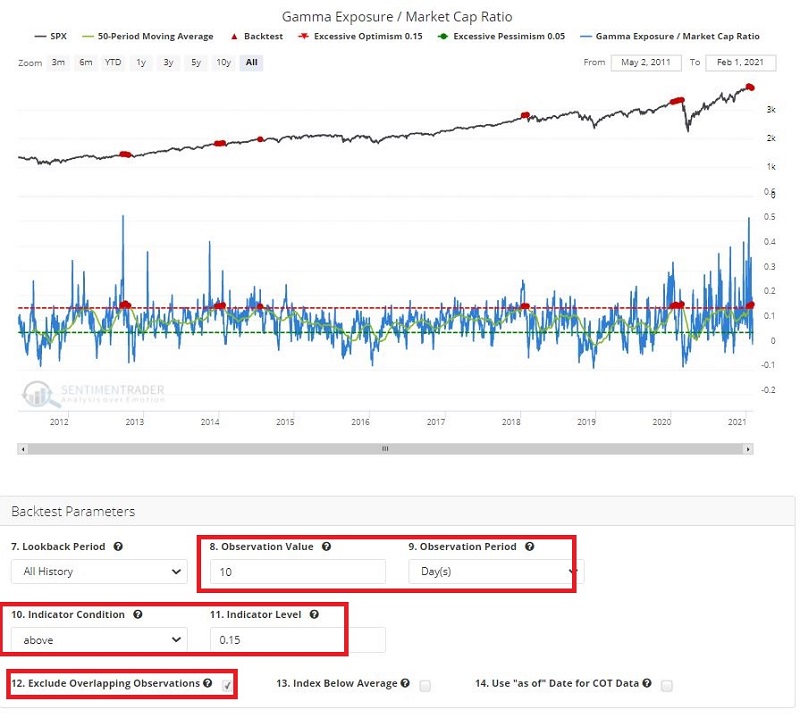
Now in very verbose terms, let's illustrate this process with an example (as always, any specific trades that I write about should be considered just that - examples - and NOT specific trade recommendations). In a recent post, Jason highlighted an indicator referred to as "Gamma Exposure/Market Cap Ratio". He also highlighted that when the 50-day average of this indicator exceeds 0.15 it tends to be followed by some stock market struggles over the next 3 months. We will use this tendency as our starting point.
The Setup
For openers, I am making one adjustment to the parameters. In the Sentimentrader Backtest Engine, I have changed the "Observation Period" to 10 days. I believe Jason's original test used 90 days or more in order to avoid considering overlapping signals. However, for the purposes of this study, because we will be looking at relatively short-term trades, I want to be able to "get back in" if:
- the first trade did not pan and out, and/or
- the indicator is still in unfavorable territory.
So, if after 10 trading days the setup is still active, we can consider adding a 2nd position.
The figure below displays the parameters at the bottom and the signals marked on an S&P 500 Index bar chart at the top.
 The figure below shows the actual performance of the S&P 500 Index following each signal in the chart above.
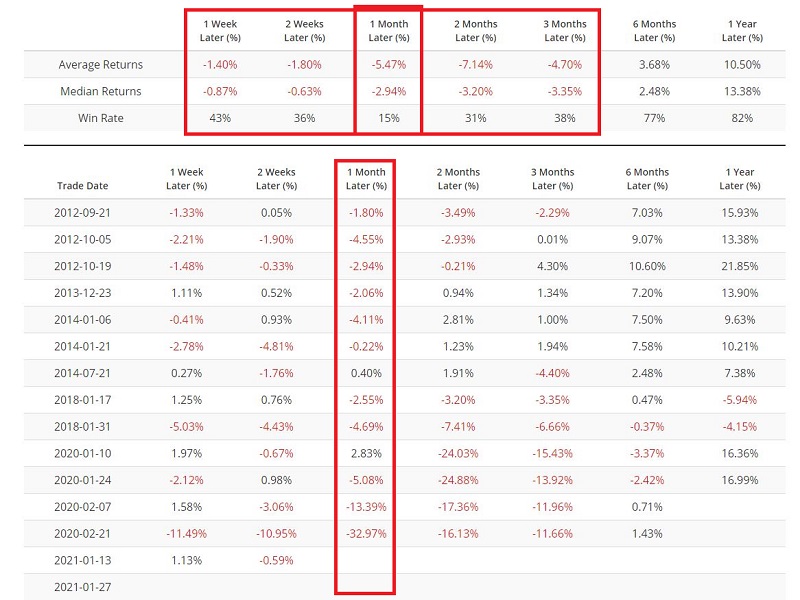
Things to Note:
- As you can see, the market typically struggles for much or all of the 3 months following new signals. The 1-month time frame appears to be particularly vulnerable (with only a 15% Win Rate for long trades), so we will focus our attention there (although there is no reason other traders cannot or should not look at the other timeframes as well).
- The median return for 1-month later is -2.94%. This means that if we try to leverage our profit by buying cheap out-of-the-money put options we run the risk of watching them expire worthless. As a result, we need to adopt a strategy that has the potential to make money from a moderate price declines.
- There is any number of options strategies that a trader can use. What follows is merely one example of a strategy chosen to try to exploit the type of price action that tends to follow the signals generated above.
The Strategy: Bear Put Spread
The strategy we will look at is known as a "bear put spread", which involves buying one put option at a higher strike price and selling another put option at a lower strike price. However, in this case, because we want to be able to make money on even a small decline in the price of the underlying security, we will use the following guidelines:
- Option expiration with at least 30 days left until expiration (so that we can hold the trade for 1-month of desired)
- Buy a put with a delta close to -60
- Sell a put with a delta close to -30
Delta is the option Greek that tells us roughly the stock equivalent position. In other words, buying a put option with a delta of -60 gives you roughly the same expected P/L (at least for the current day) of shorting 60 shares of the underlying security.
Buying a -60 delta gives us an "in-the-money" position (a put option is considered "in-the-money" if the strike price is above the current price of the underlying security) that can begin to make money quickly if the underlying security declines in price.
Selling a -30 delta does two things for us:
- The premium received for selling the put helps pay for the -60-delta put that we bought
- Allows time decay to work in our favor if the underlying security drops below the strike price of the option we bought (rather than work against us if we only bought a put).
Trading Assumptions:
- We will assume a trade is entered using a limit order based on the midpoint of the bid/ask spread for each option.
- For purposes of illustration, we are going to hold each trade until expiration. In real-world trading, traders should consider other possibilities as well (cutting a loss, taking early profits - all or partial - based on price movement or a sharply oversold indicator of choice, adjusting the position along the way)
Position Sizing and Money Management:
With a trade like let's consider two basic approaches.
With Approach #1 each trade is sized so that the maximum loss on the spread is within the maximum loss you will allow for a given trade; this gives you the flexibility to "hold on" even if the trade starts to go against you. In other words, worst case:
- The trade goes the wrong way
- You hold the trade until expiration
- The position expires worthless
- The resulting loss is within your "acceptable" amount of loss per trade
Approach #2 is to trade a larger lot-size and to enter a stop-loss order to try to avoid the maximum loss on the trade.
- If the trade goes in your favor you may make more money by virtue of trading a larger lot-size
- But you do run the risk that if the trade goes against you temporarily, your stop-loss can be hit and you may exit the trade prior to the subsequent down move in the underlying securities' price that you were playing for
As with a lot of things in options trading, there is no correct answer to the choice above, only decisions to be made.
The Example Trades:
All figures below are presented courtesy of www.OptionsAnalysis.com. We start with the date of 2018-01-17 from the table of signal dates above.
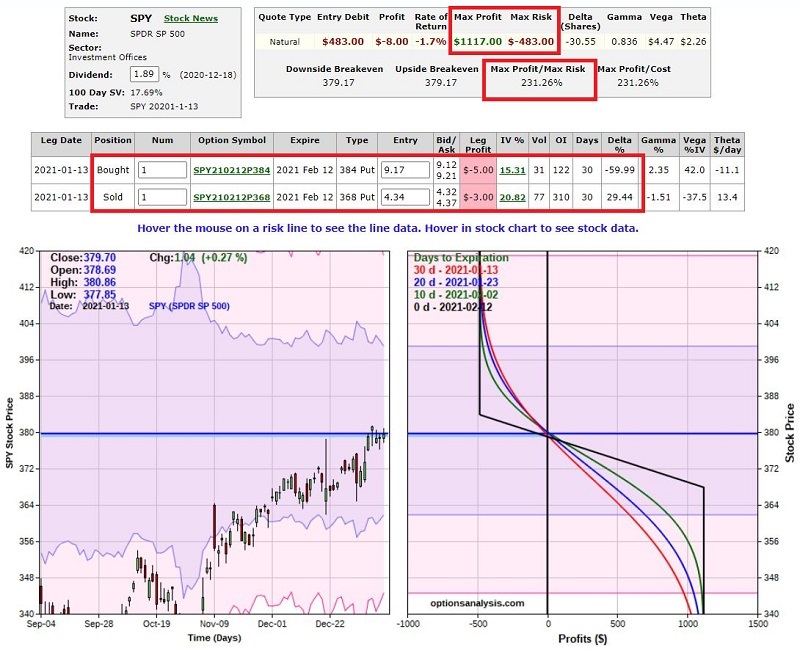
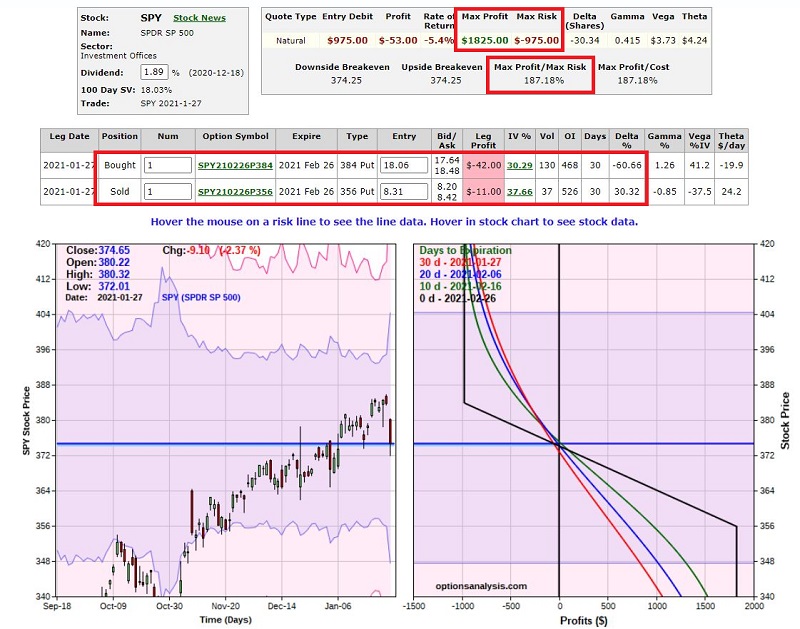
- For each trade, I have highlighted the maximum profit and maximum risk, the profit/risk ratio and the details of each leg of the trade in the top clip
The charts for each displays:
- The left-hand box displays a bar chart for ticker SPY (our "underlying security") with SPY price down the left side and the date along the bottom
- The right-hand side box displays the expected $ profit/loss at each given price for SPY as of one of four different dates leading up to expiration (the black line represents the expected P/L at expiration)
- The dates corresponding to each line appear in the upper left of the right-hand side box
- The price for SPY appears down the right side and the expected $ profit/loss appears along the bottom of the right-hand box
Trade #1: 2018-1-17; SPY at 279.61
- Bot 1 Feb16 281 put @ $3.46
- Sold 1 Feb16 275 put @ $1.51
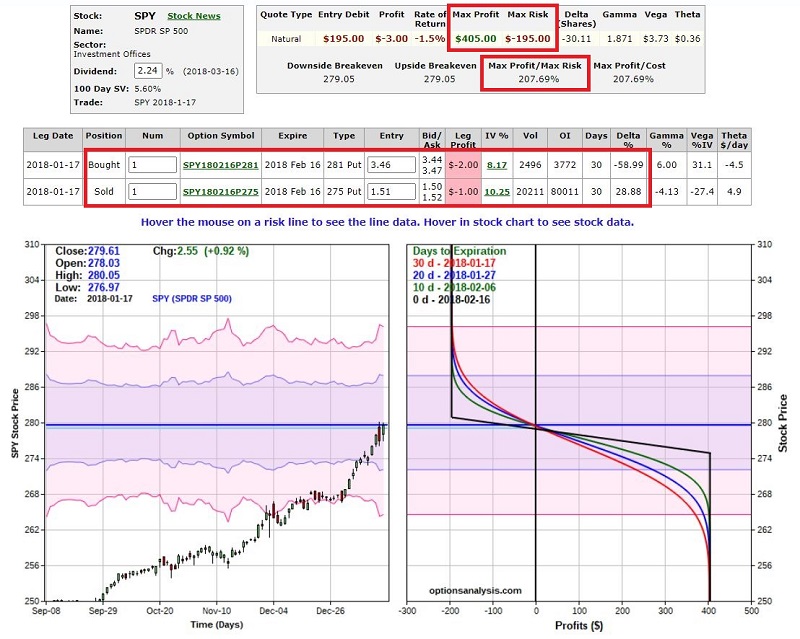
Trade result if held to 2/16/2018 expiration:
- SPY = 273.16 (down from 279.61)
- Trade $ P/L = +$405
Trade #2: 2018-1-31; SPY at 281.91
- Bot 1 Mar02 284 put @ $4.22
- Sold 1 Mar02 277 put @ $1.91
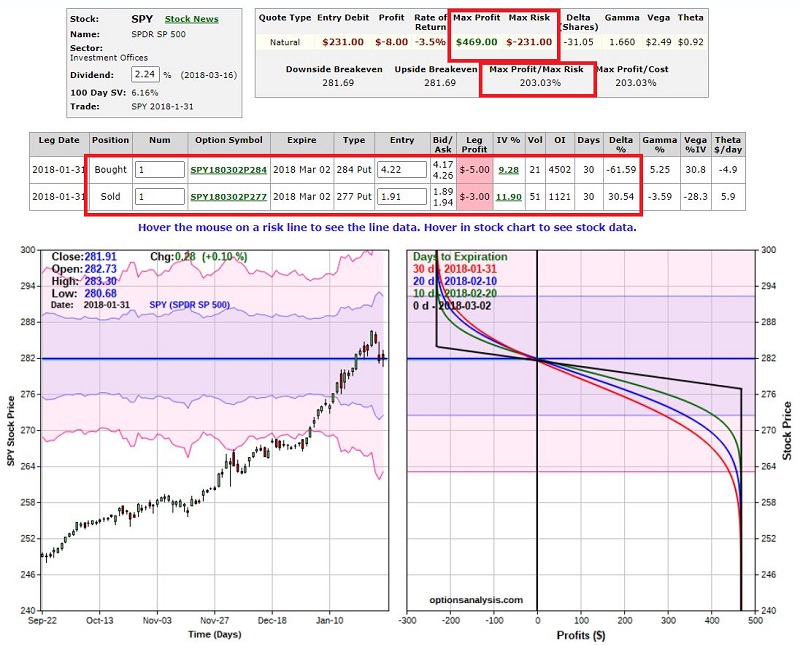
Trade result if held to 3/2/2018 expiration:
- SPY = 269.10 (down from 281.91)
- Trade $ P/L = +$469
Trade #3: 2020-1-10; SPY at 325.64
- Bot 1 Feb14 328 put @ $5.04
- Sold 1 Feb14 319 put @ $2.44
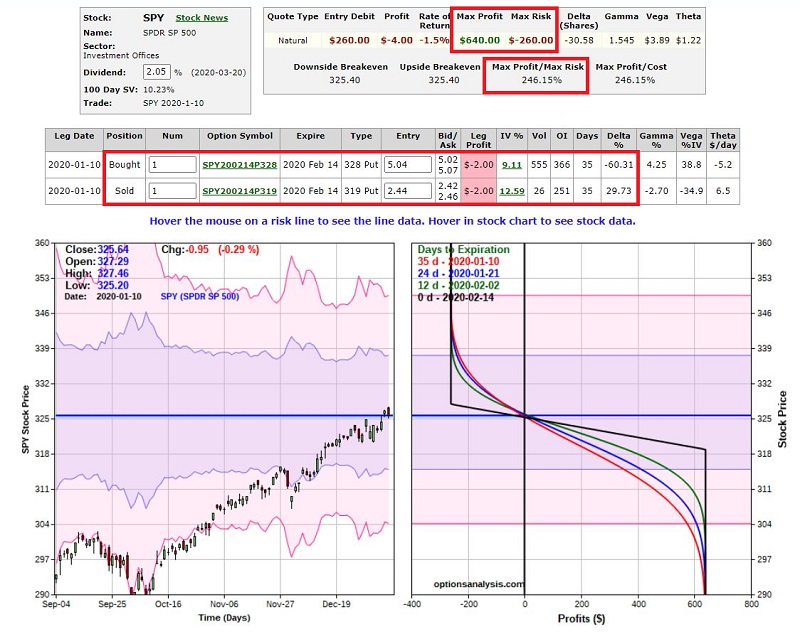
Trade result if held to 2/14/2020 expiration:
- SPY = 337.60 (up from 325.64)
- Trade $ P/L = (-$260)
Trade #4: 2020-1-24; SPY at 328.76
- Bot 1 Feb28 332 put @ $6.36
- Sold 1 Feb28 321 put @ $2.97
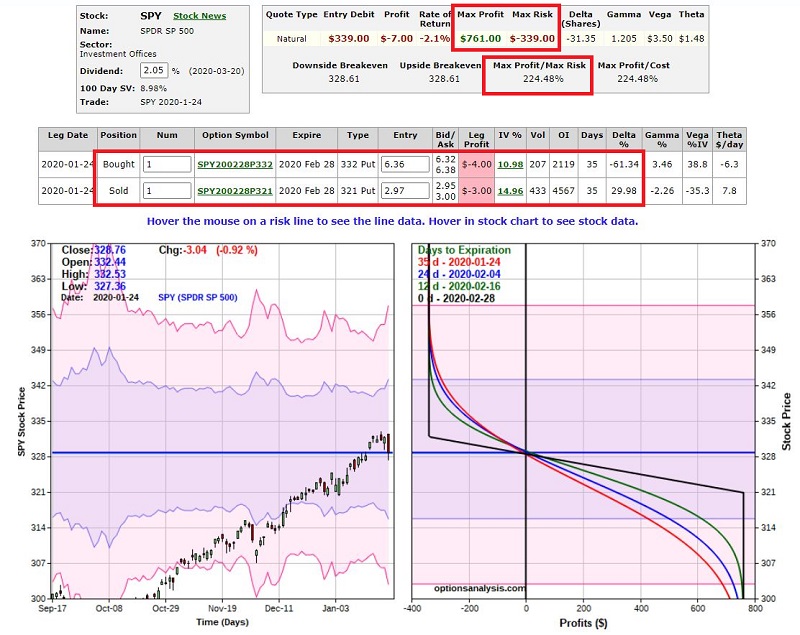
Trade result if held to 2/28/2020 expiration:
- SPY = 296.24 (down from 328.64)
- Trade $ P/L = +$761
Trade #5: 2020-2-7; SPY at 332.24
- Bot 1 Mar13 335 put @ $6.30
- Sold 1 Mar13 324 put @ $2.98
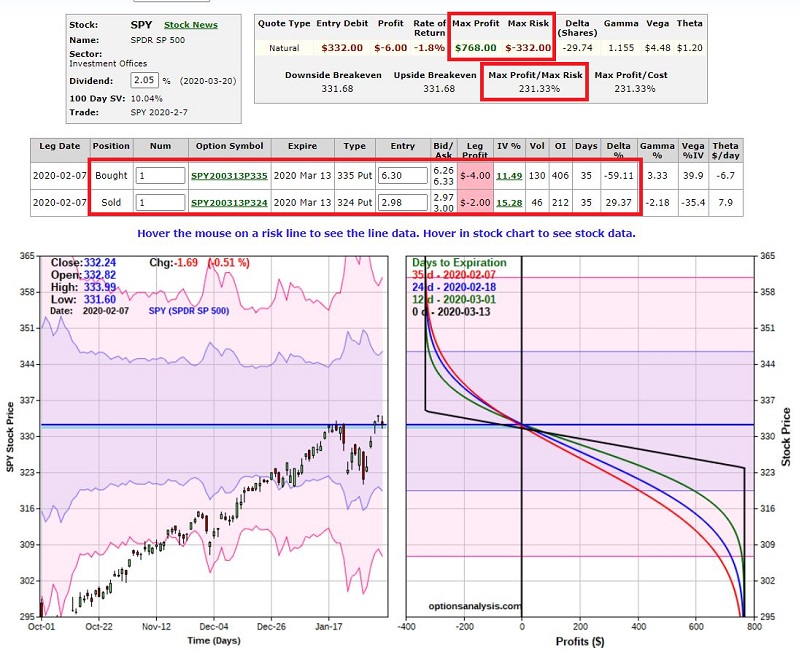
Trade result if held to 3/13/2020 expiration:
- SPY = 270.20 (down from 322.24)
- Trade $ P/L = +$768
Trade #6: 2020-2-21; SPY at 333.45
- Bot 1 Mar27 337 put @ $7.57
- Sold 1 Mar27 324 put @ $3.47
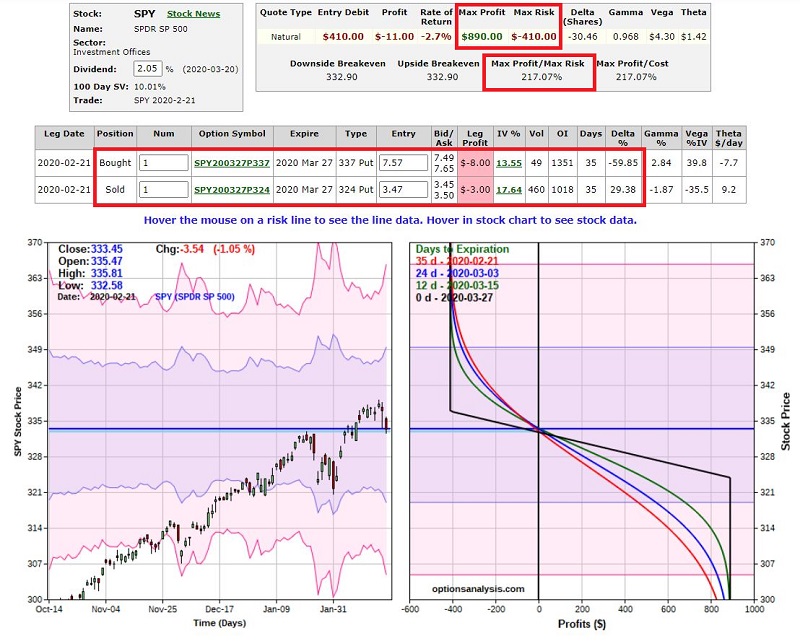 Trade result if held to 3/27/2020 expiration:
- SPY = 254.00 (down from 333.54)
- Trade $ P/L = +$890
Trade #7: 2021-1-13; SPY at 379.70
- Bot 1 Feb12 384 put @ $9.17
- Sold 1 Feb12 368 put @ $4.34
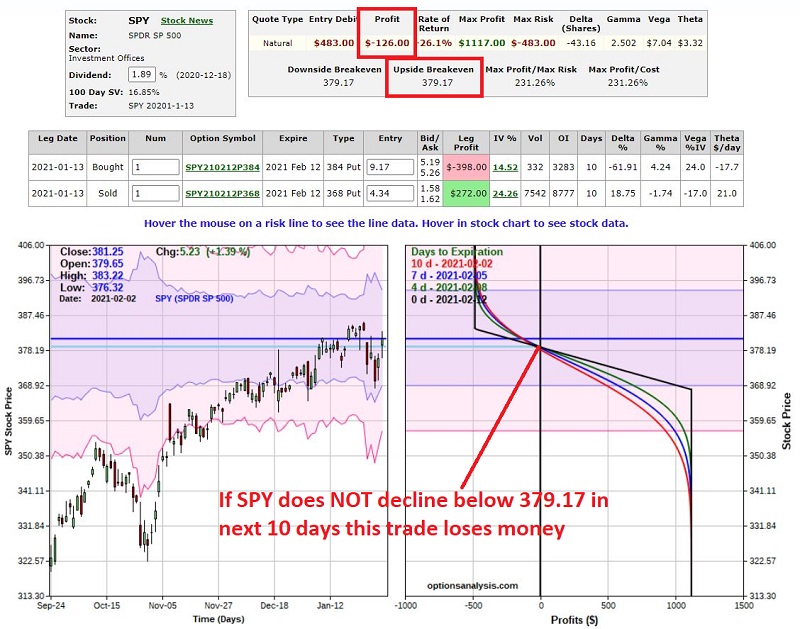
As of 2/2/2021 (with 10 days left until expiration):
- SPY = 381.25 (up from 379.70)
- Open Trade $ P/L = ($-126)
The current status of this position appears in the figure below.
Trade #8: 2021-1-27; SPY at 374.65
- Bot 1 Feb26 384 put @ $18.06
- Sold 1 Feb26 356 put @ $8.31
As of 2/2/2021 (with 24 days left to expiration):
- SPY = 381.25 (up from 374.65)
- Open Trade $ P/L = (-$412)
The current status of this position appears in the figure below.
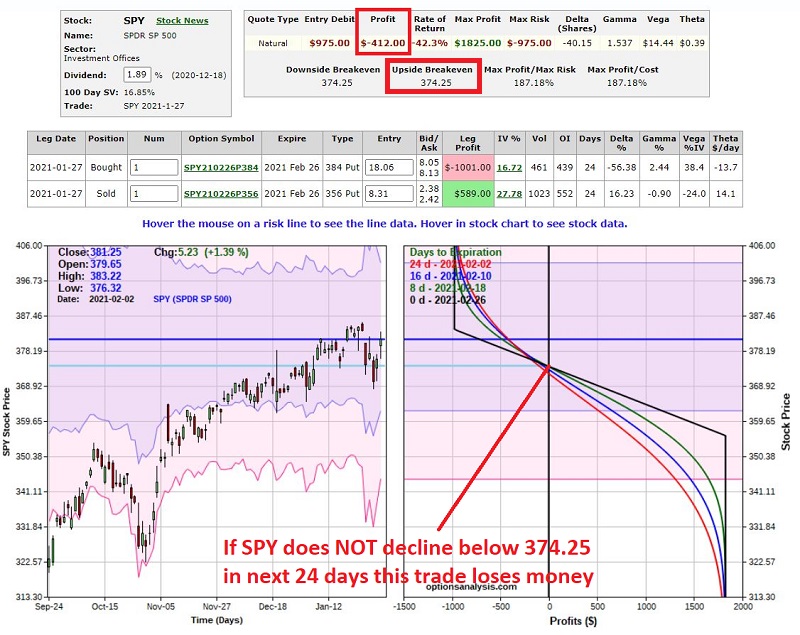
As of 2/2/2021 both Trade #7 and Trade #8 are underwater. Will ticker SPY decline enough prior to option expiration for each trade to bail them out and generate a profit? Or are these trade destined to end up as losing trades?
Only time will tell.
This current status does, however, remind us of two important real-world lessons:
- Even a setup that has been 85% accurate in the past can lose the next time around
- Proper position sizing is a critical step to success in ANY type of trading.