
The Surprisingly Cyclical Nature of Gas Prices

At the moment, given the non-stop rise in the price of crude oil in the last year and the pickup of inflation in recent months, there is a lot of concern regarding the future direction of gasoline prices. Human nature being what it is, this is understandable. Which make this an opportune time to invoke the following:
Jay's Trading Maxim #16: Human nature can be detrimental to trading success and should be avoided as much as, um, humanly possible.
The chart below displays retail gas prices since 1991 as reported the U.S. Retail Automotive Gasoline Total Regular Average spot price, sourced from the U.S. Department of Energy. Again, with prices surging recently to a 4-year high, the heightened level of concern is understandable.
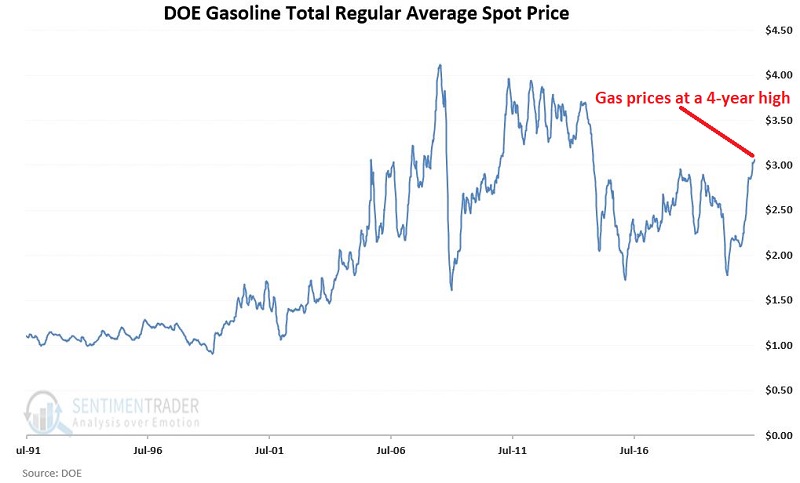
At first blush, there does not appear to be much rhyme or reason to the fluctuations in the price of gasoline. However, if we dig a little deeper, it turns out that there is a great deal of cyclicality to it.
UNLEADED GAS FUTURES SEASONALITY
The chart below displays the annual seasonal trend for Unleaded Gas futures.
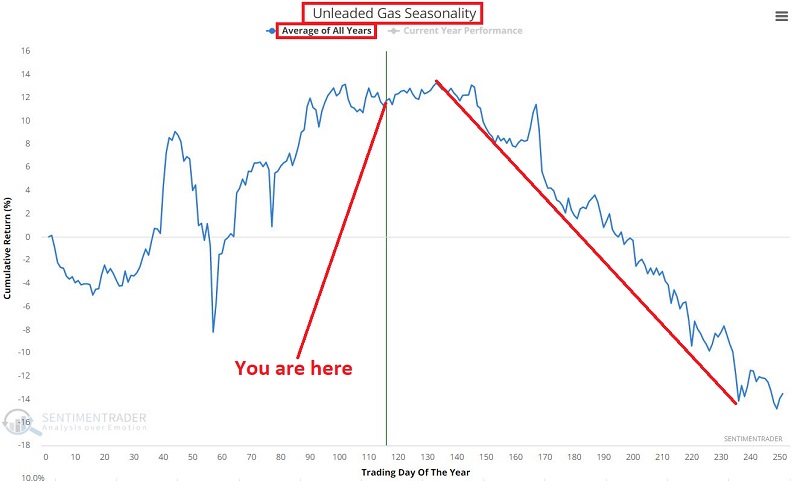
Does anything jump out at you in the chart above? If your vision is even remotely functional, you likely picked up on the significant weakness that tends to occur in the second half of the year.
This raises an interesting question: "Does this cyclicality in the futures market translate in any way to the price at the pump?" That answer to that question depends on how closely gas prices correlate to unleaded gas futures.
UNLEADED GAS FUTURES VERSUS THE PRICE OF GAS AT THE PUMP
The chart below displays the price of Unleaded Gas futures and retail gas prices together.
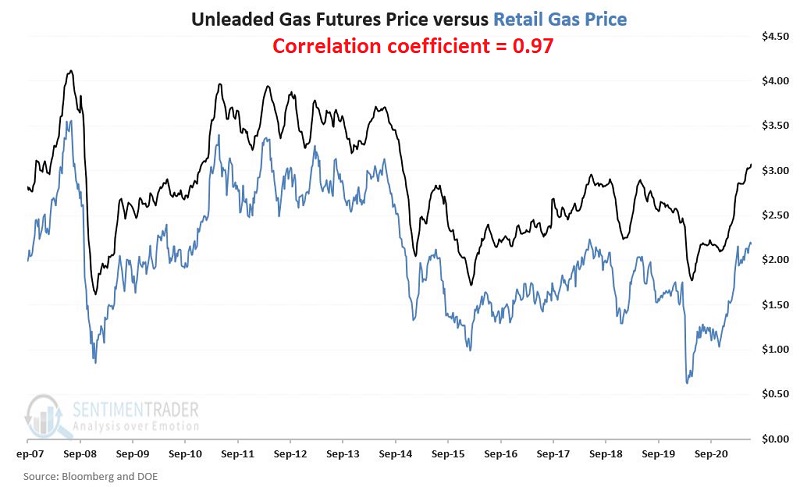
As you can clearly see in the chart above, there is a very high degree of correlation between the two data sets. How high? I calculate a correlation coefficient of 0.97 (1.00 means they trade exactly the same).
SEASONAL FLUCTUATION IN THE PRICE OF GAS
The gas price data series comes out each Monday. So, we will break the calendar year into two periods:
- The bearish period begins on the 2nd Monday of July and extends for 24 weeks
- The bullish period begins where the bearish period ends and extends through the 2nd Monday of July
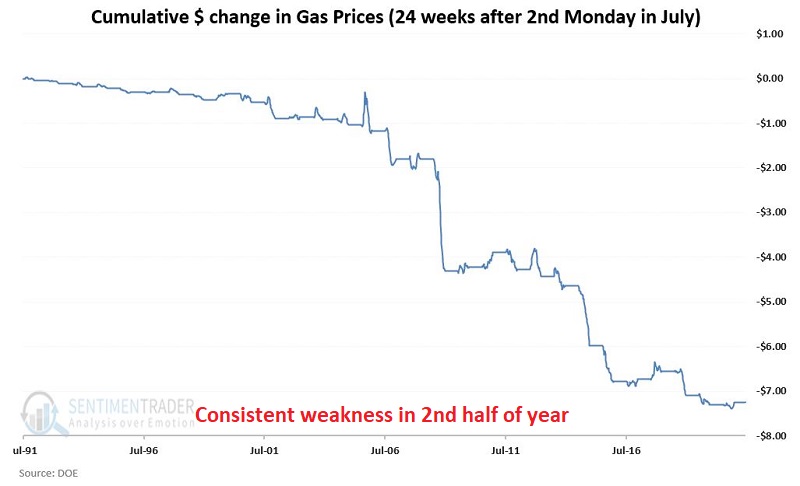
BEARISH PERIOD
The bearish period begins on the 2nd Monday of July and extends for 24 weeks. The chart below displays the cumulative dollar and cents change in the price of gasoline during the bearish period starting in July 1991.
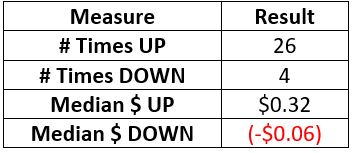
The table below displays the performance of Gas prices during the bearish period.
BULLISH PERIOD
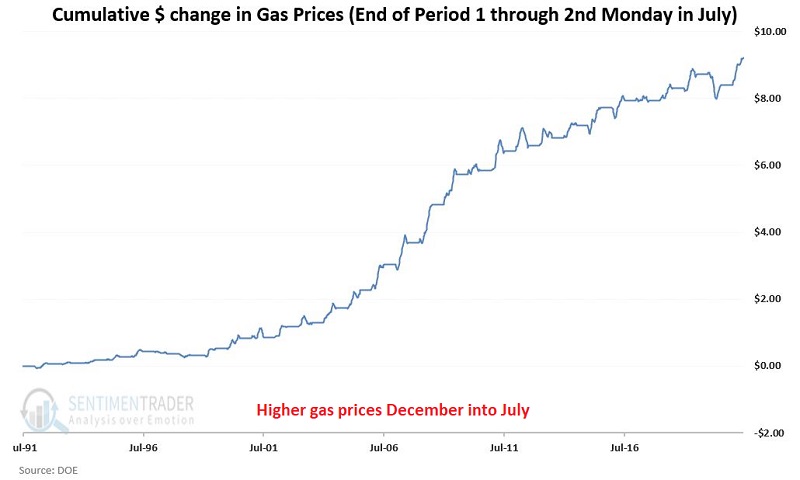
The bullish period begins where the bearish period ends and extends through the 2nd Monday of July. The chart below displays the cumulative dollar and cents change in the price of gasoline during the bullish period starting In July 1991.
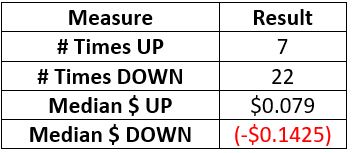
 The table below displays the performance of Gas prices during the bullish period.
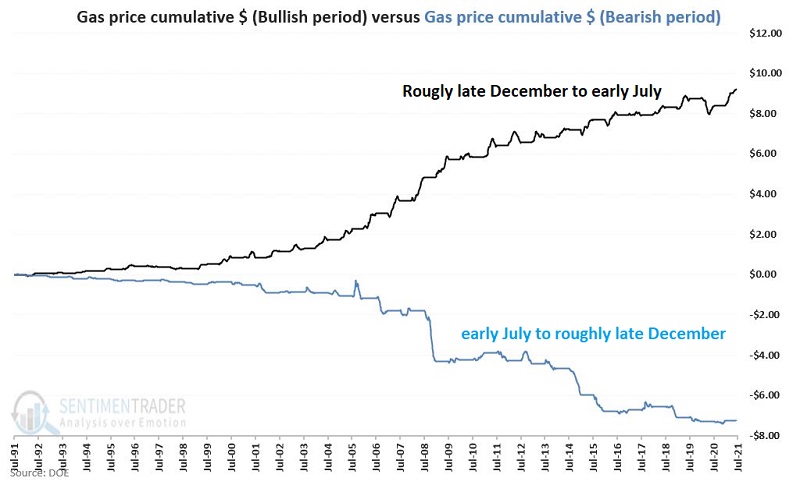
The chart below displays both of the lines from the previous charts together to highlight the stark contrast in performance.
SUMMARY
As I stated at the outset, concerns about ever-higher gas prices "feel" perfectly logical given the current state of affairs in both the oil market and inflation in general. Likewise, with any seasonal/cyclical trend, there is never any guarantee that things will go as expected "this time around." Nevertheless, with the 2nd Monday of July fast approaching, history suggests that drivers may feel surprisingly more at ease at the pump in the months ahead.
Here's hoping.