
The VIX bubble

If there is a bubble anywhere, it's in "fear."
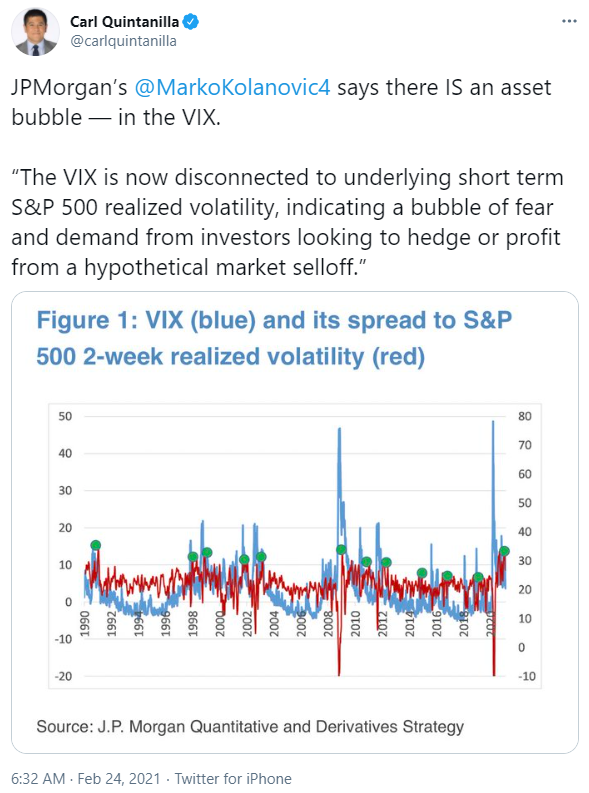
According to JP Morgan, via a tweet by CNBC anchor Carl Quintanilla, traders are irrationally pricing in higher-than-justified amounts of future volatility, given how calm stocks have been.
Bloomberg notes that:
Historically, three months after that spread moved this wide, the VIX fell 11 points and the market rallied an average 12% with a move higher 87% of the time.
Yep, pretty much.
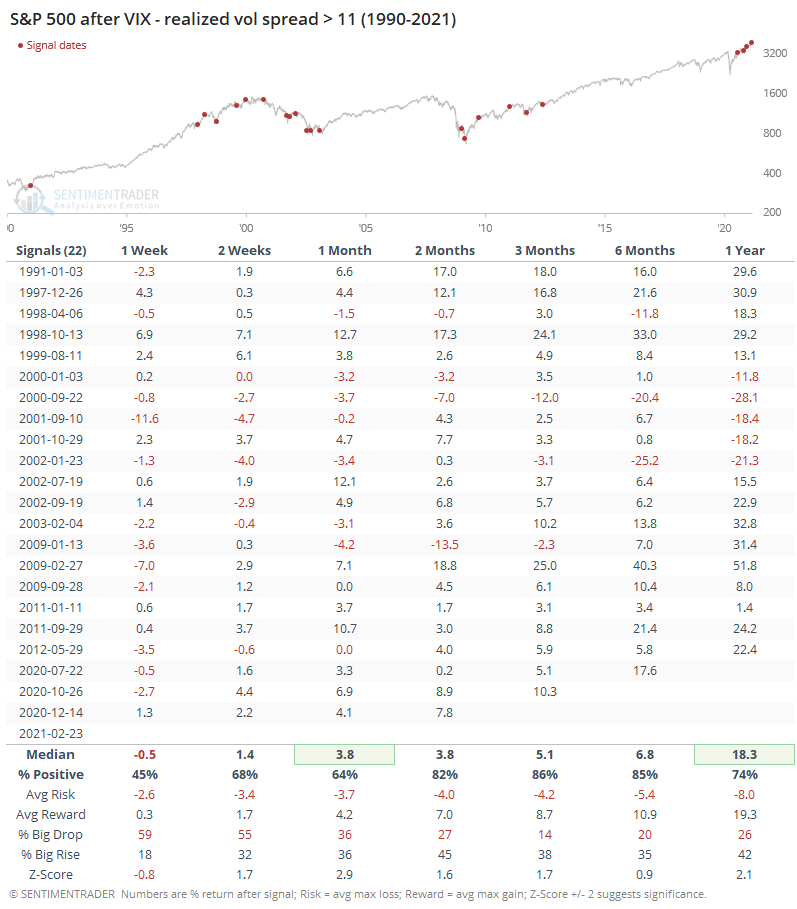
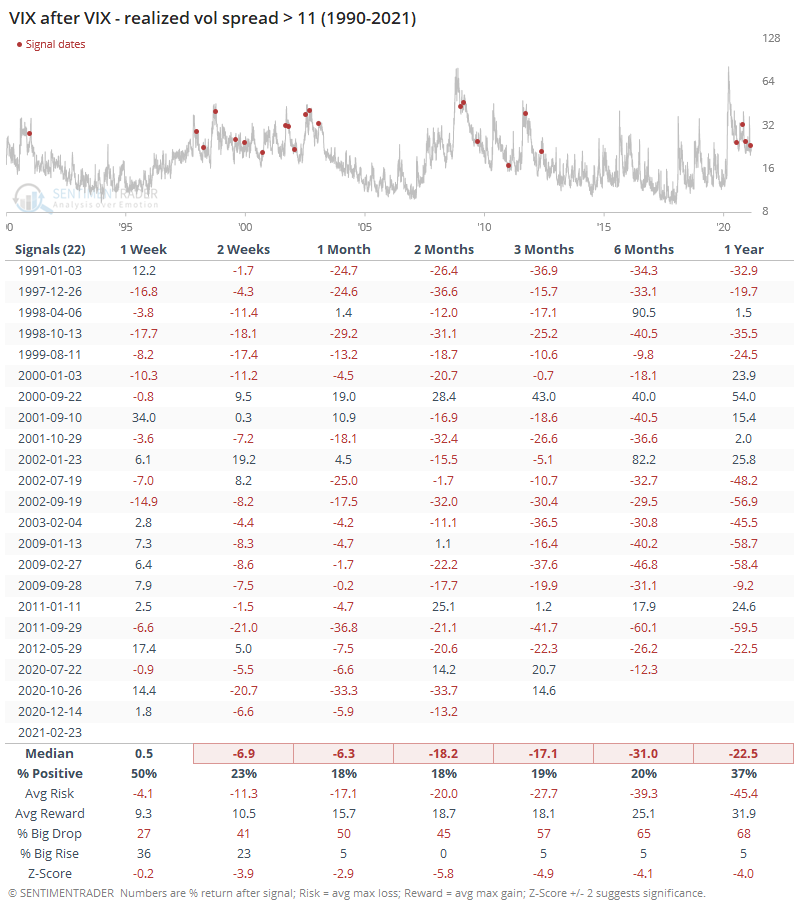
The VIX consistently got pummeled as the air was let out of its "bubble."
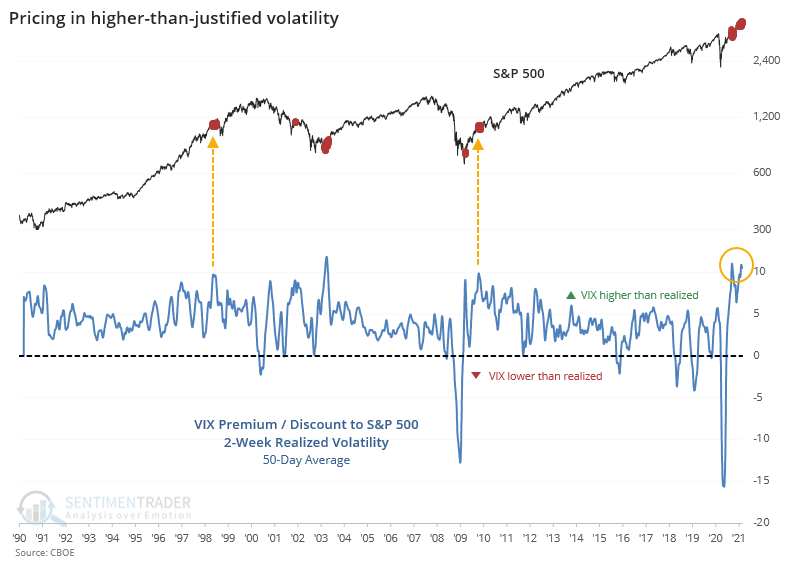
The chart below shows the difference between the VIX and the S&P 500's historical 10-day volatility. If it's above zero, then the VIX is higher than actual volatility. Right now, it's well above zero and among the highest readings in 30 years.
We've never seen the VIX so elevated above realized volatility, for so long. The 50-day average of this spread is near record highs, which is more likely to happen when stocks are selling off than when they're rallying. There have been only two other times it has been this wide while stocks are trading at or near a 52-week high - June 1998, and October 2009.
Neither were terrible for stocks, especially longer-term, but in the interim, there were some issues.
There isn't much about this that's consistent or compelling enough to consider it a strong signal for forward returns. The biggest takeaway is that we shouldn't assume that options traders are "irrationally" pricing in higher-than-justified volatility over the next month or so. Based on their record, they're sometimes more rational than the rest of us.