There Has Never Been a Year Quite Like This

This year has marked one of the few times in history that both stocks and commodities have rallied at least 14% through this far into a year. In fact, it's the best year for both assets, edging out 1976.
For stocks, in particular, it's been one of the best, most consistent, and most persistent rallies year-to-date in its history. Through the end of June, the S&P 500 has rallied more than 14%, ranking in the top 85% of all years since 1928.
It's also been one of the most consistent years. The S&P has scored 34 record highs for the year already, ranking in the top 88% of all years.
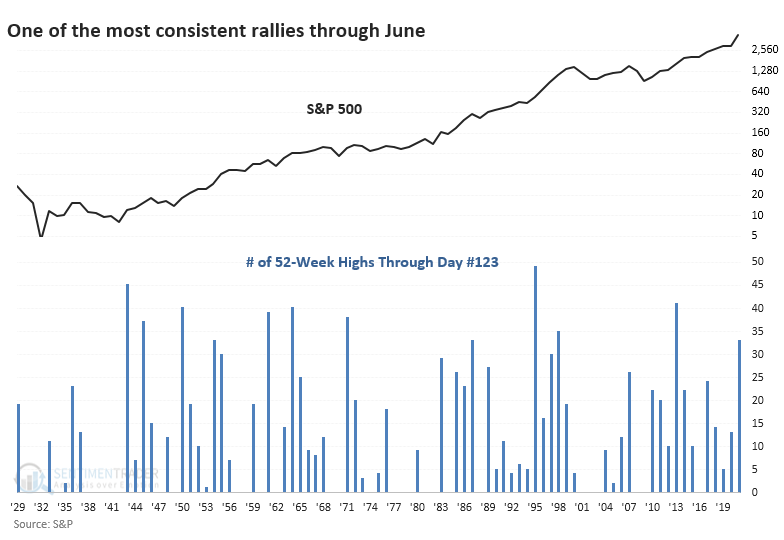
And it has been a very persistent rally. The S&P has now gone more than 150 sessions since the index was more than 5% off of its peak. That streak ranks in the top 93% of all years since 1928.
Momentum is a strong force and doesn't usually roll over easily. If we look at the strongest, most consistent, and most persistent years through June, this year ranks among the best.
The risk/reward for the last half of the year was decent after the other "best" years. There were almost no large declines in the months ahead, but gains also tended to be limited. That's a combination of a lot of buying power potentially already used up, along with what has frequently been a summer soft spot.

What else we're looking at
- Future returns after the largest, most persistent, and most consistent rallies through June
- What happens after 5 straight positive months and an all-time high (hint: the signal was never wrong)
- A look at 2 sectors that have the longest monthly win streaks since 1926
- International stocks are about to enter a consistent seasonal window
- Checking in on some trade ideas and how they performed
| Stat box According to Bloomberg data, "soft" economic reports like sentiment surveys have been 62% more surprising to economists than "hard" economic reports like housing data or the jobs market. This is the largest tilt toward soft surprises since November 2018. |
Etcetera
Gassy returns. The UNG Optix crossed above 91 for the 6th time this year. When this indicator crossed above 91 in the past, the fund saw losses going forward most of the time according to our Backtest Engine.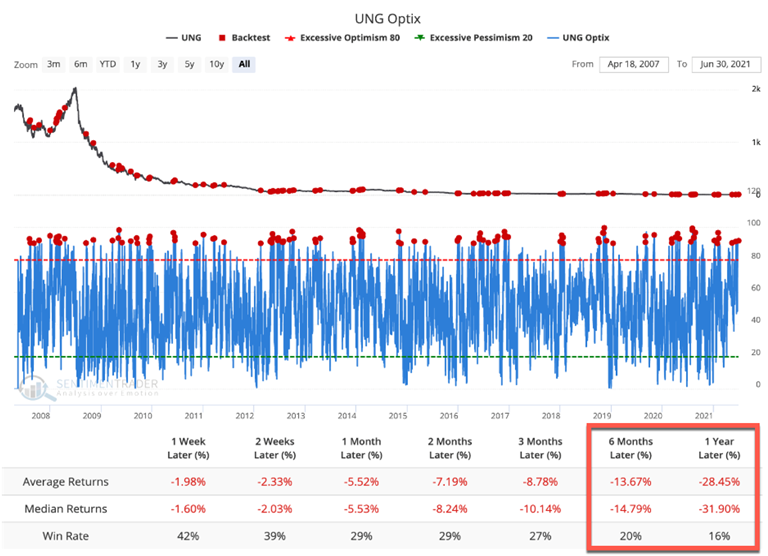
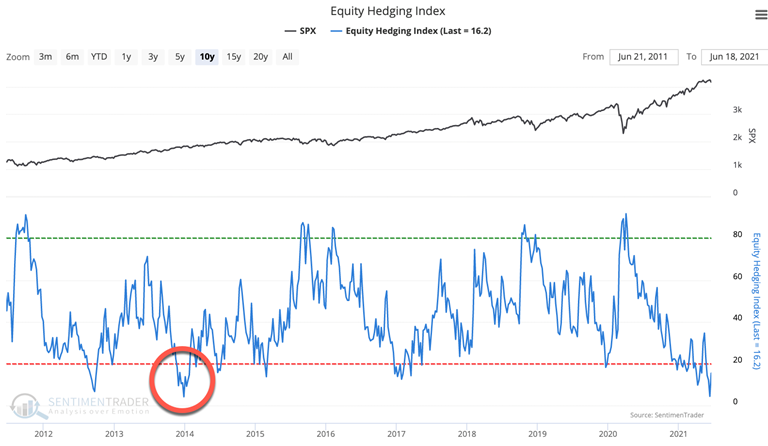
Hedging bets. The Equity Hedging Index has stalled below 20 for a month. The last time we saw a trend like this was in 2014, after which stocks dipped then rallied, although slightly.
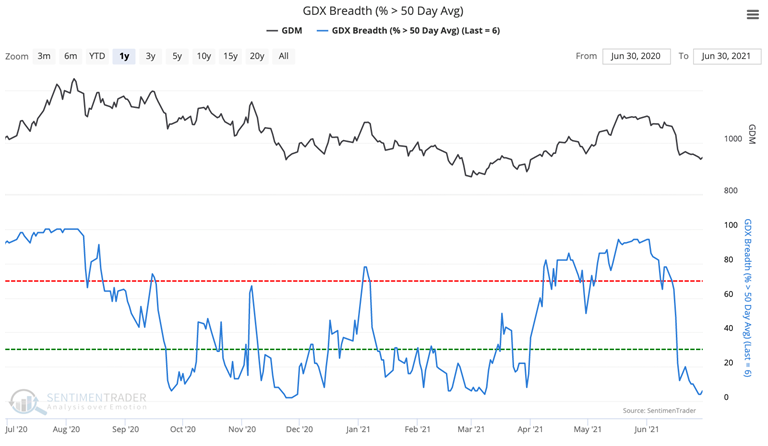
Goldie drops. At the beginning of June, 94% of gold mining stocks were above their 50-day moving averages. At the end of the month, only 4% of miners were.