
This crude oil pattern suggests lower prices

Key points:
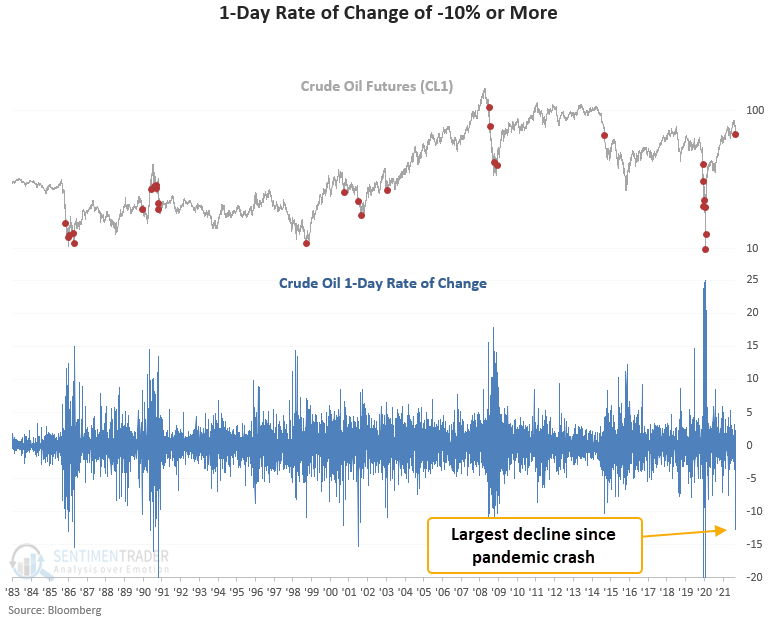
- Crude oil futures declined by 12.7% and closed at a 2-month low on Friday
- The commodity closed up 2.6% on Monday
- A significant decline followed by a bounce suggests lower prices in the near term
A rare crude oil pattern
Crude oil just enjoyed a big bounce from an even bigger decline. Traders are wondering if that bounce is more likely to be of the "dead cat" variety.
According to my data, a 1-day decline of 12% or more has only occurred 16 times since 1983. If I include a condition that crude oil also closes at a 42-day low, the number of instances drops to seven.
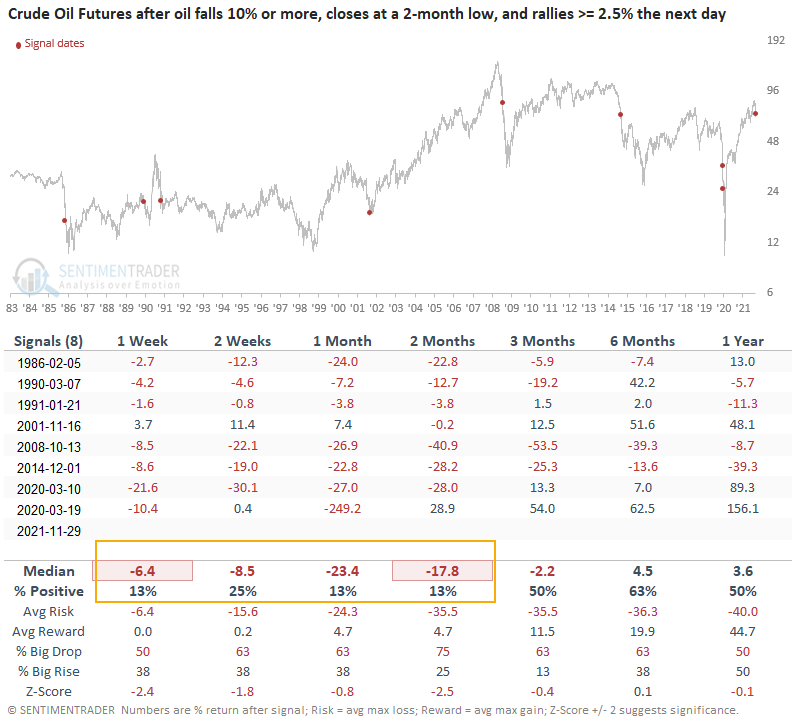
Let's assess the outlook for crude oil when the commodity falls 10% or more, closes at a 42-day low, and subsequently rallies 2.5% or more on the next trading day. I lowered the 1-day rate of change threshold to -10% to increase the sample size.
Similar signals preceded weak returns in the near term
This signal triggered 8 times over the past 36 years. After the others, future returns and win rates were weak in the short term with several unfavorable risk/reward profiles. And, several of the time frames showed a loss in 7 out of 8 instances. Every signal showed a loss either 1 or 2 months later.
What the research tells us...
Crude oil experienced a significant 1-day decline and multi-month low followed by a bounce. Similar setups to what we're seeing now have preceded weak returns and win rates in the near term, with every signal showing a loss between 4-8 weeks later.