Products
SentimenTrader Trading Tools
‍
Backtest Engine
My Trading Toolkit
Correlation Analysis
Seasonality
Indicators & Data API
‍
Proprietary Indicators & Charts
Market Data API
Strategies & Scanner
‍
50+ Trading Strategies
Smart Stock Scanner
Research Reports
‍
Research Solutions
Reports Library
Free Resources
Simple Backtest Calculator
Simple Seasonality Calculator
The Kelly Criterion Calculator
Sentiment Geo Map
Public Research Reports
Pricing
Company
About
In the News
Testimonials
Client Success Stories
Contact
Log inLoginSign up
< BACK TO ALL REPORTS

This is the 2nd Best Streak of Global Trends in 35 Years

Jason Goepfert
2021-08-12
For more than 7 months, every major world equity market has had a rising 200-day moving average.

It's been a heckuva year for the most benchmarked index in the world. And while some securities have been struggling (mostly of the smaller cap variety), the recovery in indexes has been a global phenomenon.

For more than 7 months now, every major world equity index that we follow has been in a solid long-term uptrend, with a rising 200-day moving average. Even the incredible momentum run in 2017 didn't see such pristine conditions, as there was usually at least one global index bucking the uptrend.

All country equity indexes with rising 200 day moving average

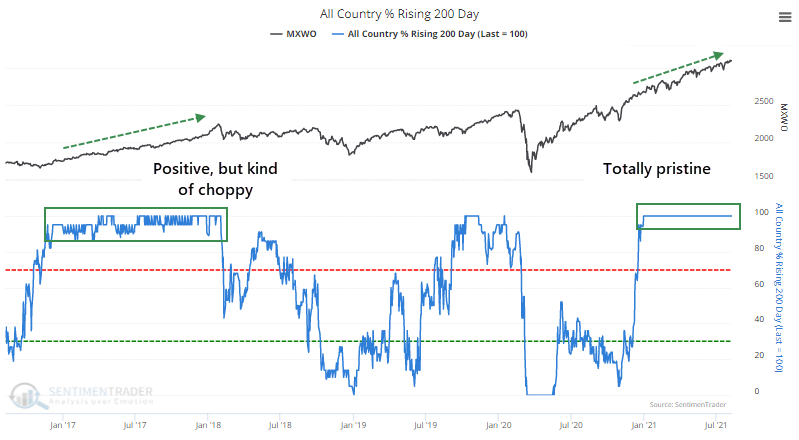
Over the past 50 years of data we have, this is now the 5th-longest streak of uninterrupted global uptrends and is creeping up on the longest in 35 years.

As we've seen with most momentum studies in recent months, there are few precedents.

The general pattern after the few times this occurred is shorter-term weakness but medium- to long-term strength. The MSCI World Index saw one double-digit pause following the 2009-10 recovery. The other three all saw consistent and impressive gains.

This has been a year like few others, and that has typically meant good things when viewed over a 6-12 month window.


What else we're looking at

  • Full returns in global markets after an uninterrupted string of uptrends
  • Financials are overbought...but not necessarily the bad kind of "overbought"
  • Using a simple trend-following method to outperform using the S&P 500 equal-weight index

Stat box

The S&P 500 has closed at a record high on 46 days so far in 2021. This is the 3rd fastest it has recorded so many new highs in a year. The only other years with more new highs before mid-August were 1964 and 1995.

Etcetera

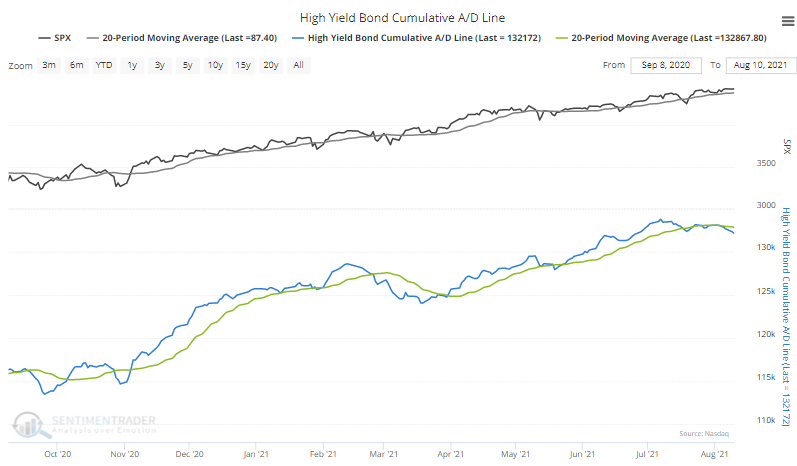
Bond warning. As the S&P 500 reaches record highs day after day, the Cumulative Advance/Decline Line for the high-yield bond market deteriorates and is below its 20-day moving average.

high yield bond advance decline line

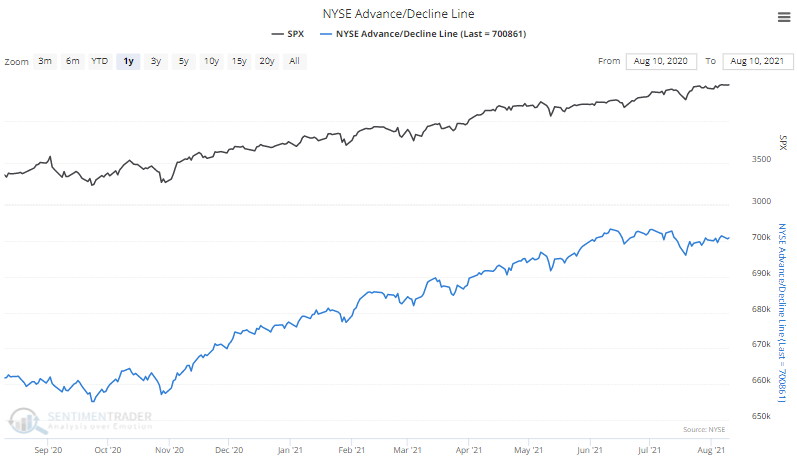
It's spreading. While not as extreme as for high-yield bonds, the A/D Line for securities traded on the NYSE is also having trouble keeping up with the S&P for the first time in over a year.

nyse advance decline line

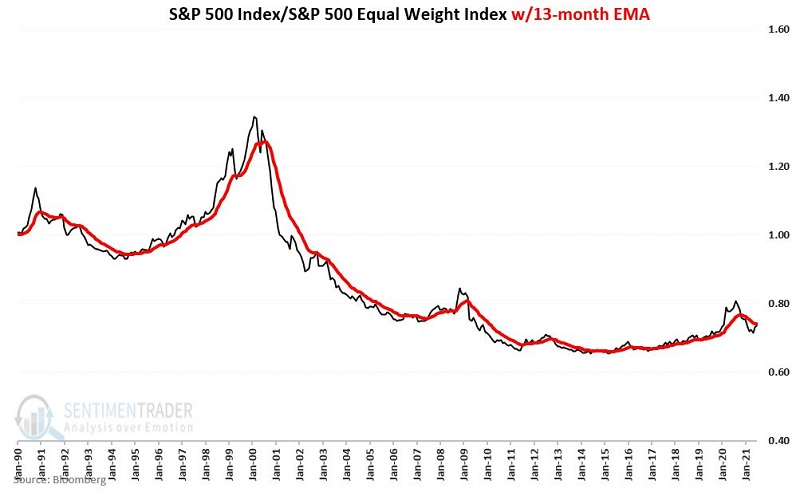
Gaining weight. Jay notes that the ratio of the capitalization-weighted S&P 500 to the equal-weighted version is close to crossing above its 13-month exponential moving average. This has important implications for future returns.

s&p 500 cap versus equal weight index

PRODUCTS
SentimenTrader
Trading Tools
Indicators & Data API
‍
Strategies & Scanner
‍
Research Reports
FREE
RESOUrCES
Simple Backtest
Calculator
Simple Seasonality
Calculator
The Kelly Criterion
Calculator
Sentiment Geo Map
‍
Public Research Reports
‍
Pricing
Bundle pricing
‍
Announcements
‍
FAQ
COMPANY
‍
About
‍
In the News
‍
Testimonials
‍
Client Success Stories
CONTACT
‍
General Inquiries
‍
Media Inquiries
‍
Financial Professionals Inquiries
‍
© 2025 Sundial Capital Research Inc. All rights reserved.
Setsail Marketing
TermsPrivacyAffiliate Program
Risk Disclosure: Futures and forex trading contains substantial risk and is not for every investor. An investor could potentially lose all or more than the initial investment. Risk capital is money that can be lost without jeopardizing ones’ financial security or life style. Only risk capital should be used for trading and only those with sufficient risk capital should consider trading. Past performance is not necessarily indicative of future results.

Hypothetical Performance Disclosure: Hypothetical performance results have many inherent limitations, some of which are described below. No representation is being made that any account will or is likely to achieve profits or losses similar to those shown; in fact, there are frequently sharp differences between hypothetical performance results and the actual results subsequently achieved by any particular trading program. One of the limitations of hypothetical performance results is that they are generally prepared with the benefit of hindsight. In addition, hypothetical trading does not involve financial risk, and no hypothetical trading record can completely account for the impact of financial risk of actual trading. for example, the ability to withstand losses or to adhere to a particular trading program in spite of trading losses are material points which can also adversely affect actual trading results. There are numerous other factors related to the markets in general or to the implementation of any specific trading program which cannot be fully accounted for in the preparation of hypothetical performance results and all which can adversely affect trading results.

Testimonial Disclosure: Testimonials appearing on this website may not be representative of other clients or customers and is not a guarantee of future performance or success.