
This shows trouble brewing under the surface of Big Tech

Trouble under the surface of the Nasdaq 100
Last week, we saw an impressive thrust in buying interest among a broad swath of stocks. That kind of behavior has been almost universally positive for future returns, and those are among the most consistent signals we study.
Not all is hunky-dory. Among the primary drivers of sentiment has been the resilience of American Big Tech, and many of them are stumbling. Not the companies that grab all the headlines; it's the smaller stocks that make up the rest of the Nasdaq 100 (NDX).
Within the NDX, there has been a protracted divergence that's getting more profound. Fewer than 65% of NDX stocks are currently trading above their 200-day moving averages. That is a stark change from a year ago when internal trends improved as the NDX marched steadily higher. The index is still doing its thing, but there have been fewer and fewer participants on each successive peak since the summer.
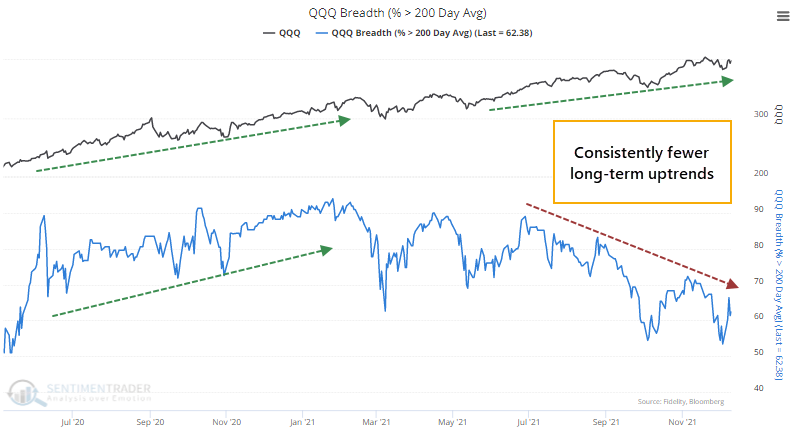
When we zoom out over the past 20 years, we can see that there have been 4 relatively similar periods. All preceded a tough market for the index over the next year or so.
Relying on one measure can give a skewed picture. Looking at other views of what's going on under the surface confirms disagreement between the index and many of its stocks.
While breadth thrusts are among the most consistent signals, divergences are among the least consistent - especially in 2021. So, we'd tend to place more weight on the positive signs recorded last week than the negative ones in specific sectors, including many of the tech stocks in the Nasdaq 100.

| Stat box Traders bought the dip on Monday, flooding the SPY fund with more than $6 billion despite a down day. That's only the 8th time in the fund's history it took in more than $6 billion on a down day. |
Risk-on as global stocks continue to underperform
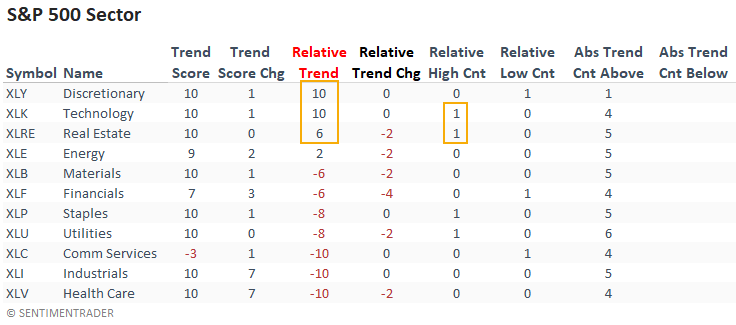
Dean showed that the technology and consumer discretionary sectors maintain perfect absolute and relative trend scores. And, technology is the only sector with an offensive tilt to register a new relative high last week. Real estate showed a modest decline on a relative basis. However, the sector continues to exhibit healthy trends.
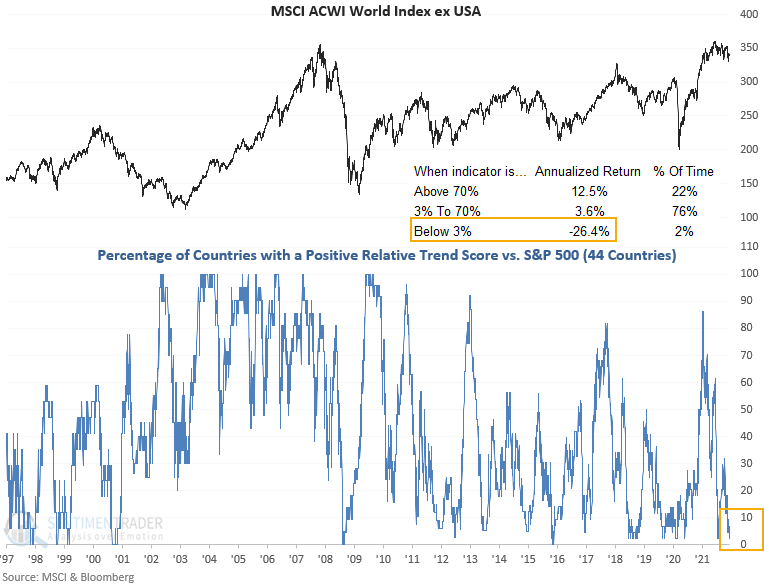
The percentage of countries with a positive relative trend score versus the S&P 500 declined to the lowest level since July. When country ETFs underperform to this extent, annualized returns for a broad-based global equity allocation are unfavorable.

Gold stocks' positive window
Most of us are aware that stocks have a seasonal tailwind around this time of year. Jay pointed out that less known is that gold-related stocks have enjoyed consistent gains, as well.
As a proxy, we will use the Fidelity Select Gold fund (FSAGX). Per Fidelity:
Investing primarily in companies engaged in exploration, mining, processing, or dealing in gold, or to a lesser degree, in silver, platinum, diamonds, or other precious metals and minerals. Normally investing at least 80% of assets in securities of companies principally engaged in gold-related activities, and in gold bullion or coins.
The chart below shows the cumulative growth in FSAGX only during these seasonal windows since 2000.
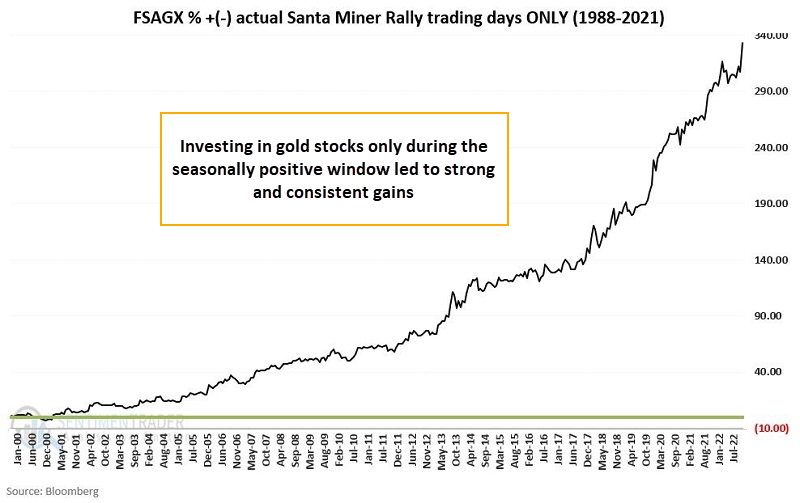
When we look at the year-by-year results, we can see that 30 out of 33 years were winners or flat, with the losses being relative small compared to the average gain. The last 14 years were all winners.
