Products
SentimenTrader Trading Tools
‍
Backtest Engine
My Trading Toolkit
Correlation Analysis
Seasonality
Indicators & Data API
‍
Proprietary Indicators & Charts
Market Data API
Strategies & Scanner
‍
50+ Trading Strategies
Smart Stock Scanner
Research Reports
‍
Research Solutions
Reports Library
Free Resources
Simple Backtest Calculator
Simple Seasonality Calculator
The Kelly Criterion Calculator
Sentiment Geo Map
Public Research Reports
Pricing
Company
About
In the News
Testimonials
Client Success Stories
Contact
Log inLoginSign up
< BACK TO ALL REPORTS

This year is just like...1963?

Jason Goepfert
2021-05-05
With a steadily rising market, 2021 is shaping up to be like 2013 and 2017, but there have been other years with an even closer analog.

Through the first 4 months of the year, stocks have barely suffered any downside volatility. This seems like 2013 or 2017, two other recent years that were marvelous for trend followers and miserable for pretty much every other strategy. 

2021 versus 2013 and 2017

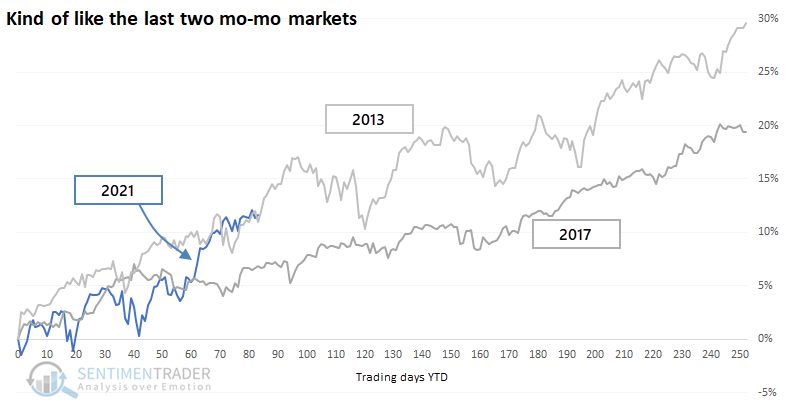
Buying momentum to start the year has rolled over just about every mean-reversion strategy in 2021, and it's tempting to pick a year that seems similar based on eyeballing a chart. We prefer to take a more objective approach using as much data as possible.

Using that discipline, we can go back nearly 100 years and look for every 4-month (84 trading-day) start to the year. We'll then filter the years, looking only at those that showed the highest correlation. There were 19 years with a correlation of more than +0.75 (on a scale of -1.0 to +1.0). 

The 4 most recent years that made the cut are shown below.

Most correlated S&P 500 analogs

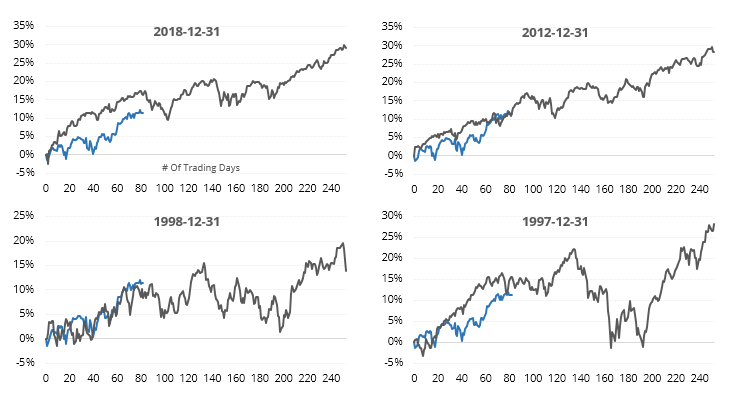
Once the years got to about this point, they tended to plateau into the summer months before picking up again in the fall. The overall trend was still up and to the right.

Most of them tended to see some exhaustion about now, or if they did see a further push, gave it back in the month(s) ahead. There were only 2 real exceptions in the past 50 years. 

Stat Box

Nearly 60% of technology stocks fell to a 1-month low on Tuesday, despite major tech indexes being above their rising 200-day moving averages. According to our Backtest Engine over the past 20 years, this has happened 44 times, leading to a positive return a month later after 34 of them, as most didn't turn into larger declines.


What else we're looking at

  • What the average price path of the most-correlated years looks like
  • Detailed future returns after the most-correlated years through April
  • Another challenge is summer returns when optimism is high
  • Taking a look at the "April barometer"
  • An update on a high-yield and investment-grade bond timing model
PRODUCTS
SentimenTrader
Trading Tools
Indicators & Data API
‍
Strategies & Scanner
‍
Research Reports
FREE
RESOUrCES
Simple Backtest
Calculator
Simple Seasonality
Calculator
The Kelly Criterion
Calculator
Sentiment Geo Map
‍
Public Research Reports
‍
Pricing
Bundle pricing
‍
Announcements
‍
FAQ
COMPANY
‍
About
‍
In the News
‍
Testimonials
‍
Client Success Stories
CONTACT
‍
General Inquiries
‍
Media Inquiries
‍
Financial Professionals Inquiries
‍
© 2025 Sundial Capital Research Inc. All rights reserved.
Setsail Marketing
TermsPrivacyAffiliate Program
Risk Disclosure: Futures and forex trading contains substantial risk and is not for every investor. An investor could potentially lose all or more than the initial investment. Risk capital is money that can be lost without jeopardizing ones’ financial security or life style. Only risk capital should be used for trading and only those with sufficient risk capital should consider trading. Past performance is not necessarily indicative of future results.

Hypothetical Performance Disclosure: Hypothetical performance results have many inherent limitations, some of which are described below. No representation is being made that any account will or is likely to achieve profits or losses similar to those shown; in fact, there are frequently sharp differences between hypothetical performance results and the actual results subsequently achieved by any particular trading program. One of the limitations of hypothetical performance results is that they are generally prepared with the benefit of hindsight. In addition, hypothetical trading does not involve financial risk, and no hypothetical trading record can completely account for the impact of financial risk of actual trading. for example, the ability to withstand losses or to adhere to a particular trading program in spite of trading losses are material points which can also adversely affect actual trading results. There are numerous other factors related to the markets in general or to the implementation of any specific trading program which cannot be fully accounted for in the preparation of hypothetical performance results and all which can adversely affect trading results.

Testimonial Disclosure: Testimonials appearing on this website may not be representative of other clients or customers and is not a guarantee of future performance or success.