
Thursday Color - Bond Jitters, Energy Stock Losses, AAII Bulls Jump, DAX Breakout; Dollar's 100-Day

Here's what's piquing my interest as an early rally is showing signs of reversal.
Bond Jitters
Stock investors often look at bond traders as their smarter, more sophisticated cousins. While there is some basis for that, it's more like a heuristic and less like a rule.
Because of this bias, divergences or oddities in the bond market often get a lot of attention. Sometimes it's justified; most of the time it's over-hyped.
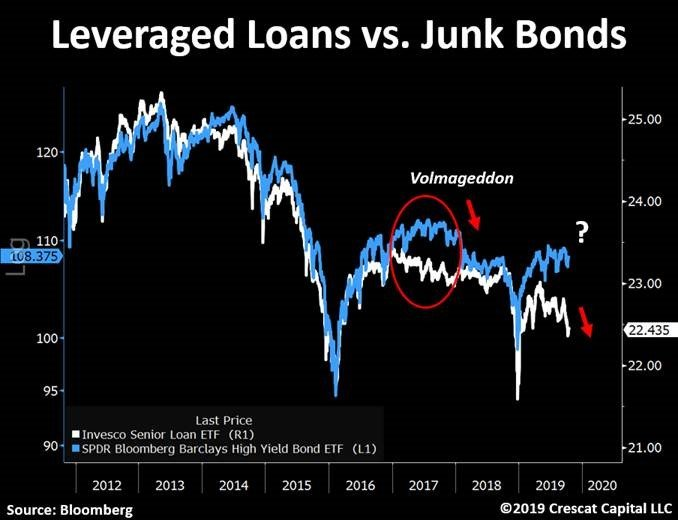
The other day we looked at faltering returns in junk bonds. But even they are out-performing other parts of the bond market, like leveraged loans. A tweet by Crescat Capital highlights the divergence between those parts of the market.
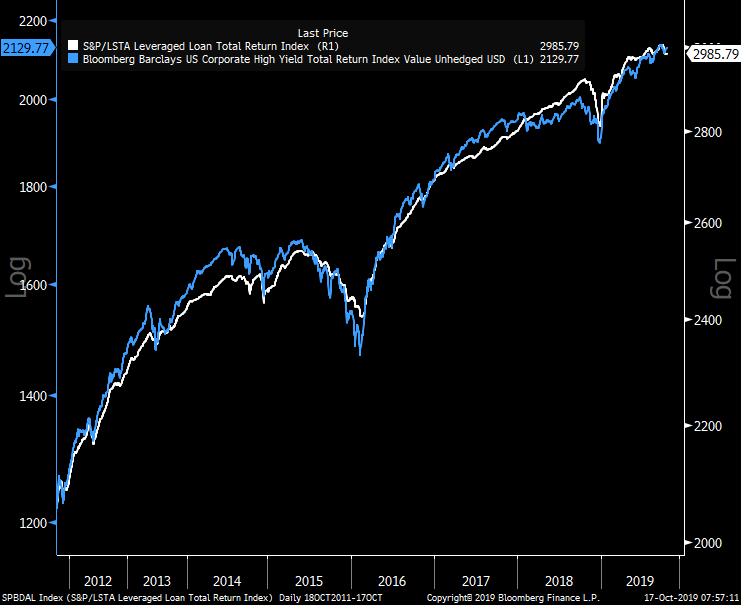
One of the larger dangers in looking at bond market indexes is that yield can make a big impact. The yield on leveraged loans is important, so when we look at the same indexes - but their TOTAL RETURN and not just their PRICE - the divergence looks a lot less threatening.
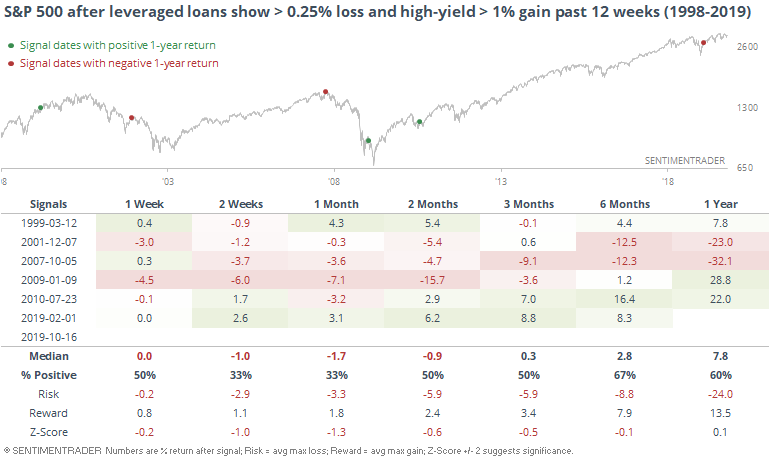
Still, charts can be deceiving which is why we prefer to focus on looking objectively at all dates instead of cherry-picking some examples. And when we look at it that way, we get the following.
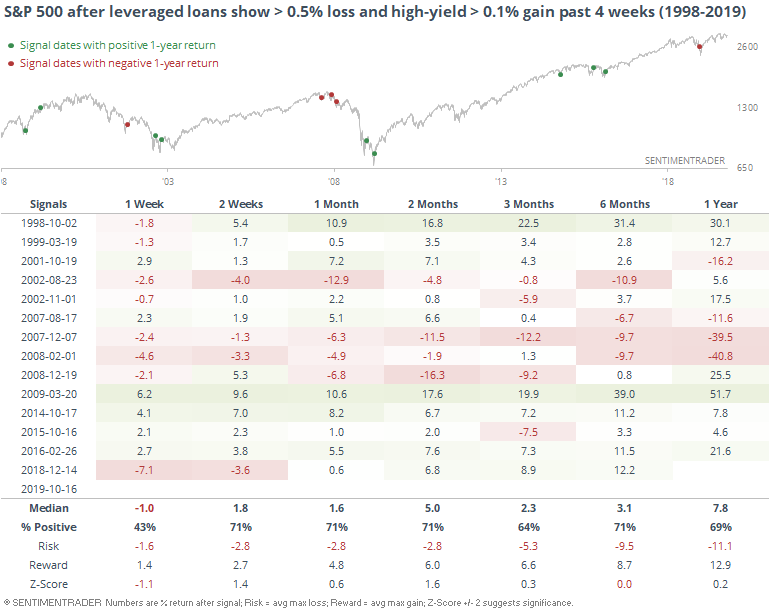
A lot of the losses for leveraged loans have come in just the past few weeks, so if we look at divergences on a shorter time frame, we get more instances.
This was certainly a good tip-off that something wicked this way comes in 2007-08, but other than that, proved to be mostly false warnings.
Losing Steam
The WSJ notes that energy stocks have been a consistent disappointment, especially considering that oil has mostly held steady in recent months.
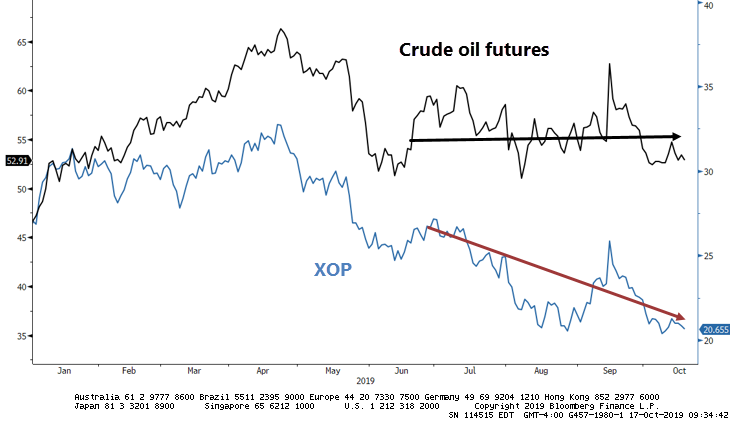
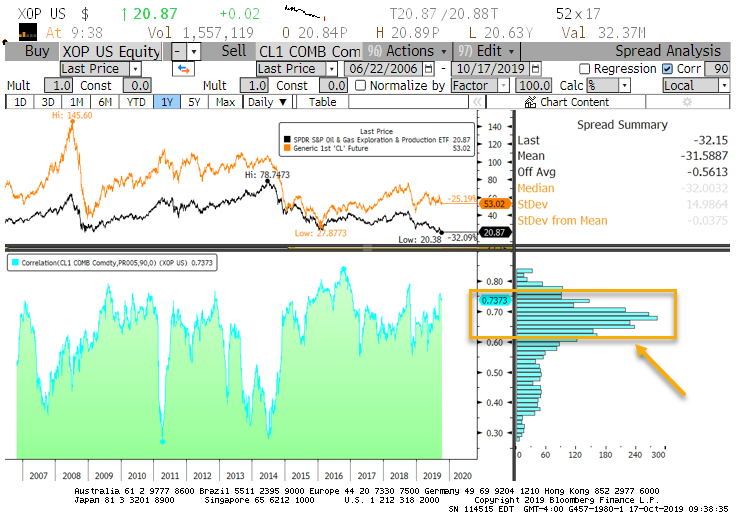
Historically, there is a tight positive correlation between oil and oil & gas producing stocks. For over a decade, the correlation has hung around the 0.7 level.
There isn't a lot of history, or precedent, but there have been 3 other times when oil & gas producers sunk more than 15% over a 90-day window and oil was up 5% or more during the same span.
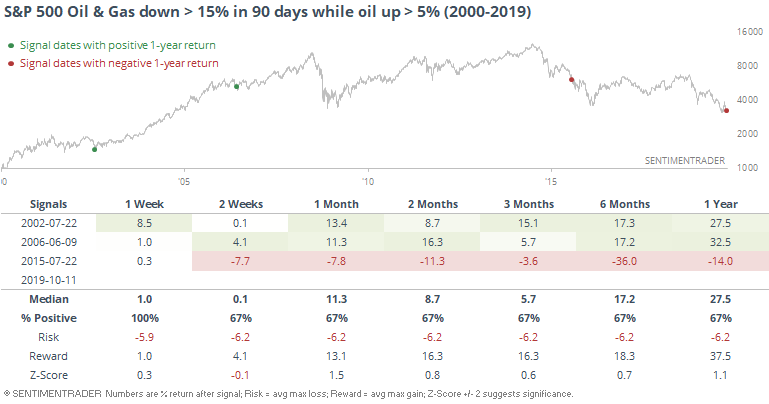
In 2002 and 2006, it about nailed the bottoms for those stocks. In 2015, it was several months too early.
The Dow Jones Oil & Gas index has more history, but it has also not under-performed so badly in recent months. Still, over a longer time horizon, 200 days, the index was recently down more than 10% while oil was up.
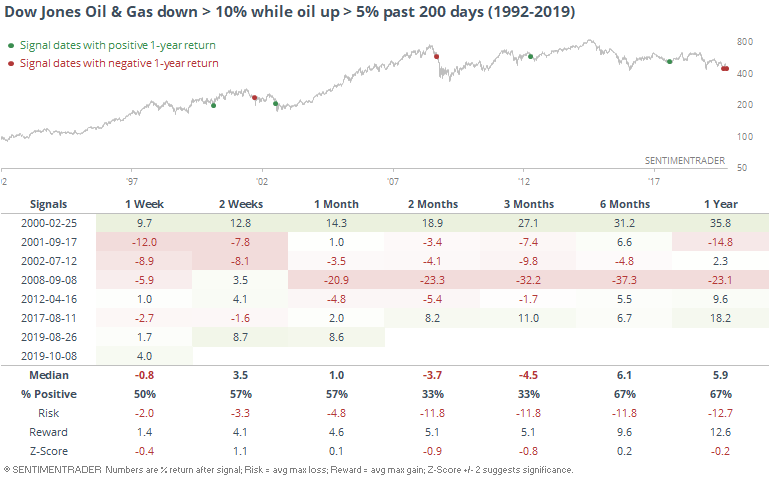
This was also a mixed picture for future returns, with a few large losses and few large gains. It was skewed toward the latter over the medium-term, but the former longer-term.
Back To Bullish
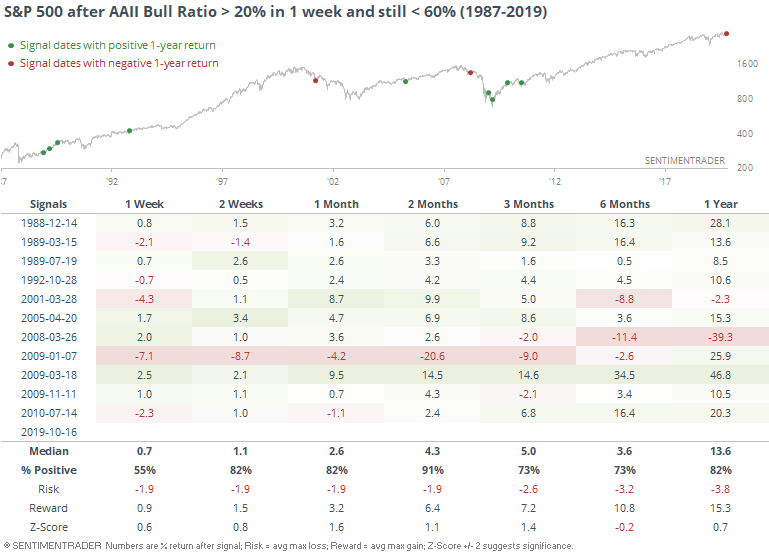
The noisy AAII survey of crabby old people has become even more noisy of late. The Bull Ratio jumped 20% in just the past week, but is still well below 60%.
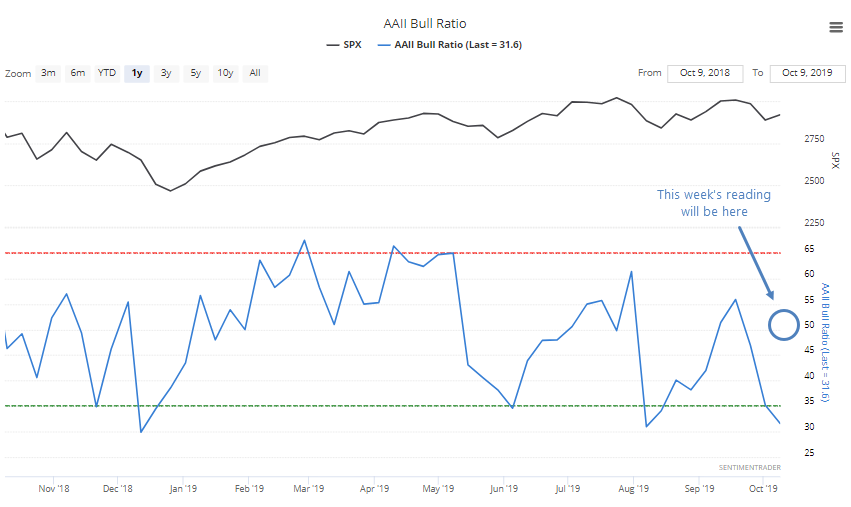
They have been especially negative in recent weeks so this is a bit of a change. There is a tendency to consider every wiggle in the survey as a contrary indicator, but it doesn't work well that way. When bullishness has spiked from a low level, it has usually resulted in further gains for stocks.
Resurgence
Late in the summer and earlier in the fall, we spent quite a bit of time going over historic oversold extremes in overseas markets, especially in Asia. Then we started to see thrusts off those lows in the stocks underlying some of those indexes.
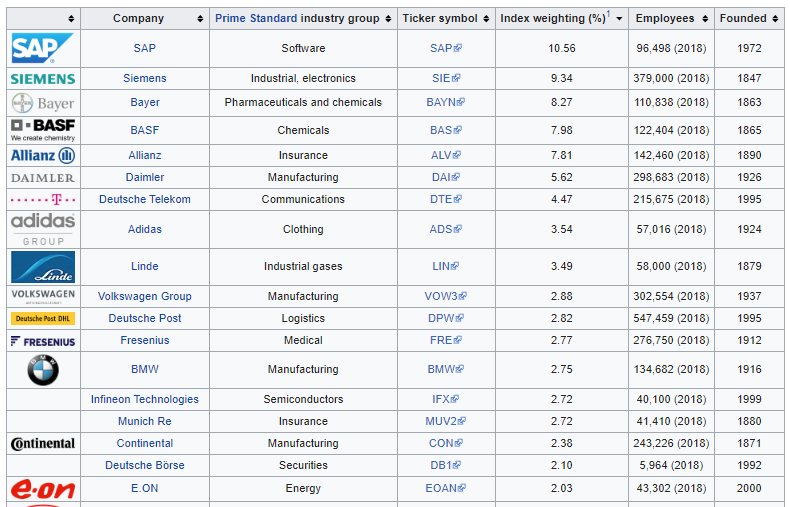
Troy noted this again today, as the percentage of Japanese stocks moving into uptrends has ended one of the longest streaks in downtrodden territory. It's not just the Nikkei. Other markets are showing renewed vigor, like the German DAX, where more than 93% of stocks have held above their 50-day averages. That's the most in years.
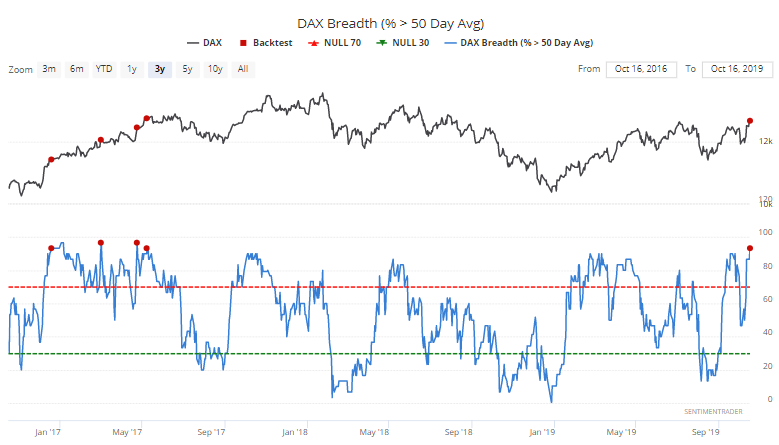
And it has been mostly a good sign for the index.
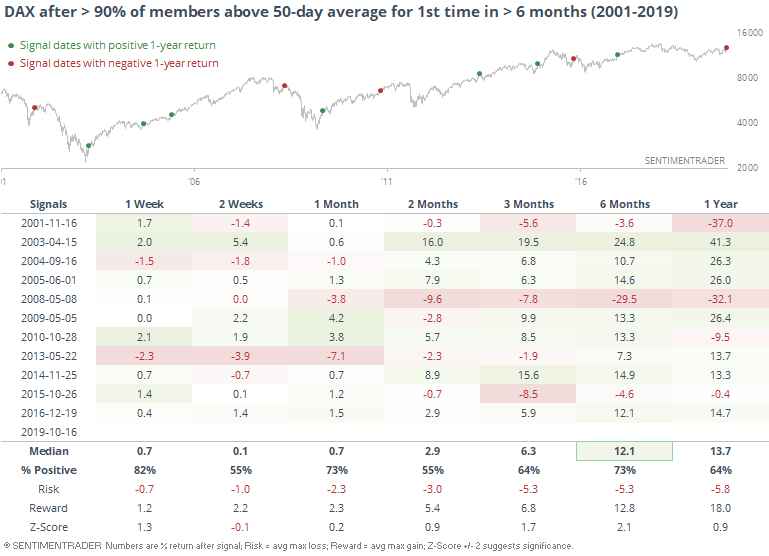
There were 3 relatively large losses over the next few months, but most of them led to further gains.
It might be taken as a good sign since the DAX is dominated by such a diverse group of companies, covering a broad swath of industries.
Dollar Troubles
When the U.S. dollar lost its medium-term trend by falling below its 50-day average, we saw at the time that it has usually led to further losses. It has continued to suffer, and has now lost its 100-day average for the first time in several months.
Below, we can see other times when the dollar had been at a 52-week high within the past month, then crossed below its 100-day average for the first time in at least 3 months.
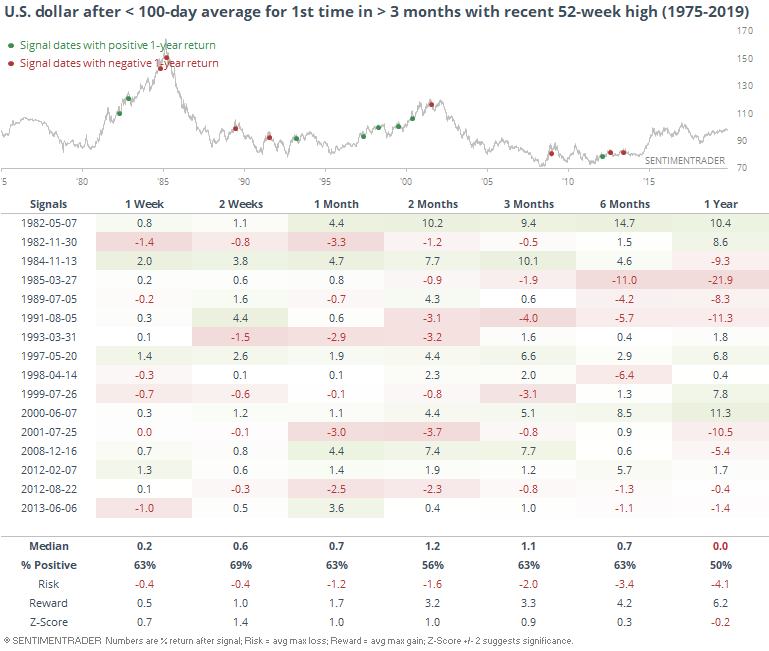
It wasn't a particularly bad sign, as several of them led to gains in the months ahead. That was mostly focused in the late 1990s.