Thursday Color - Momo rebound, AAII stagnant, sector breadth lag, MLP pessimism

Here's what's piquing my interest so far as stocks try to hold the latest trade optimism.
Momo Returns
Troy made a great point about the return of momentum stocks. Their plunge a few weeks ago freaked everyone out (without much historical support) but their recovery has got much less attention. That's how these things tend to work when it comes to investor sentiment - find a reason to panic, then ignore it when it doesn't come to pass and move on to the next headline.
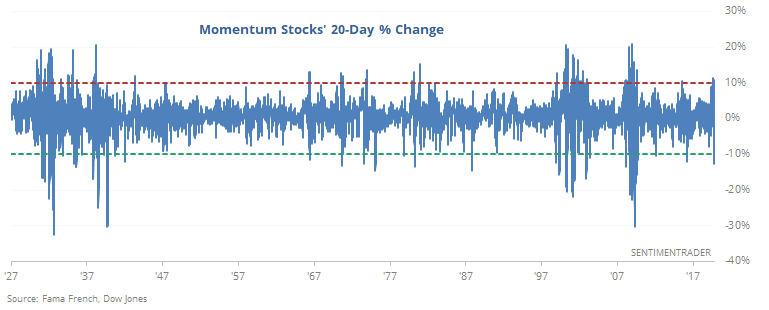
The de facto standard for momentum stocks is the Dow Jones index that Troy mentioned, though it doesn't have that much history. If we use factor data from Fama French, we can kind of re-create it going back a lot further. We can see that the recent swings over a 20-day window have still been extreme.
These swings tend to come around major inflection points - mostly near the ends of long-term downtrends, but that did not preclude some extreme volatility over the next few months.
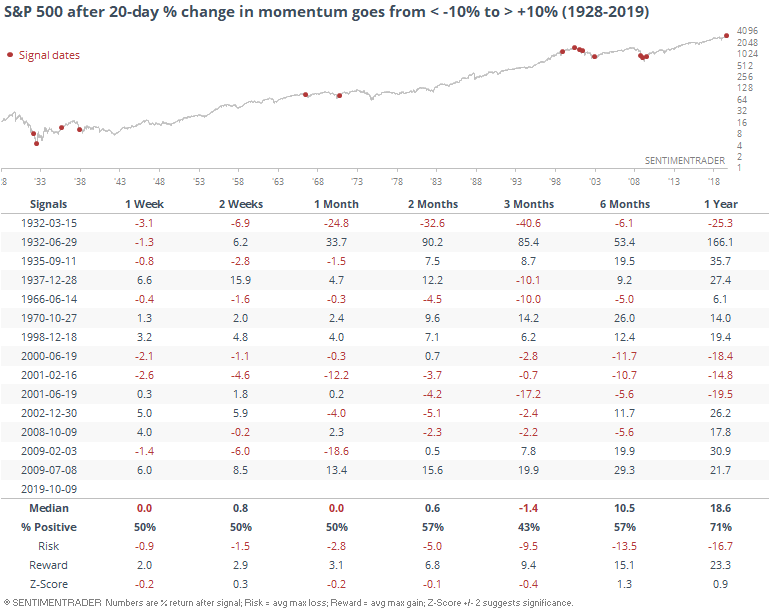
The risk/reward over the next 3 months was remarkable - an average of -9.5% risk versus +9.4% reward. Both are huge relative to what we normally see.
Still Crabby
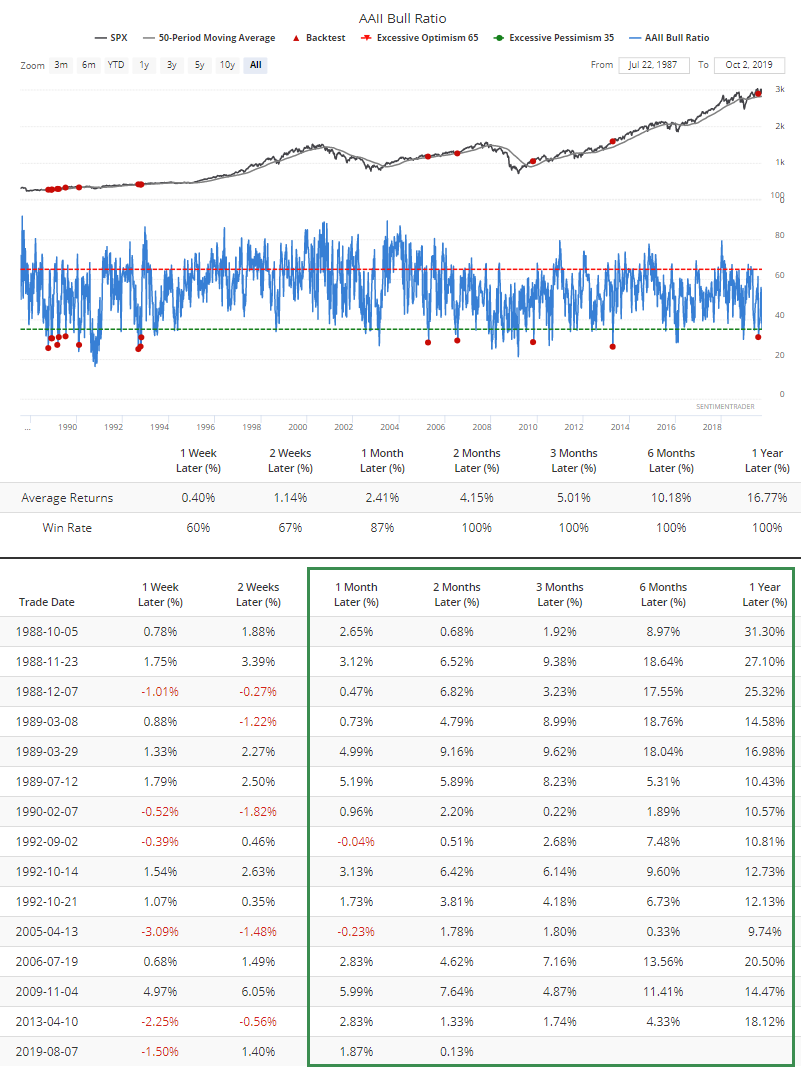
I don't want to spend much time on the latest readings in the AAII survey because it's just more of the same. They're still crabby, despite a market that's holding relatively firm.
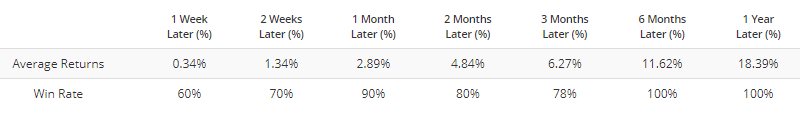
According to the Backtest Engine, when the Bull Ratio (Bulls / (Bulls + Bears)) falls to this low of a level and the S&P 500 is still above its 50-week moving average, returns over the next 1-12 months were essentially pristine.
To see this same test, just click this link and then the Run Backtest button. You can click the Multi-Timeframe Results tab to see the fully table.
If you want to see how the Nasdaq Composite, for example, did after similar setups, just click the "Index/ETF/Commodity" drop-down box and select COMP. That will replace SPX in the backtester, then just click the Run Backtest button again and it will re-run it using the Nasdaq.
It also did well going forward, by the way.
Sector Breadth
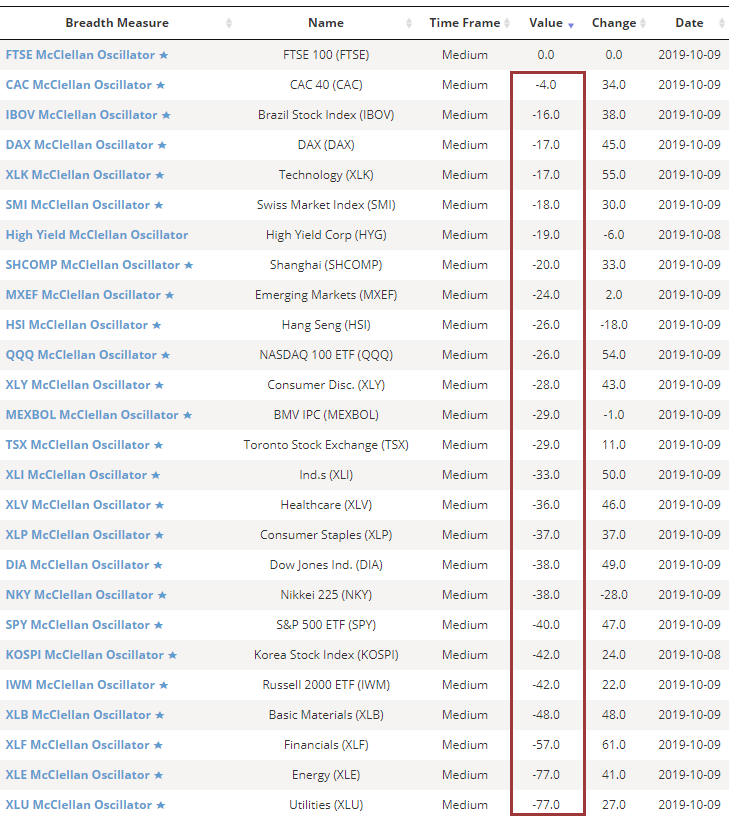
It's hard to find any momentum right now, despite the recovery in the Dow Jones Momentum index. Those specific stocks might be rebounding, but as a whole, the breadth underlying the stocks and indexes we follow are negative. All of them.
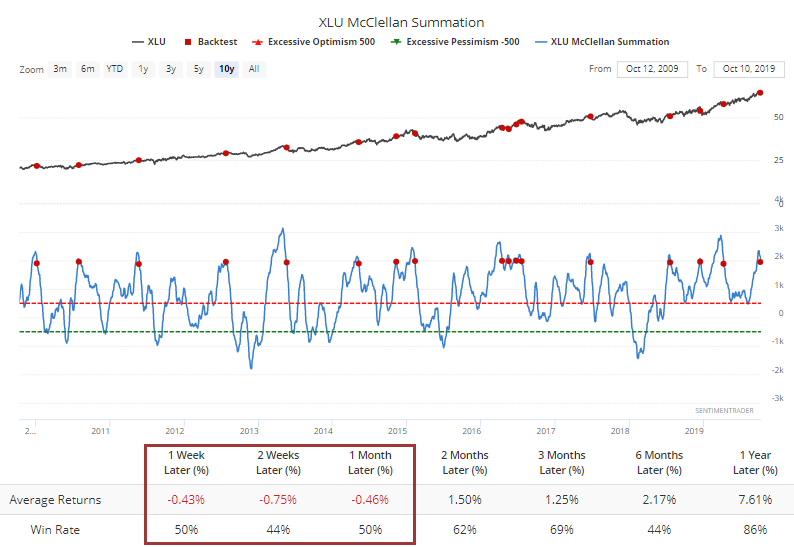
Even utilities have weakened. As usual, they weren't able to build on the big surge in momentum they'd enjoyed a few weeks ago. Now the McClellan Summation Index for that sector has curled over and dropped below the extreme level of +2000. Over the past decade, that has typically led to some further shorter-term losses.
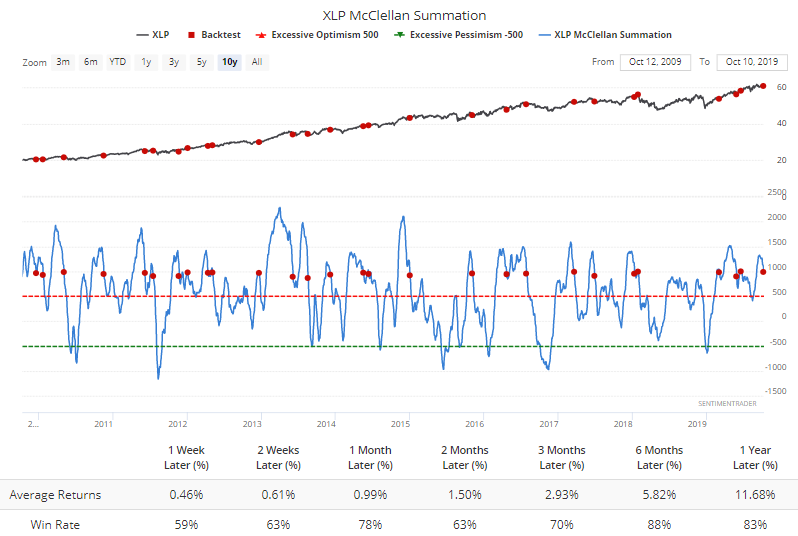
Staples, another defensive group, is also seeing its long-term breadth momentum roll over from a high level. That didn't lead to consistent weakness, but its shorter-term returns did tend to be pretty flat.
It's waning for high-yield bonds, too. It led to a negative expectation over the next couple of weeks, but wasn't terribly consistent.
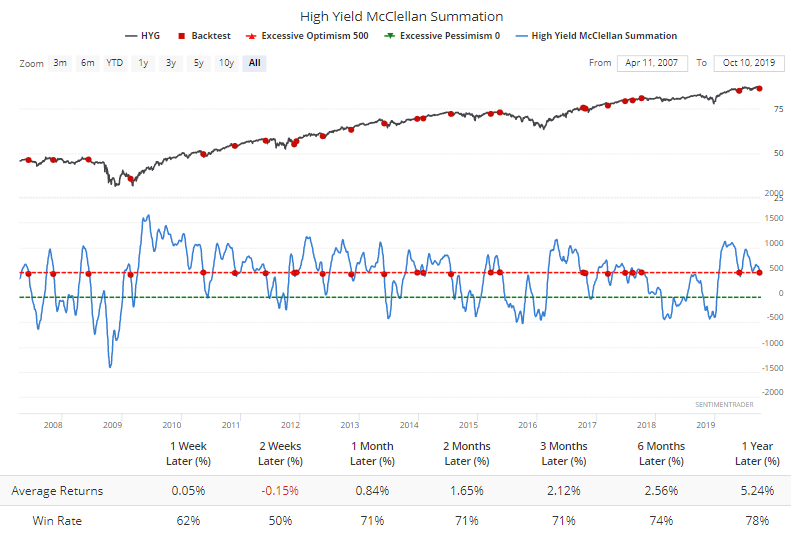
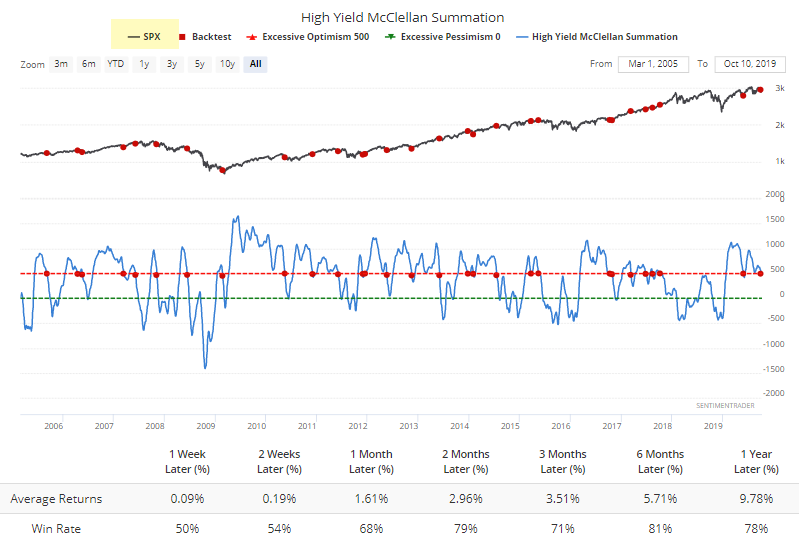
Here's how the S&P 500 fared when junk bond momentum waned. Not terrible, but not great shorter-term, either.
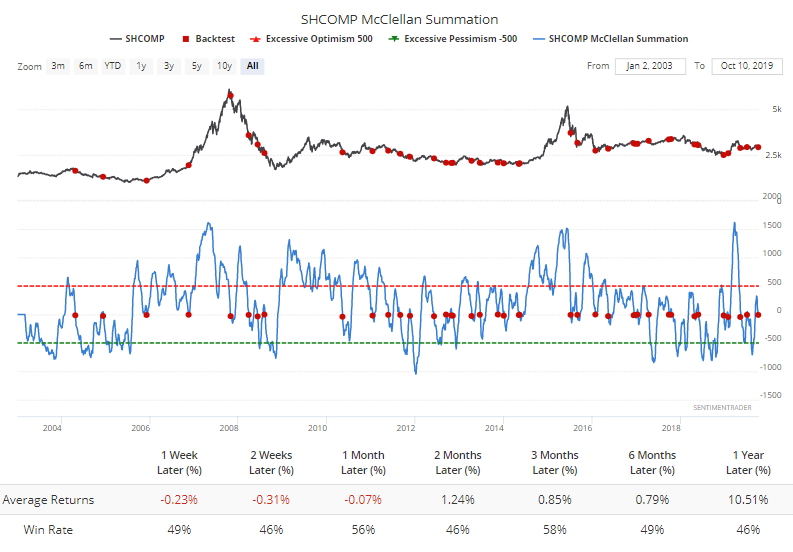
For the Shanghai Composite, it just turned outright negative. Not a great short-term sign there.
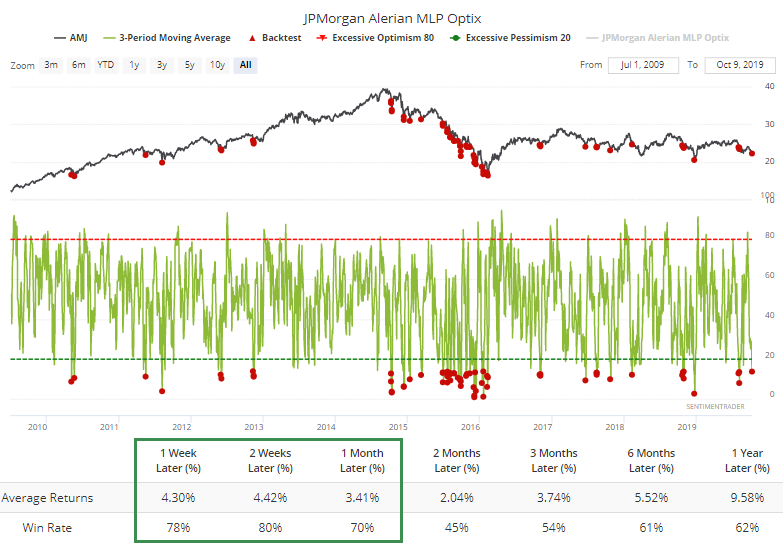
Bad Energy
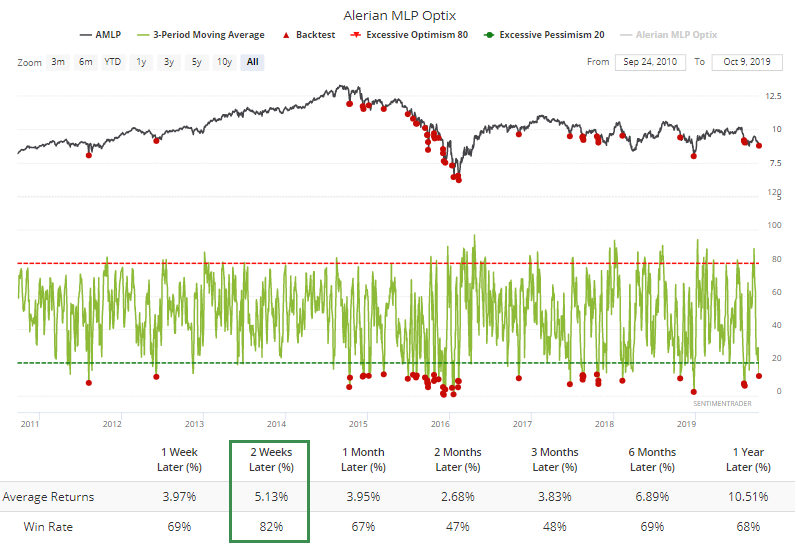
Among all the losses in energy-related shares, master limited partnerships have been among the worst performers, at least in terms of trying to sustain any bounces. They're now the most-hated corners of the market.
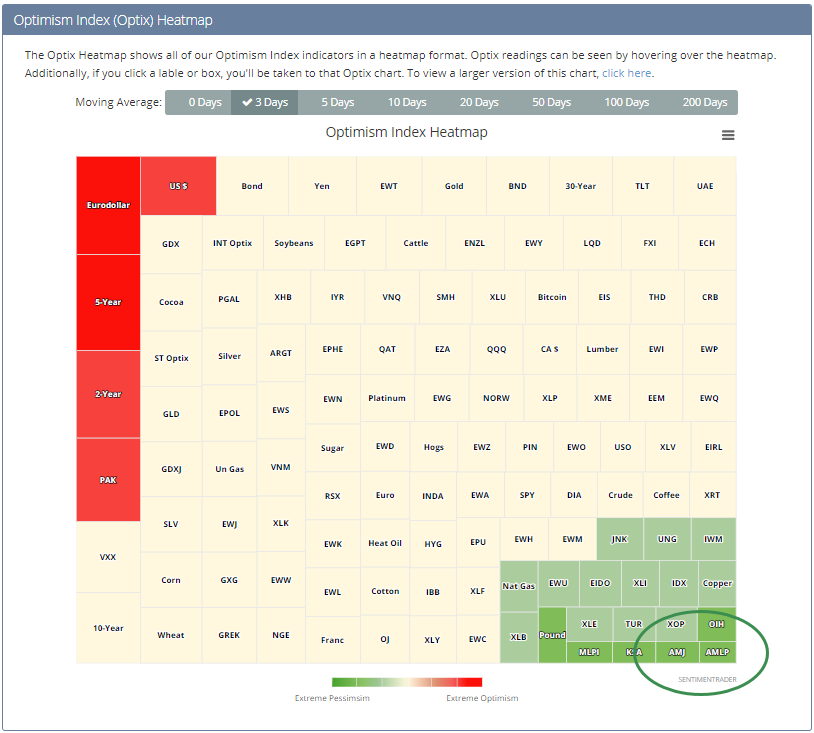
For the AMJ fund, its Optimism Index has averaged less than 14 over the past three days, something that led to a bounce over the next 2 weeks after 51 of the 64 weeks that triggered.
AMLP rebounded after 37 out of 45 signals.