Thursday Midday Color - Gap Fills, Bull Drops, Social Pessimists

Here's what's piquing my interest on this gap-fill day.
Closure
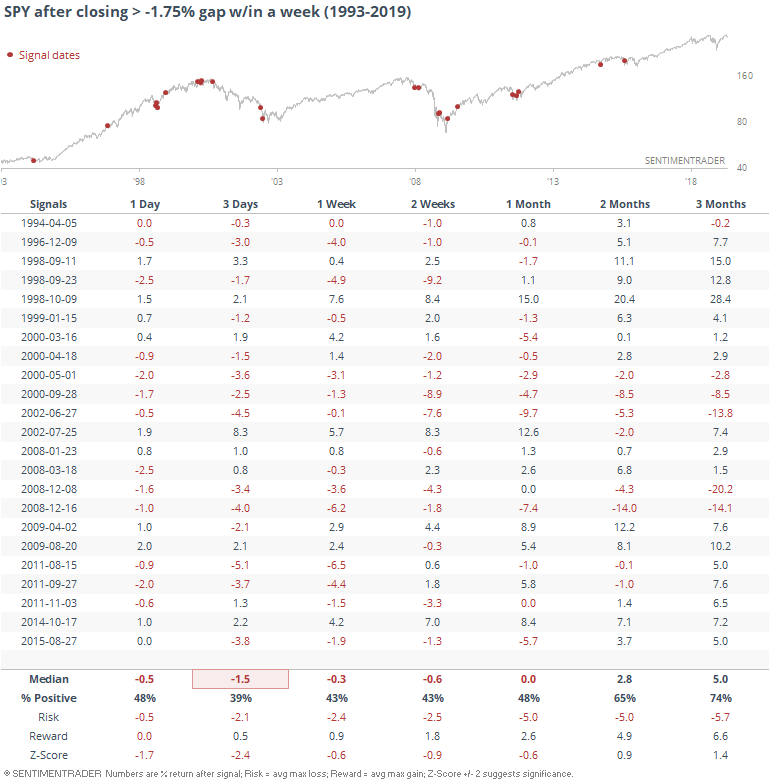
Buyers stepped in big-time and have pushed stocks above where they were before the large gap down on Monday. This is a quick turnaround - it usually takes longer for SPY to close a downside gap that large.
When it does so quickly, within a week, it has usually backed off over the next few sessions.
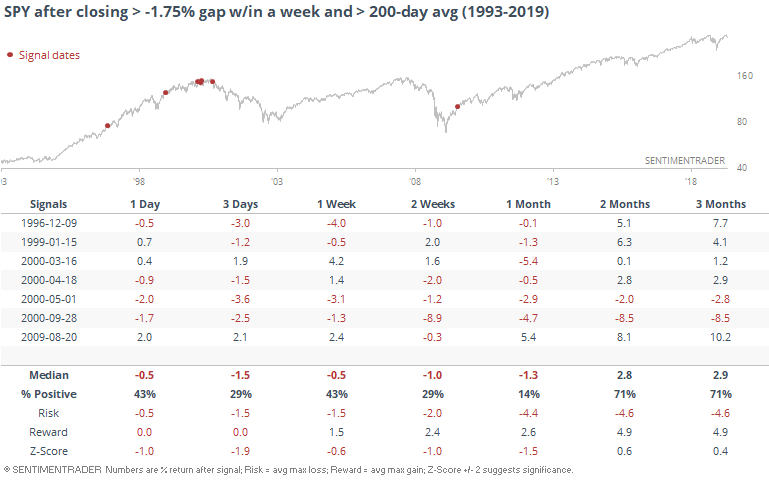
That's been the case even if - especially if - SPY was above its 200-day average at the time.
Few Bulls
The latest weekly survey of individual investors by AAII showed a pretty drastic drop in bulls and rise in bears. The Bull Ratio dropped below 44%, relatively low for a bull market.
That's been a good sign over the past 20 years.
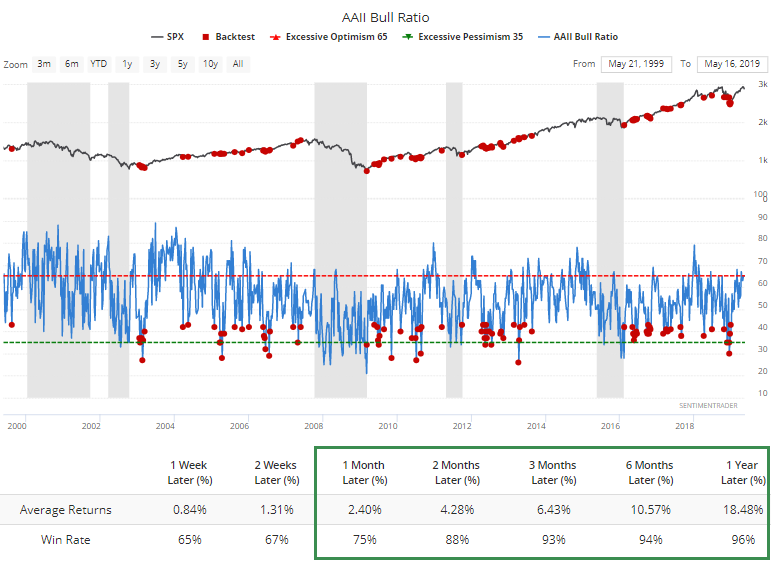
Here's how the S&P performed after the Bull Ratio was above 44%. A fairly large degradation in returns.
Returns across all time frames were more than double when the Bull Ratio was below 44% versus when it was above that level.
Breadth Review
With choppy price action in recent days, there aren't many notable extremes or developments in breadth. We've looked a lot lately at ebbing momentum, and how that has tended to be a good sign when coming from extreme and/or persistent levels.
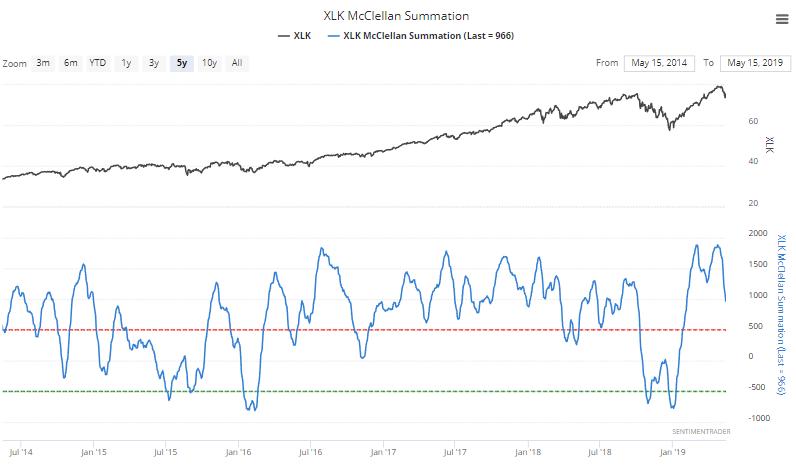
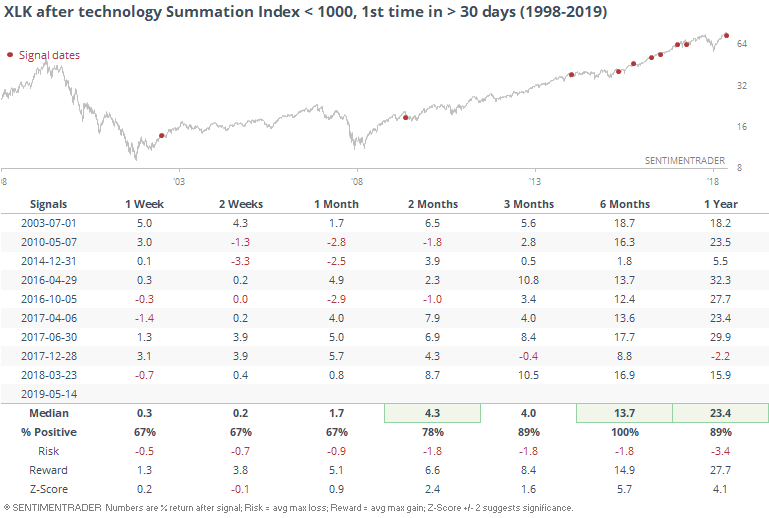
That's the case with technology, where the McClellan Summation just dropped below 1000 for the first time in more than 30 days.
Once again, this has led to good forward returns, especially over the medium- to long-term. Six months later, XLK was higher every time, with abnormally positive average returns and risk/reward ratios.
Socially Inept
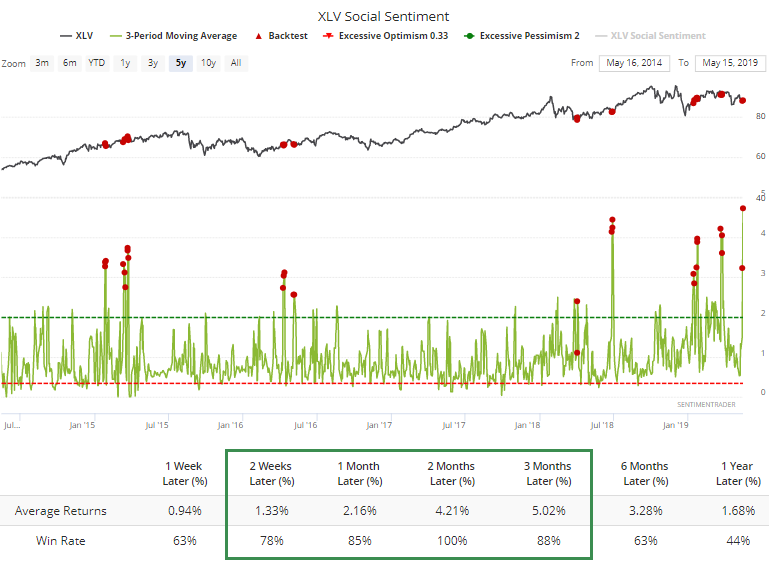
Twitter users are not happy about health care. Or at least, how the stocks have been performing. Over the past three days, Social Sentiment on XLV has skewed heavily toward negativity. The higher our Social Sentiment score, the more negative the tweets (it's like a put/call ratio in that sense).
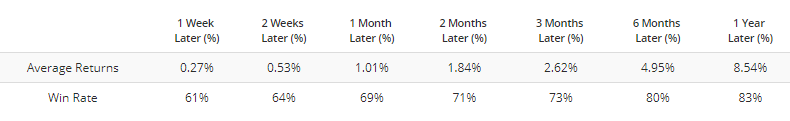
For XLV, the 3-day average score has soared above 4.5, a record high. When it's been above 2.5 over the past five years, XLV has done well.
Contrast that to times when Social Sentiment was below 0.5 (twice as many bullish tweets as bearish ones).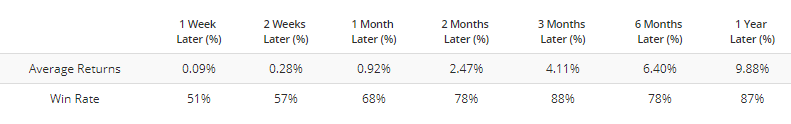
Returns were still positive (the fund was in a nice bull market, after all) but were significantly below where they were when Twitter users were more negative. It's questionable to base on investment on the fickle nature of social media users, but this looks to be a tailwind for the fund.
Social Sentiment is souring on some of the previous metals funds, too. The percentage of bullish tweets on SLV has dropped to 5%, which is very low. The fund has been an extremely poor performer over the years, so future returns were still negative in spite of very low optimism.
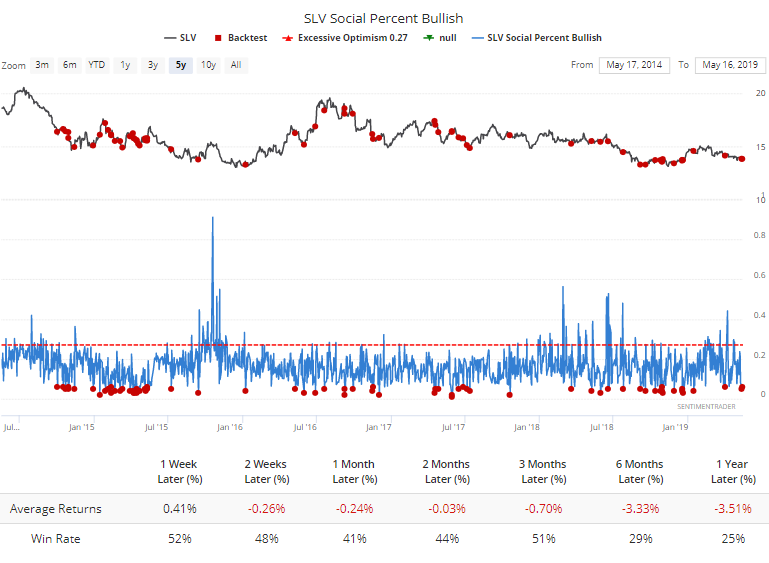
What's interesting is just how much worse the returns were when more than 25% of tweets were bullish.
Over the next 3 months, SLV returned an average of -0.7% and was positive more than half the time when Social Sentiment was very low, versus -5.6% and 22% win rate when it was very high.
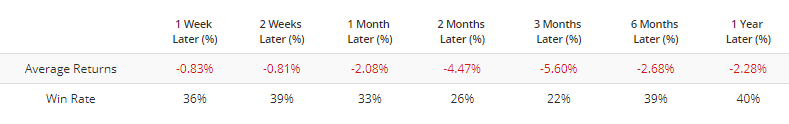
Same goes for the Junior Gold Miners fund, GDXJ, which is also seeing very low optimism among Twitter users right now.
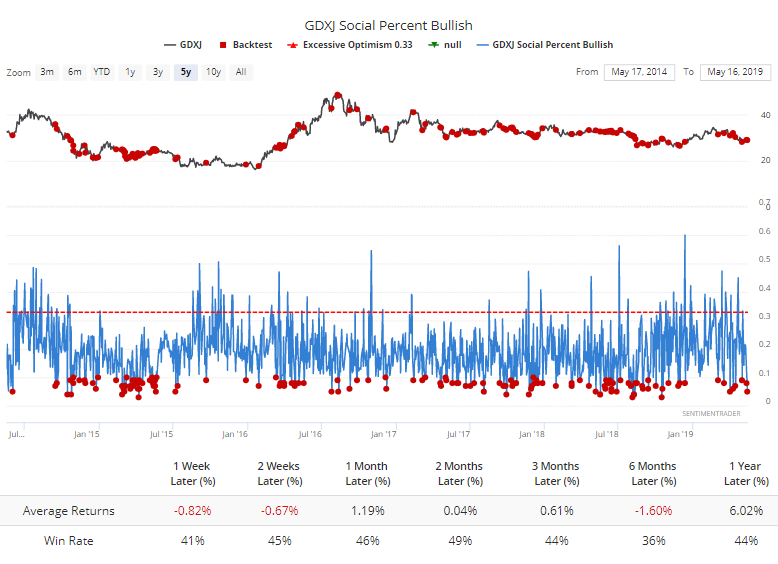
Again, the returns aren't very good, but quite a bit better over the next 1-3 months than when social folks were very bullish.
Careful
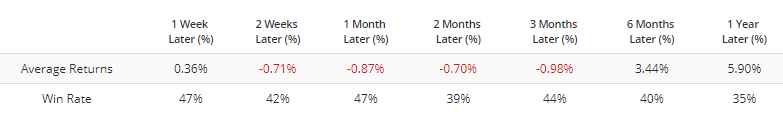
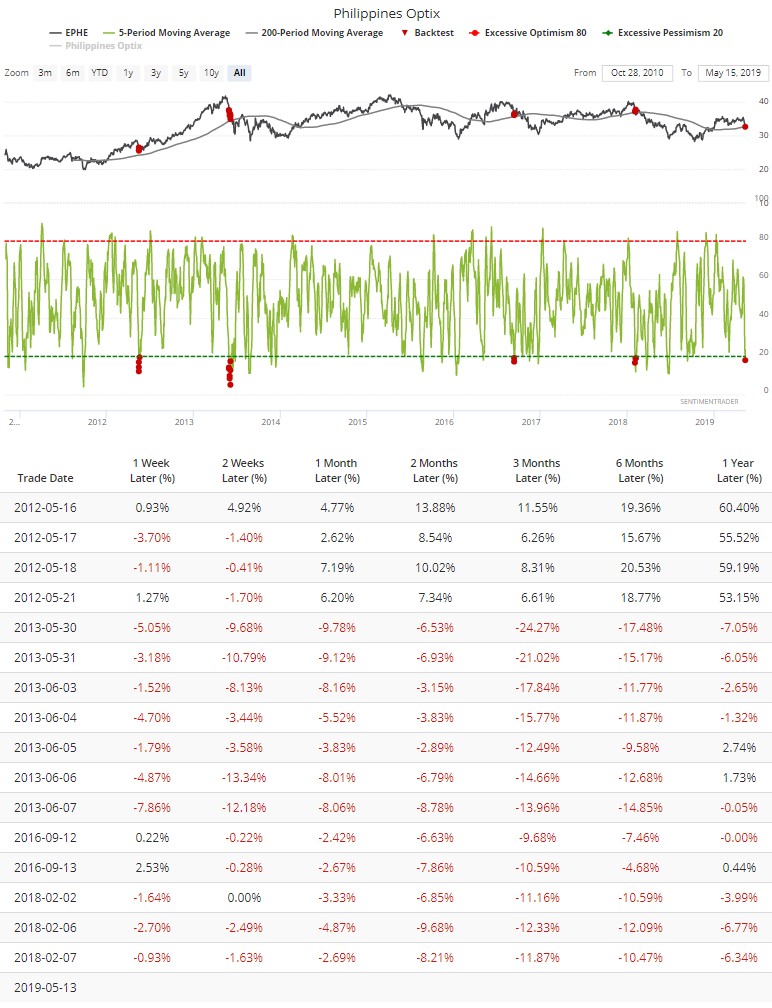
The Sentiment & Trend screen shows a few funds that are seeing pessimism despite being in long-term uptrends. One of those is the EPHE fund focused on Philippine stocks. The 5-day average Optimism Index recently dropped below 20, showing extreme short-term pessimism, even while the fund held above its 200-day average.
This is where the Backtest Engine comes in so handy. Investors in different markets act differently at extremes. In some (most) markets, this kind of activity would be a buy signal. In EPHE, not so much. In 2012, buyers stepped in right away and that led to excellent longer-term returns. But the three other times it triggered, buyers were more hesitant, and it preceded large longer-term losses.
Watching how traders react to the latest extreme should provide a clue for longer-term investors.
Flow
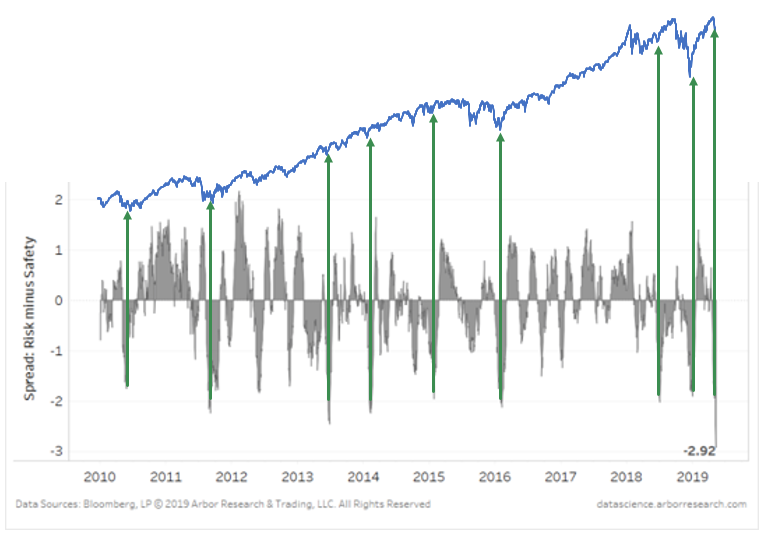
In yesterday's Daily Report we saw that traders have been fleeing index, sector, and country ETFs. The WSJ, via Arbor Research, notes that it's not just equity funds but groups of "risk on" funds that have suffered outflows. That's especially the case relative to inflows to "risk off" funds like Treasuries and utilities.
If we superimpose the Arbor chart against the S&P 500, we can see that large difference in flows between risk-on and risk-off funds have been a decent contrary indicator, suggesting it's a positive now.