Thursday Midday Color

Here's what's piquing my interest so far today.
Crude Recovery
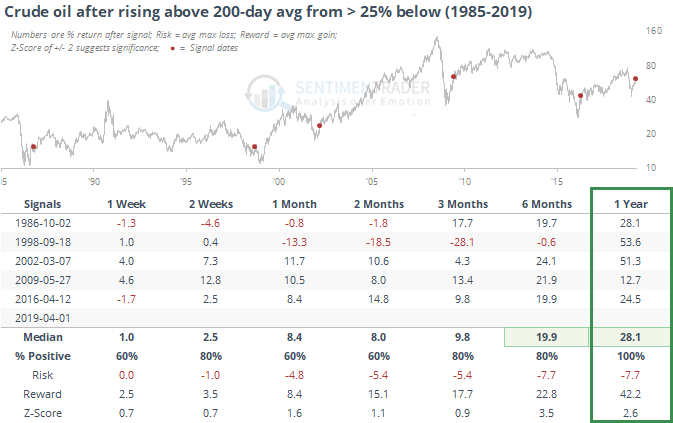
The WSJ notes that crude oil has finally managed to recover above its 200-day average after a long period below. At its depths, it was more than 30% below its average, a truly severe decline.
When it has closed above its average after being more than 25% below, it has continued to gain most of the gain across most time frames. The one-year returns were especially positive, and consistently so.
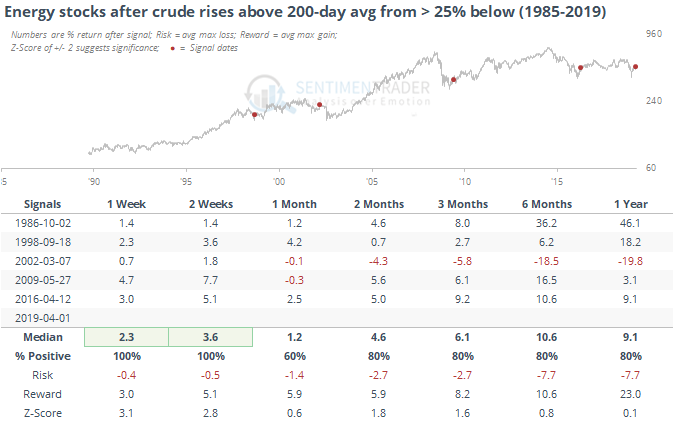
That has been a good sign for energy stocks, as well, except for in 2002 (data prior to 1990 is energy-sector returns from Fama French, after 1990 is S&P 500 Energy sector).
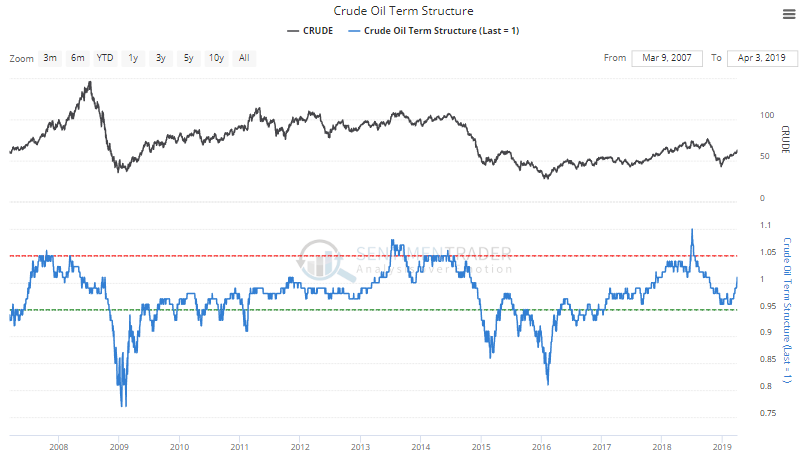
The decline had pushed the crude oil curve into contango, which is also recovering, and that also tends to be a good sign.
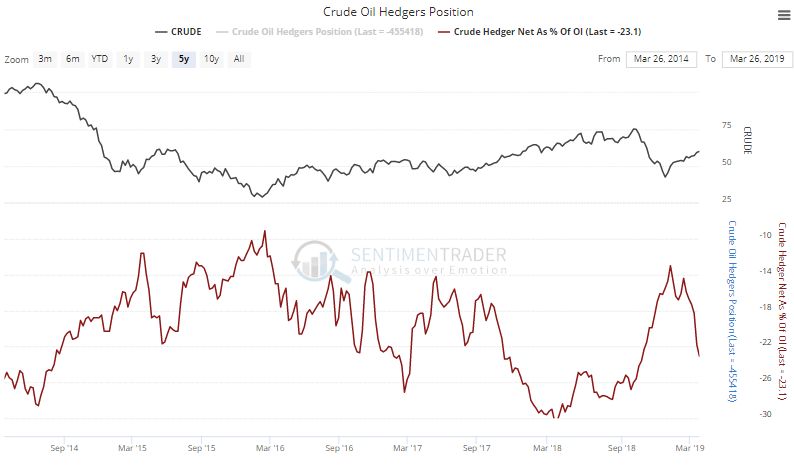
"Smart money" hedgers have been selling into the rally, as they typically do. They're holding 23% of the open interest net short, which is in the middle of their 5-year range and not saying much at the moment. This data has worked less well in crude oil than most other commodities, but it would still be a worry if they sold much more aggressively in the weeks ahead.
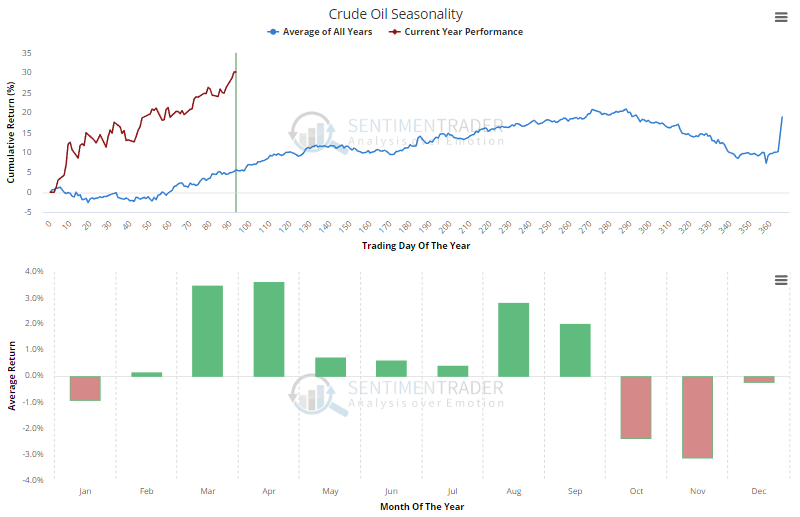
The spring and summer driving months tend to be strong for oil, but it has bucked its seasonal pattern already during the first couple of months.
Breadth Review
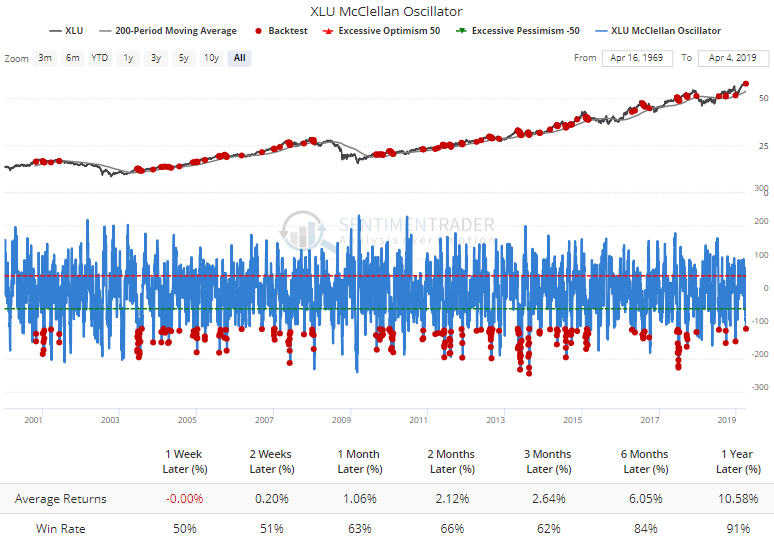
In prior reports and notes, we've looked at the surge in breadth in utilities. For such a staid sectors, readings like that have preceded weakness almost every time, which we've seen once again.
Now, the McClellan Oscillator for the sectors has dropped to -110. When XLU is above its 200-day average, this has led to only modest positive shorter-term returns. Longer-term, returns were good.
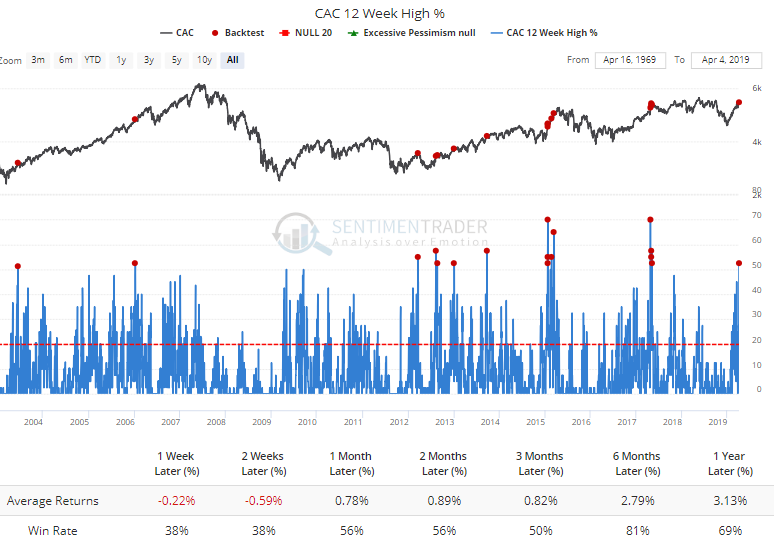
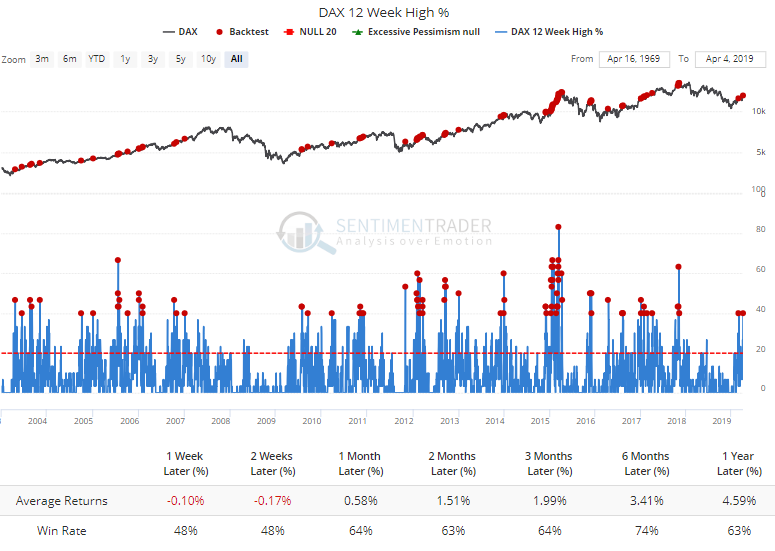
More than 50% of stocks in the French CAC 40 hit a multi-month high. It's been tough for that index to sustain such gains shorter-term.
Same with the German DAX index.
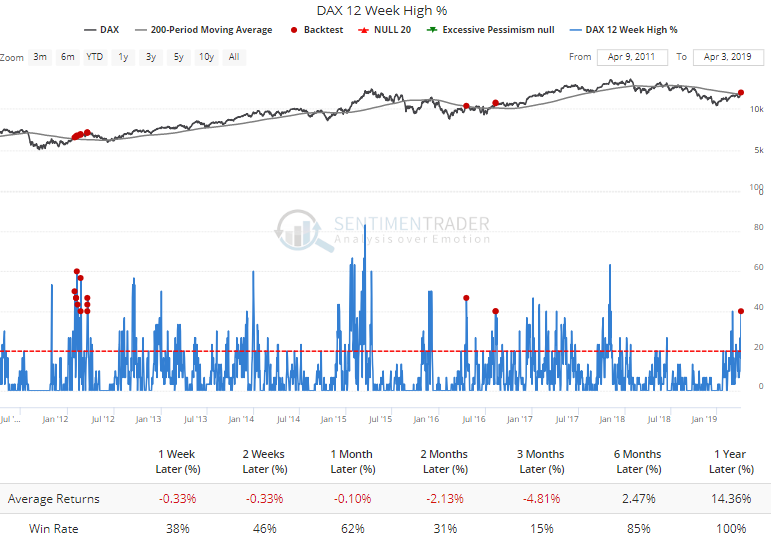
The few other times there have been so many of the stocks at a multi-month high while the DAX was above its declining 200-day average, it was even more difficult to sustain the gains (tiny sample size, though).
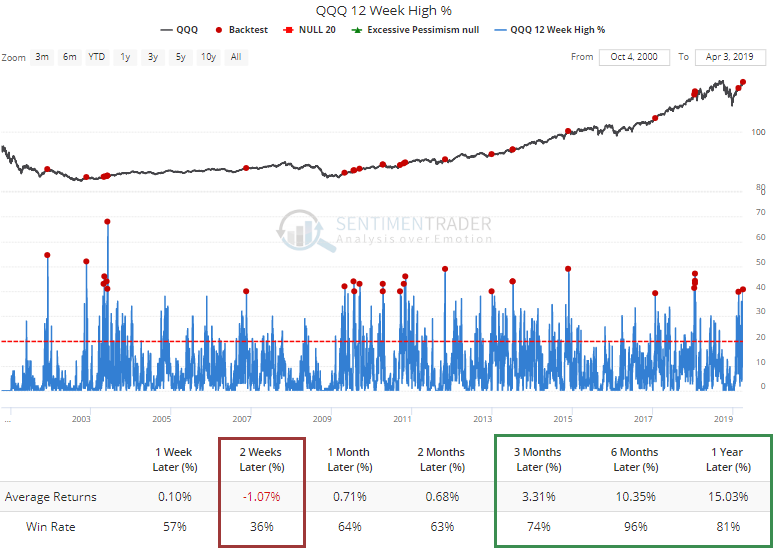
U.S. stocks haven't been left out. In the Nasdaq 100, 40% of stocks also hit a multi-month high. Over the next two weeks, QQQ tended to pull back, but it was a good longer-term sign of momentum.
In the broader information tech sector, it was even more extreme, with more than 60% of components hitting a multi-month high. Curiously, that led to worse returns.
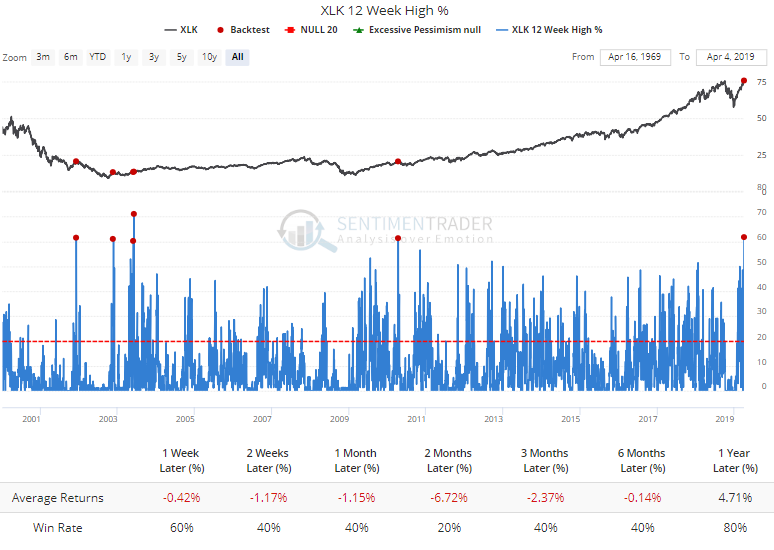
Same goes for when every single stock in the sector has managed to trade above their 10-day moving average.

Who's Hiring
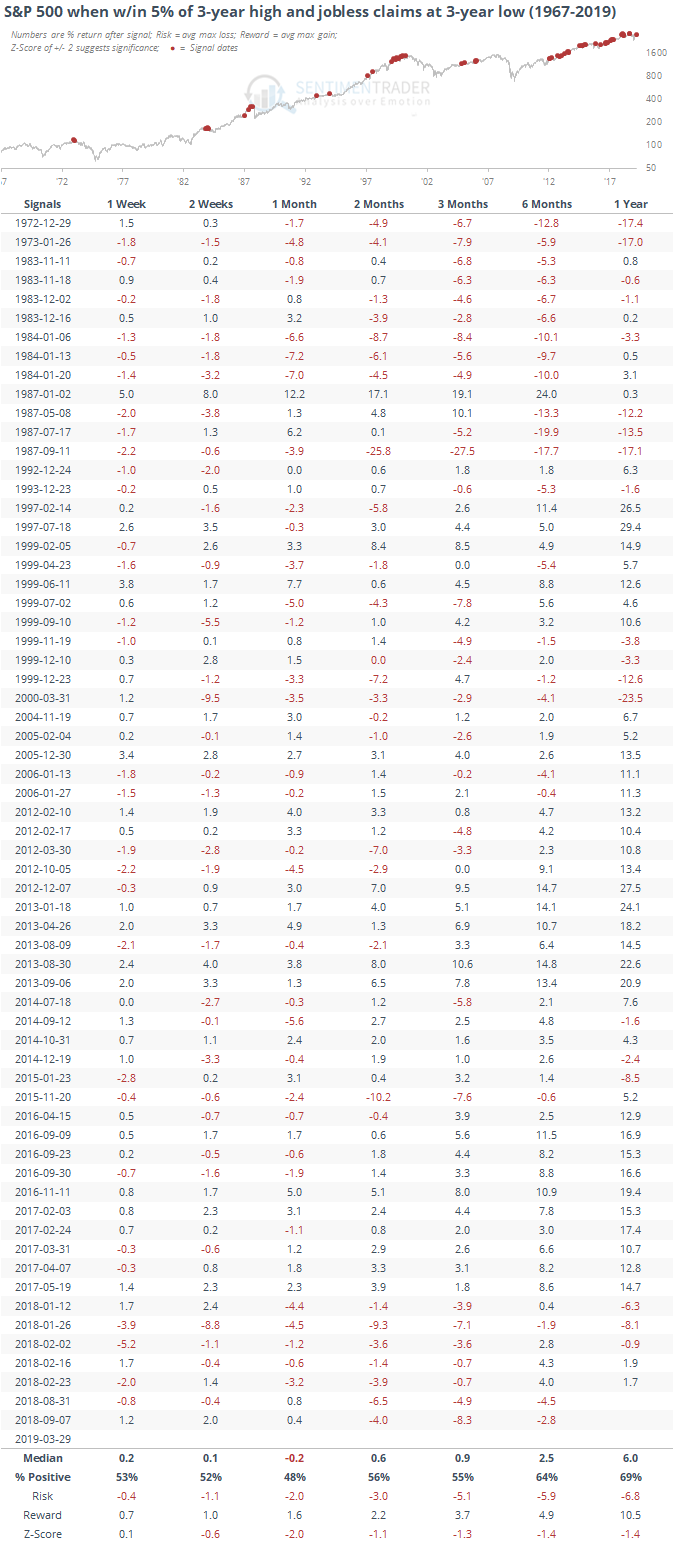
Jobless claims plunged to another new low for the latest reporting period at the end of March. We typically see this rise ahead of recessions. Below, we can see how the S&P 500 has fared when claims were at their lowest point in at least three years, while the S&P was within 5% of its high.
Returns were more than 1 standard deviation below random across all time frames longer than a couple of weeks.