
Tightest Cluster Of Small-Cap Weakness Since '99

A large “small” divergence
Over the past 30 days, there have now been 6 sessions when the S&P 500 was at or near a 52-week high, but the ratio of the small-cap Russell 2000 index to the S&P sunk to a 52-week low. That’s the tightest cluster of days since April 1999.
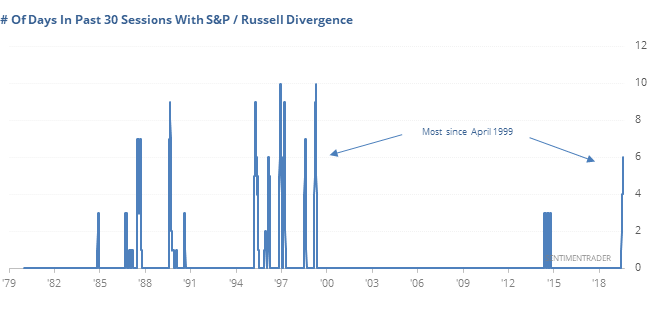
Large, rounded peaks in the ratio have almost universally preceded trouble in the broader market, very roughly preceding the declines in 1987, 1990, 2000, 2007, and 2015.
Lack of traction
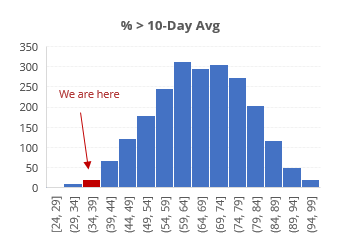
The S&P 500 took a breather over the past week or so, at least until Tuesday’s jump. It didn’t decline much, but the choppiness was enough that most stocks in the index fell below their short-term moving averages, and suspiciously few of them managed to keep making 52-week highs.
For a day when the S&P was within spitting distance of a new high, it's highly unusual to see so few of its stocks trading above their 10-day moving average.
Going forward, the S&P’s returns were below random on all time frames, and the risk/reward was negatively skewed, especially over the next three months.
Watch Mexico
Among all sectors and indexes we follow, the most extreme readings in breadth or sentiment are in the Mexbol index of Mexican stocks. Recent sessions have triggered a number of extremes, and further weakness on Tuesday likely furthered those extremes. The market is getting very close to “puke” levels of panic.
Watch for icebergs
We’ve focused a lot on a split in the market which has developed in recent days. Now 4 of the past 5 sessions on the Nasdaq have triggered a Titanic Syndrome, a new high in the Composite followed quickly by more 52-week lows than highs on the exchange. Per the Backtest Engine, a 5-day average of 0.8 or above (meaning at least 4 of the last 5 days) has triggered on 95 days, after which the Composite rose during the next 2 weeks only 31 times.
This post was an abridged version of our previous day's Daily Report. For full access, sign up for a 30-day free trial now.