
Time to Keep a Close Eye on Platinum

It is no secret that markets tend to move in waves. A given market will trend higher for a while - with countertrend movements interspersed along the way - and at other times, the same market will trend lower for a while. And often, as the primary trend is changing, there is a period of great doubt as bulls and bears struggle for control. There can be a volatile trading range during these periods - OR an incredible amount of "calm"- with seemingly little going on in that particular market.
But ultimately, the time for "deciding" comes. At that point, traders need to be most focused on the market and prepared mentally and financially to do what they must to latch onto and profit from the next major trend.
A market that appears to fit this bill at the moment is platinum. So, let's take a closer look "under the hood."
PRICE ACTION
It can be argued that ultimately the only "indicator" that matters is price. And in terms of actually making money in the market, this is true. And many, many traders rely heavily on charting and chart patterns in making trading decisions. As a proud graduate of "The School of Whatever Works," I have no personal objection to a person relying on charts to guide their trading if that actually DOES work for them. However, this does seem like an appropriate time to invoke the following:
Jay's Trading Maxims:
#55: Drawing lines on a chart is different than making money
#56: You can see whatever they want to see in a bar chart
#57: If you draw enough lines on a chart, price will eventually touch one of them. Do NOT confuse this with something useful.
The bottom line is that "chart reading" can be an incredibly subjective exercise. While teaching a seminar, I passed out a copy of a random bar chart and asked the attendees to draw the most relevant trendlines on the chart. Would you be at all surprised to learn that no two charts looked the same? Probably not.
Because I am no different than anyone else in this regard, I ultimately evolved to mostly drawing only horizontal lines on charts (I am not advocating or urging you to do the same, just reporting my own take). In other words, I try to focus on support and resistance lines rather than trendlines. Make no mistake, identifying support and resistance can also be subjective in nature. But in many cases, it can also be pretty cut and dried.
Consider the monthly, weekly, and daily charts of platinum futures (using continuous spot-month data) that appear below.
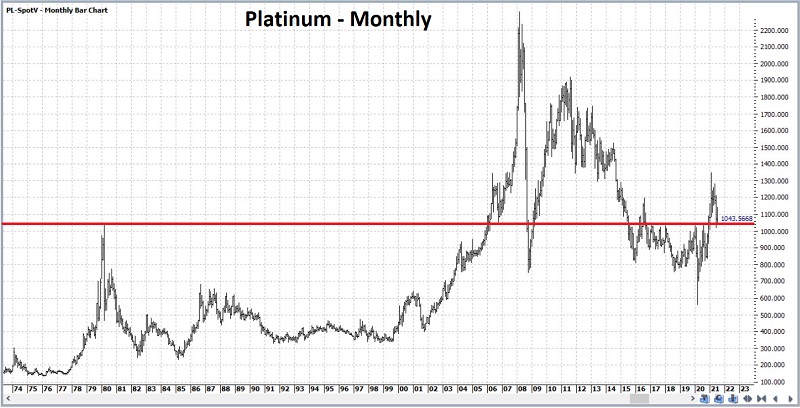
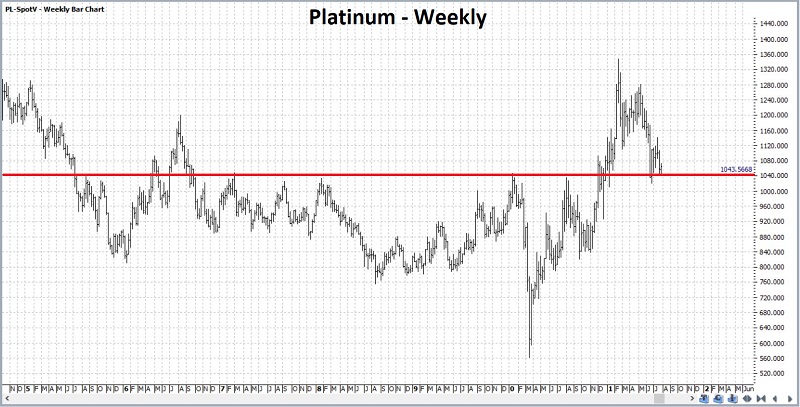
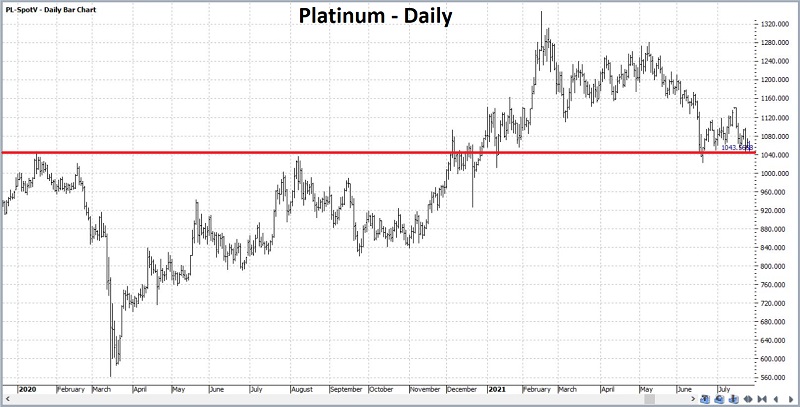
As you can see in the charts above:
- Platinum rallied sharply in the late 1970s before topping out near $1045 an ounce in early 1980
- It then fell back and did not exceed $1045 again for another 26 years
- After another 15 years of some big up and down swings, platinum is about where it stood in the early 1980s
Whether or not the price of platinum can hold against its long-term support/resistance price is an important piece of information.
SEASONALITY
The chart below displays the Annual Seasonal Chart for platinum. Platinum is entering a seasonally weak time of year.
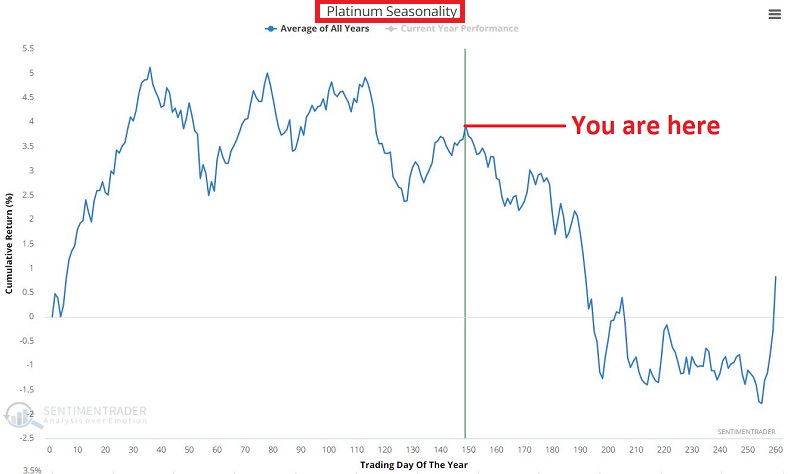
The chart below displays the hypothetical $ +(-) achieved by holding long a platinum futures contract ONLY from the close of Trading Day of Year #149 through Trading Day of Year #198 since 1987.
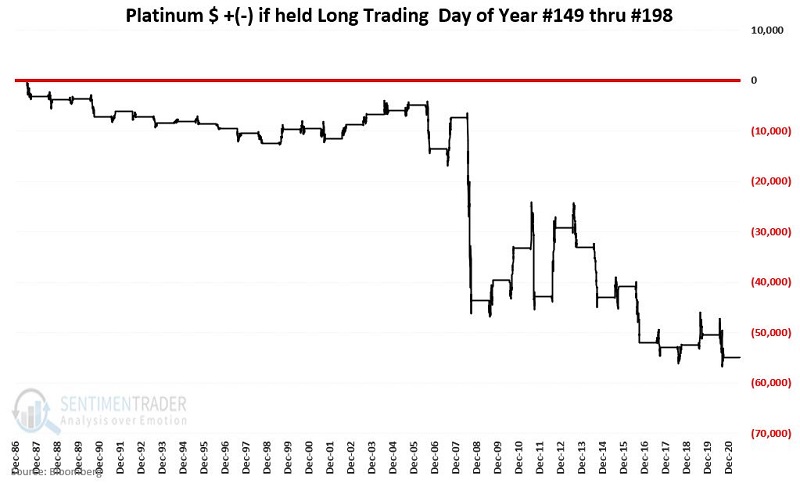
So, is platinum doomed to decline in the weeks and months ahead? Not all at. The problem is not so much that platinum "always" declines during this period. The problem is that when it does decline, it tends to go down a lot. Consider the following results for TDY 149 through TDY 198:
- # Times UP = 16
- # Times DOWN = 18
- Average $ UP = +$2,882
- Average $ DOWN = (-$5,611)
The win rate has been 47%; however, the average loss has been almost twice as much as the average gain. In essence, when platinum is good (during this particular timeframe), it's "OK," but when it's bad, it's "awful."
So, "Yes," platinum is entering a seasonally weak time of year. However, seasonal charts are not roadmaps. They merely offer a clue or suggestion in telling you which way things may be likely to go. Ultimately a trader must pay attention to price. But keep in mind that:
- A market that "should" be going up (or down) based on a strong seasonal tendency
- That actually IS going up (or down) in price
- It can be a powerful - and often money-making - opportunity
The implication here is admittedly somewhat subjective, yet still fairly straightforward:
- IF platinum breaks down below the support level highlighted in the earlier bar charts
- DURING the seasonally unfavorable time of year
- It MAY be reasonable to expect a meaningful decline to occur
Now let's add one more factor to the mix.
SENTIMENT
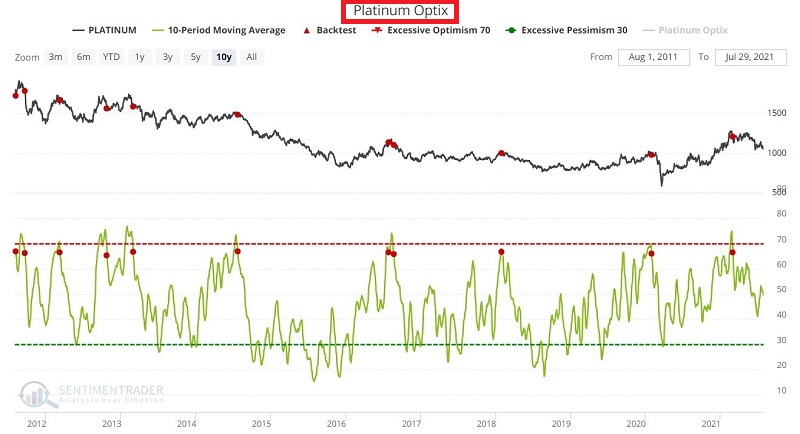
In the past 10 years (although in the interest of full disclosure, not so much in prior years), platinum price performance has been weak following:
- A break by the 20-day average of Platinum Optix from above to below 67%
The chart below shows the signals in the last 10 years.
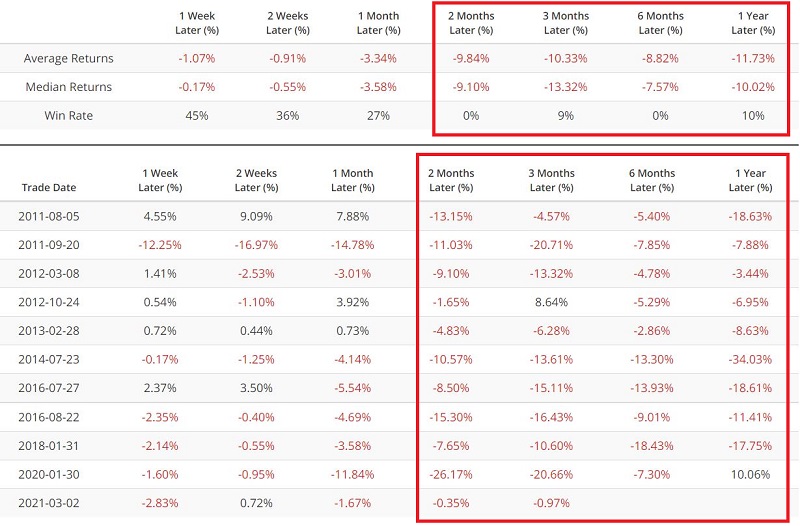
The table below displays the performance numbers for platinum following the signals in the chart above. The results speak for themselves.
SUMMARY
Several factors seem to suggest that platinum may be headed lower, particularly if it drops below its key support level. Still, support and resistance are funny things. Drawing a line on a chart does not make a specific price level important. What makes obvious support and/or resistance levels important is that many traders have a vested interest in either keeping price above or below a given level or pushing price through that key level to effectuate a new trend.
All eyes are on platinum in the near term as the time for deciding may be near.