
Too many S&P stocks underperforming by 10%

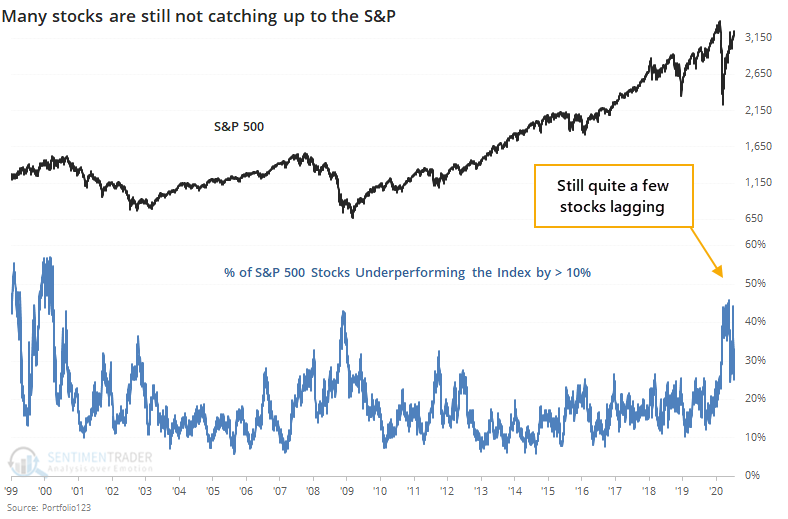
We saw on Wednesday that the Cumulative Advance/Decline Line has broken out to a new high. The stocks-only line, however, is still lagging.
As noted by The Daily Shot, the percentage of stocks trailing the index by more than 10% has spiked. While we have different data sources and likely a different methodology, we can see that this is the case.
The chart shows the percentage of stocks within the S&P 500 that are trailing the index's returns by 10% or more over the past 13 weeks. It's not unusual to see this figure jump during bear markets, which it did during the pandemic, but it is relatively unusual to see so many stocks continue to lag the index by so much when the index has climbed close to its prior highs.
The table below shows every date since 1999 when the S&P was within 3.5% of its 52-week high and yet more than a quarter of its component stocks were trailing the index by double-digits.
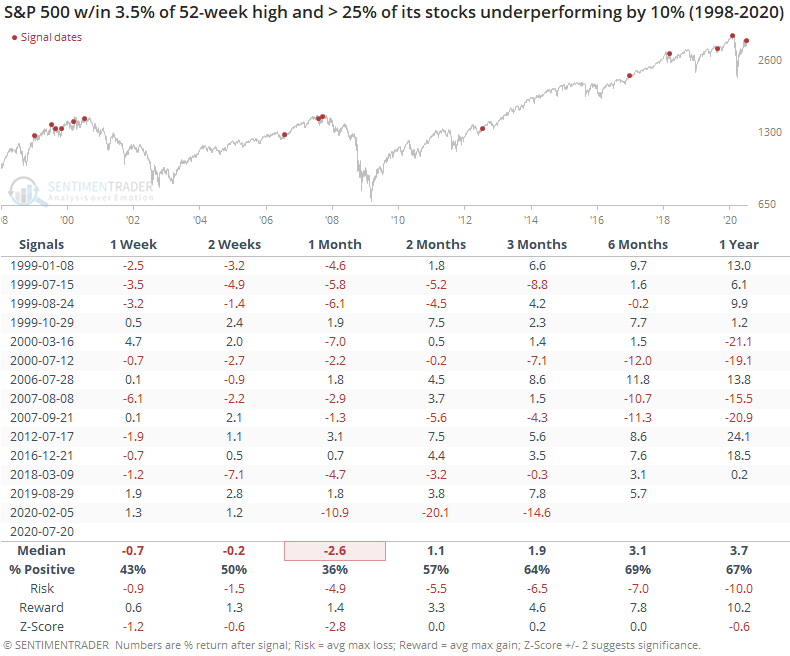
Forward returns over the shorter-term were poor, with a very negative risk/reward skew during the next month. Even up to three months later, the risk/reward was more heavily tilted toward "risk".
We'd rate this as a modest shorter-term negative here.