Products
SentimenTrader Trading Tools
‍
Backtest Engine
My Trading Toolkit
Correlation Analysis
Seasonality
Market Prediction
Indicators & Data API
‍
Proprietary Indicators & Charts
Market Data API
Strategies & Scanner
‍
50+ Trading Strategies
Smart Stock Scanner
Smart Option Scanner
Research Reports
‍
Research Solutions
Reports Library
Free Resources
Simple Backtest Calculator
Simple Seasonality Calculator
The Kelly Criterion Calculator
Sentiment Geo Map
Public Research Reports
Education
Sentiment Indicators
Technical Indicators
Pricing
Company
About
In the News
Testimonials
Client Success Stories
Contact
Log inLoginSign up
< BACK TO ALL REPORTS

Traders show more concern in bonds than stocks

Jason Goepfert
2022-02-09
The VIX "fear gauge" has dropped more than 25% from its 52-week high, showing equity investors see less risk ahead. But some measures of bond market "fear" remain elevated, nearing their highest level in a year. Similar behavior between the markets preceded some large losses in stocks, but those were more the exception than the rule.

Key points:

  • The VIX has dropped more than 25% from its high
  • At the same time, bond market "fear" has remained elevated, near 52-week highs
  • Similar behavior preceded some significant declines in stocks, but those were the exceptions

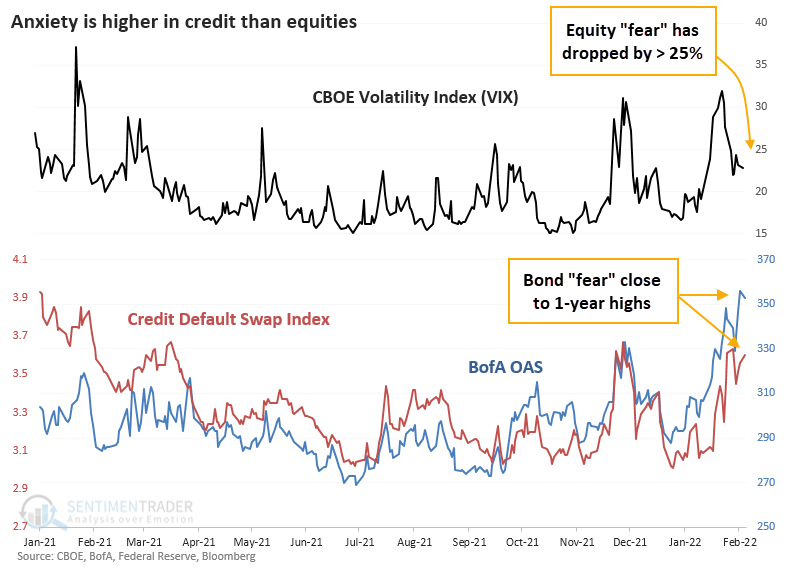
Bond market fear nears 1-year highs as equity market fear drops

We saw on Monday that investors have picked up their hedging activity. One of those metrics was their willingness to pay more for protection against a major credit event.

An alternative measure of this concern, with a longer history, is option-adjusted credit spreads. Bond traders will cringe at this, but if we use CDX spreads or option-adjusted spreads as a sign of bond market "fear", they're just off their 52-week highs. But equity market "fear" via the VIX is down by more than 25%.

It's relatively rare to see these equity and bond metrics diverge for long. The chart below shows a 10-day rolling correlation between daily changes in the VIX and option-adjusted spreads. Over the past few years, it has spent 82% of the time in positive territory. The current reading is in the bottom 7% of readings.

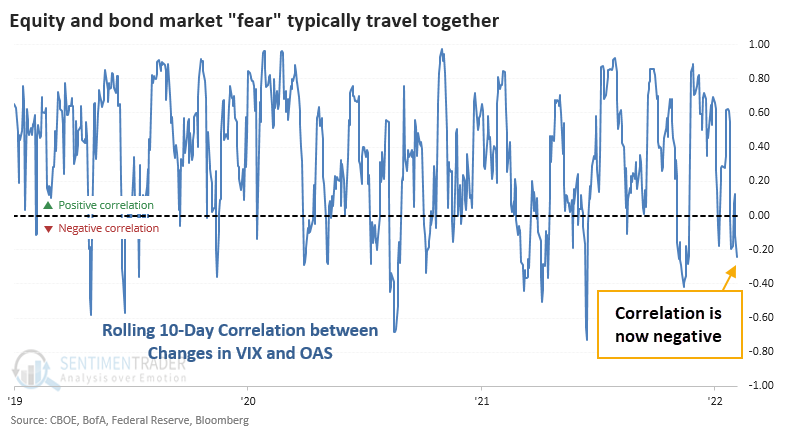
A market clichè is that the bond market is smarter. We've looked at that from dozens of different directions over the decades, and there is no clear edge one way or the other. Sometimes, bond traders panic just as foolishly (in hindsight) as stock traders.

Similar bond vs. stock market "fear" showed gains for stocks...with a caveat

To see if there's anything to this current situation of elevated bond market fear while stock investors see easing concerns, the table below shows all similar days since 1997.

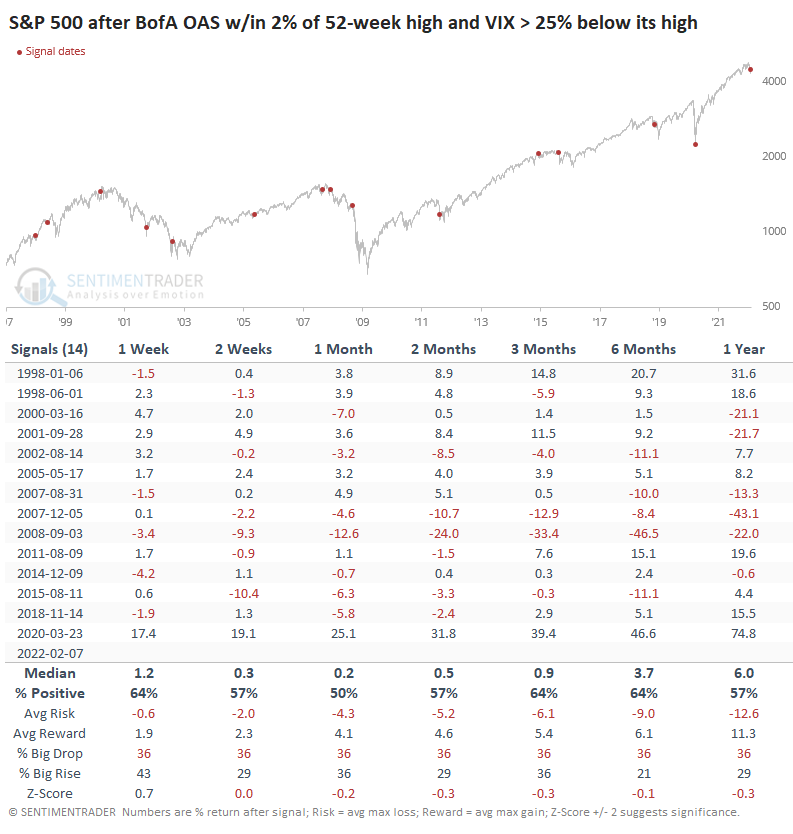
Several times, concern in the bond market was a good tip-off that stock investors weren't pricing in enough risk. Near the market peaks in 2000, 2007, and 2015, we saw a divergence like this, leading to large losses in the S&P 500. Most of the time, though, the S&P rose in the weeks and months ahead. Its median return was below average but still positive.

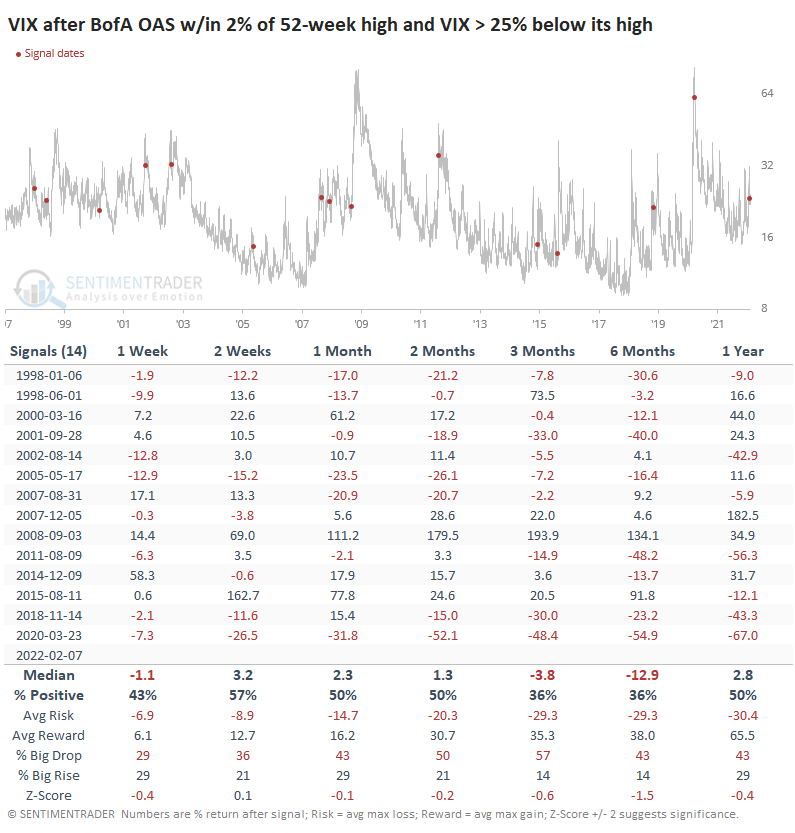
For the VIX, it was not a consistent enough signal suggesting it would spike. Over the next 3-6 months, the VIX rose after only 5 of the 14 signals.

What the research tells us...

With the market environment currently unhealthy, we're constantly looking for signs that the recent recovery from pessimism will fail. That's what unhealthy markets do. The rise in concern in the bond market is a potential tip-off that stock investors are too complacent, with some supporting evidence from prior peaks. But it has not been a consistent enough signal to suggest we dismiss the recent positives over a medium-term time frame.

PRODUCTS
SentimenTrader
Trading Tools
Indicators & Data API
‍
Strategies & Scanner
‍
Research Reports
FREE
RESOUrCES
Simple Backtest
Calculator
Simple Seasonality
Calculator
The Kelly Criterion
Calculator
Sentiment Geo Map
‍
Public Research Reports
‍
Education
Sentiment Indicators
‍
Technical Indicators
‍
Pricing
Bundle pricing
‍
FAQ
‍
Announcements
‍
COMPANY
‍
About
‍
In the News
‍
Testimonials
‍
Client Success Stories
CONTACT
‍
General Inquiries
‍
Media Inquiries
‍
Financial Professionals Inquiries
‍
© 2026 Sundial Capital Research Inc. All rights reserved.
Setsail Marketing
TermsPrivacyAffiliate Program
Risk Disclosure: The information and tools provided are for research and analytical purposes only and are not intended as investment advice. Market analysis involves uncertainty, and outcomes may differ from expectations. Users should conduct their own due diligence and consider their individual circumstances before making any financial decisions. Past performance is not necessarily indicative of future results.

Hypothetical Performance Disclosure: Hypothetical performance results have many inherent limitations, some of which are described below. No representation is being made that any account will or is likely to achieve profits or losses similar to those shown; in fact, there are frequently sharp differences between hypothetical performance results and the actual results subsequently achieved by any particular trading program. One of the limitations of hypothetical performance results is that they are generally prepared with the benefit of hindsight. In addition, hypothetical trading does not involve financial risk, and no hypothetical trading record can completely account for the impact of financial risk of actual trading. for example, the ability to withstand losses or to adhere to a particular trading program in spite of trading losses are material points which can also adversely affect actual trading results. There are numerous other factors related to the markets in general or to the implementation of any specific trading program which cannot be fully accounted for in the preparation of hypothetical performance results and all which can adversely affect trading results.

Testimonial Disclosure: Testimonials appearing on this website may not be representative of other clients or customers and is not a guarantee of future performance or success.