Tuesday Color - Gold vs Yen, Russell Lag, S&P Divergence, Mexican Breadth, Smart Money Selling

Here's what's piquing my interest so far on another day that's finding buyers not sticking around.
Gold Hedge
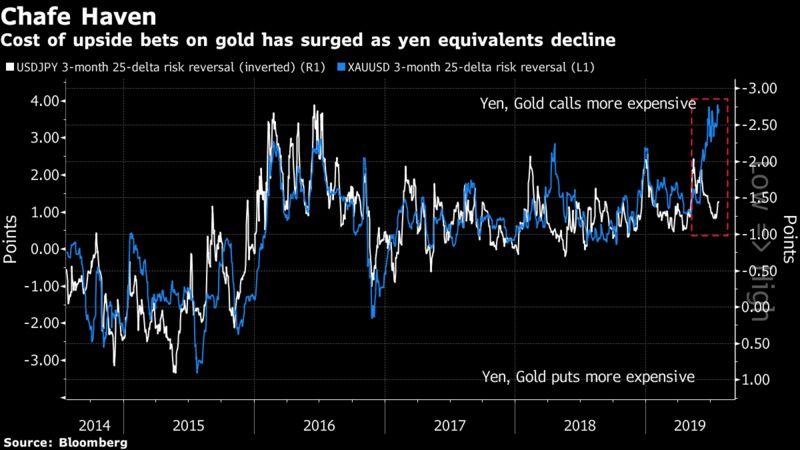
Bloomberg notes that per Goldman Sachs, investors may be better off hedging against uncertainty with the yen than with gold. That's based on how pricey each of them are according to the options market. We saw last week that call options on gold have gotten expensive, and Goldman's view is that traders are now overpaying versus alternatives like the yen.
Using the concept of risk reversals, which shows how much traders are paying for call options relative to put options, Goldman notes that there has been a close correlation between what investors are willing to pay for the USD-JPY versus gold, except for the past month or so when it has broken down.
Over time, the amount that options traders are willing to pay for each hedge has changed, so it may be better by looking at where they are compared to their range over the past year. In recent weeks, this has been near 100% for gold, meaning that traders were paying up for calls to the largest extent of any point over the past year. For the USD-JPY, it was in the bottom 10%.
That has started to change over the past few sessions, suggesting the trend might be changing.
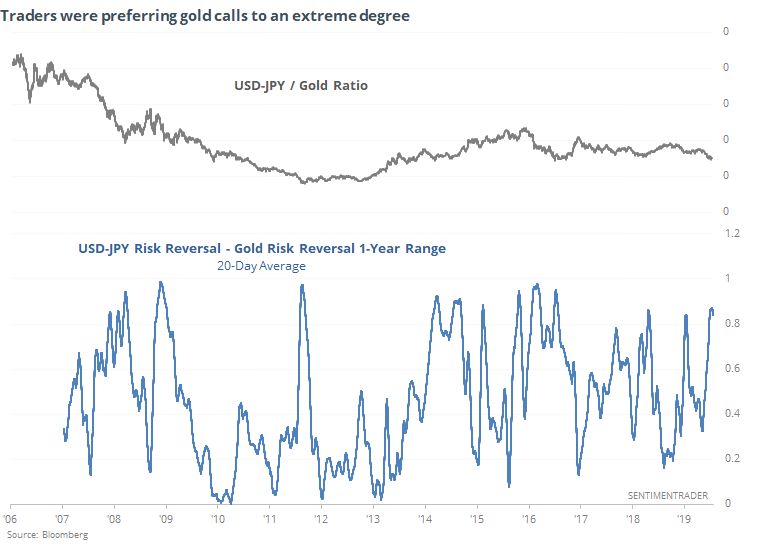
It's all kind of convoluted, but the bottom line is that options traders were preferring gold over the yen to a truly extreme degree, and now that trend might have been exhausted.
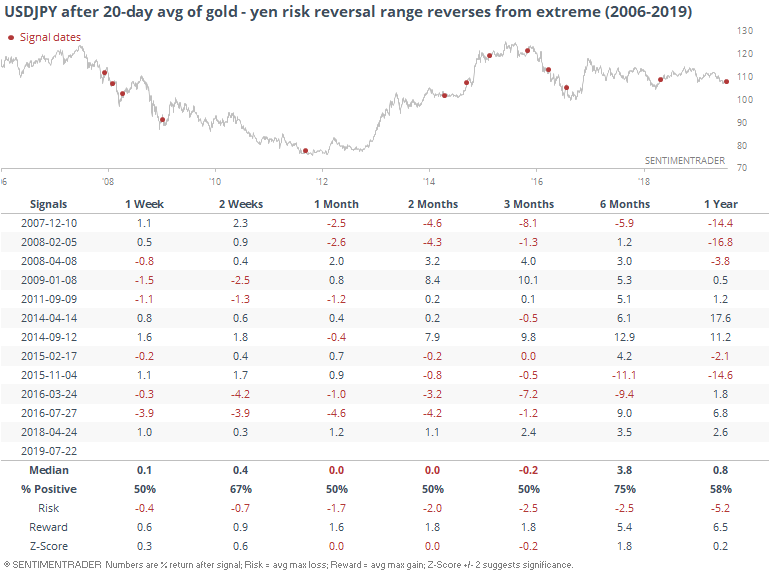
Below, we can see how the USD-JPY cross performed after other inflection points.
And gold, which has mostly struggled.
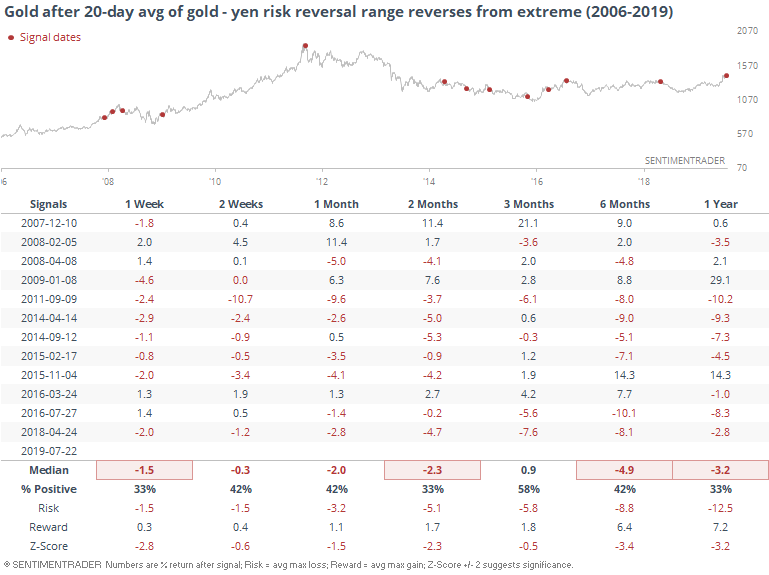
Goldman may have a point, in particular with reference to gold being expensive relative to some of the alternatives out there for those wanted to bet that investors are about to move into some sort of safe haven asset.
Losing Their Influence
The WSJ, among others, are increasingly noting the waning influence of small-cap stocks as investors cluster in the perceived safety apparent in the growth of massive tech companies.
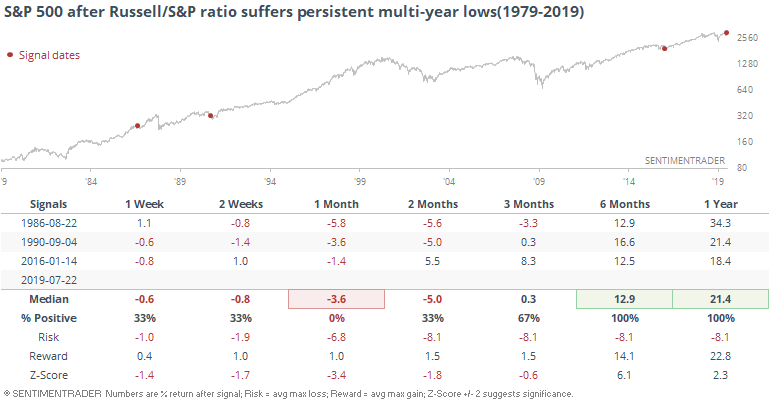
We've already seen repeatedly in recent weeks that the Russell 2000 has lagged other indexes like the S&P 500, and the ratio between them has again sunk to a multi-year low.
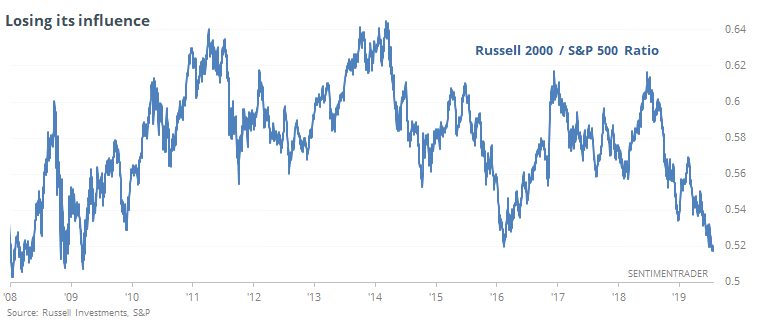
Over the past decade, the ratio hasn't been much lower, but longer-term, it has.
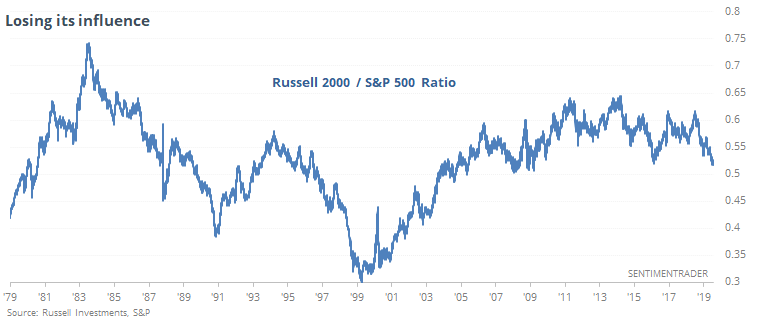
Still, the past couple of months have seen one of the largest clusters of days with the ratio sinking to multi-year lows, seen only a few other times in the past 40 years.
For the S&P, it was temporarily bad news, but clearly not a problem over the next 6-12 months.
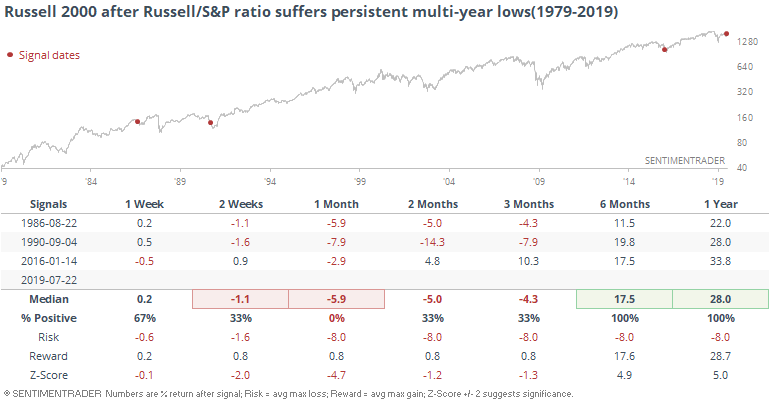
Same for the Russell. It showed worse shorter-term returns, and better longer-term ones.
So it's no surprise then that the ratio of the S&P to Russell rose over the shorter-term but fell longer-term two out of three times.
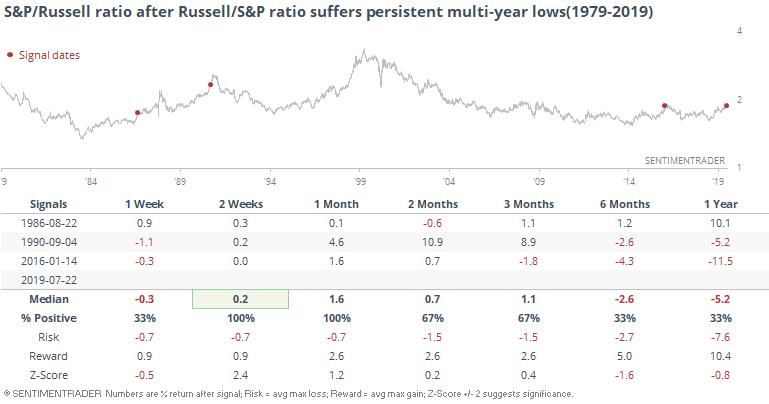
Bottom line, the starkly poor performance in the small-cap stocks suggests a continued lag for a while, but potential mean-reversion longer-term. At least, based on a tiny sample of 3.
Sector Breadth
The weakness in small-cap stocks is leaking into the breadth metrics, though none are at any kind of extreme. The percentage of stocks in the Russell 2000 that have fallen to a multi-month low continues to rise, and we can see that the index hasn't really been able to recover until that reverses. It's kind of a tautology, but still, trend-following bulls would want to see these lows start to contract.
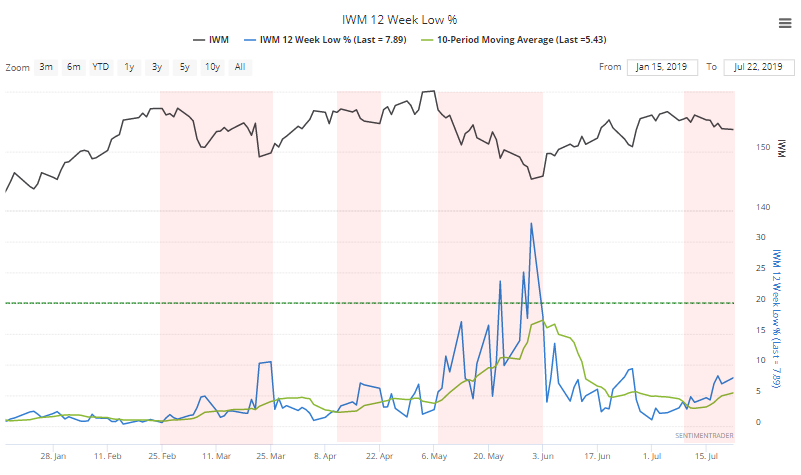
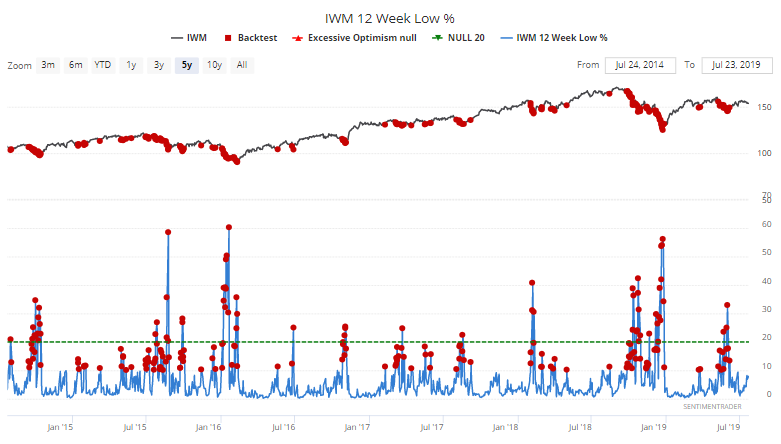
Lacking a positive trend, the best hope for bulls would be an oversold reading, which we're not at either. Most of even the minor lows in IWM over the years have come when at least 10% of the stocks hit a multi-month low, which hasn't happened yet on this latest decline.
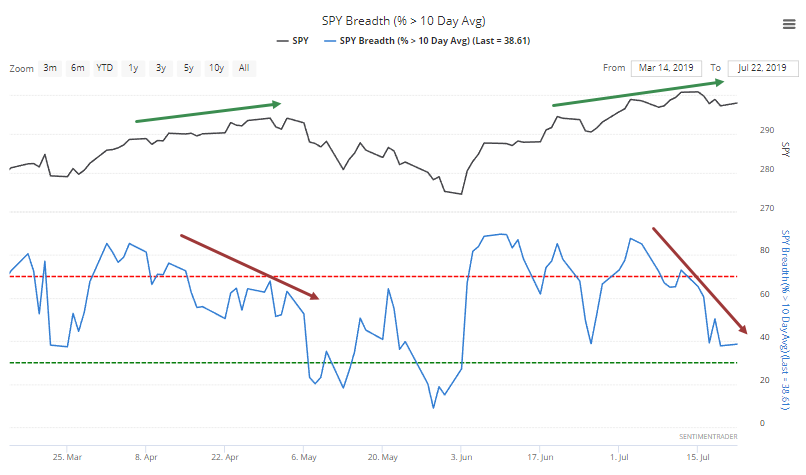
Within the S&P 500, there isn't that bad of a leak among stocks, but as noted by deservedly respected strategist Tony Dwyer on CNBC, relatively few stocks are trading above their short-term moving averages, despite the index itself being within spitting distance of a new high.
This is a steeper fall-off even than we saw earlier in the spring.
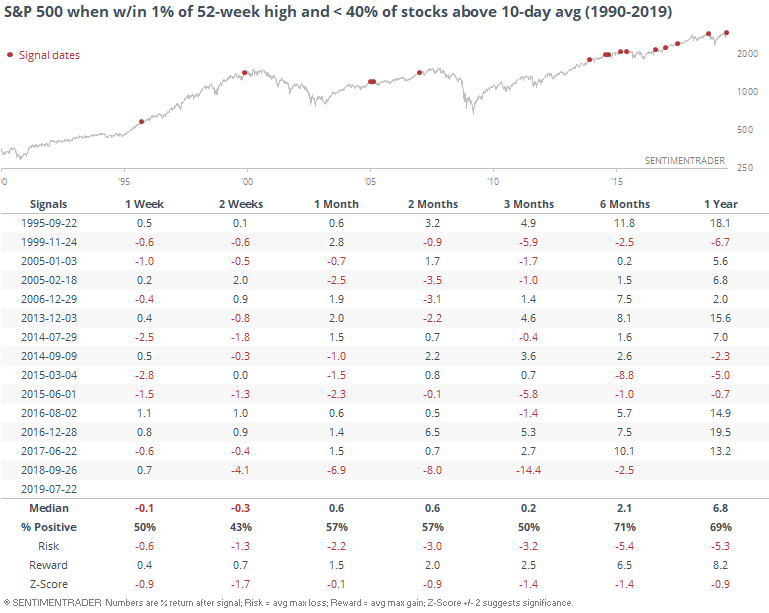
Historically, it has not been a total rally-killer, but did precede more risk than reward up to three months later.
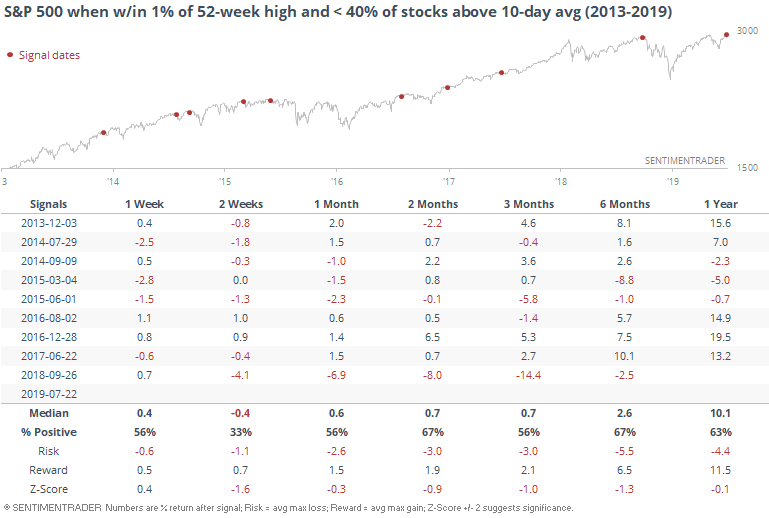
If we focus only on the signals since the financial crisis, it's pretty much the same story, maybe even worse, at least for the next couple of weeks.
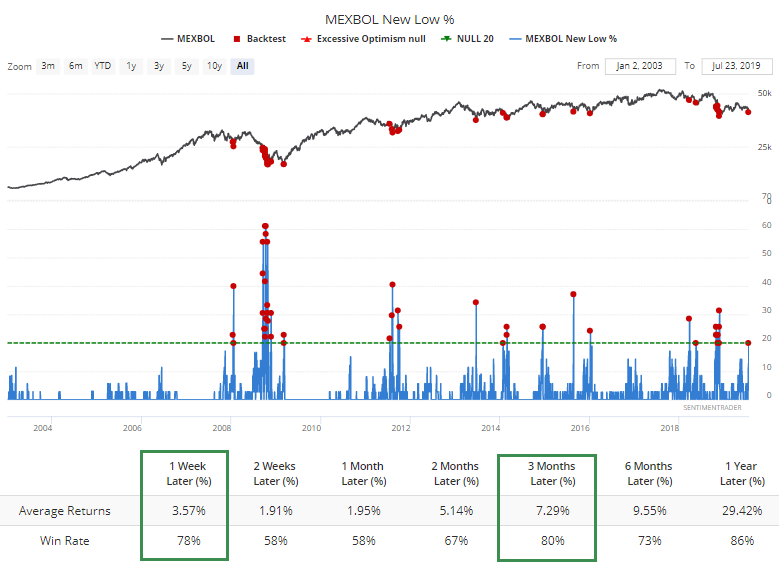
The only sector or index that is currently showing any kind of washed-out reading is the Mexbol index of Mexican stocks. By Monday, 20% of them hit 52-week lows. That wasn't enough to stave off further declines in 2008 or 2018, but it's getting close.
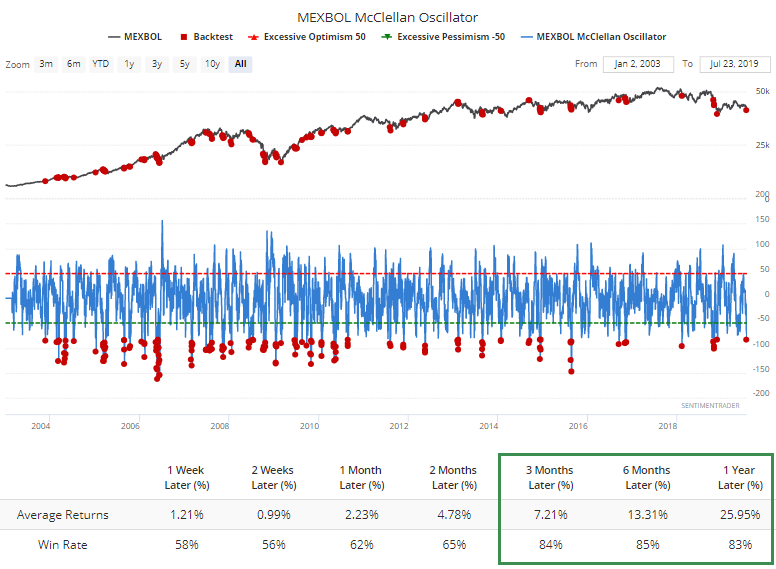
It's been enough widespread selling pressure to push the McClellan Oscillator to a very low level.
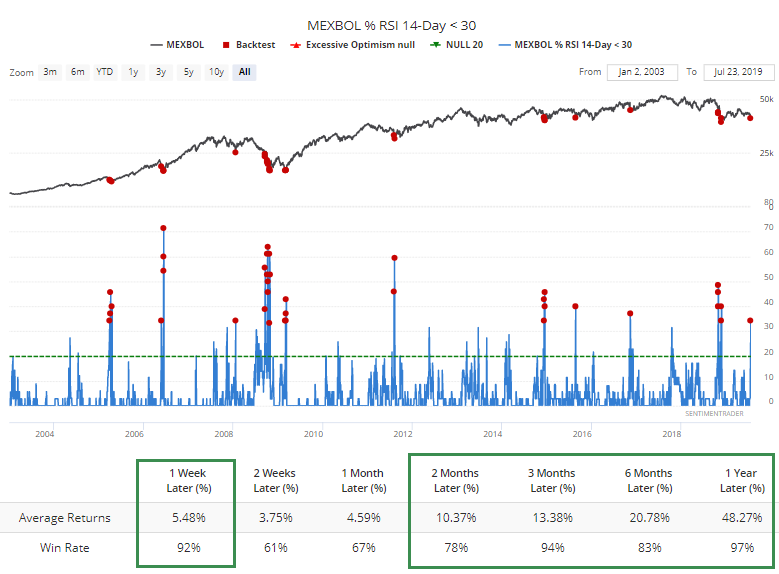
It also forced more than a third of the stocks into oversold readings. While that preceded 1 long-term loss, the index returned an average of a whopping 48% a year after readings this large.
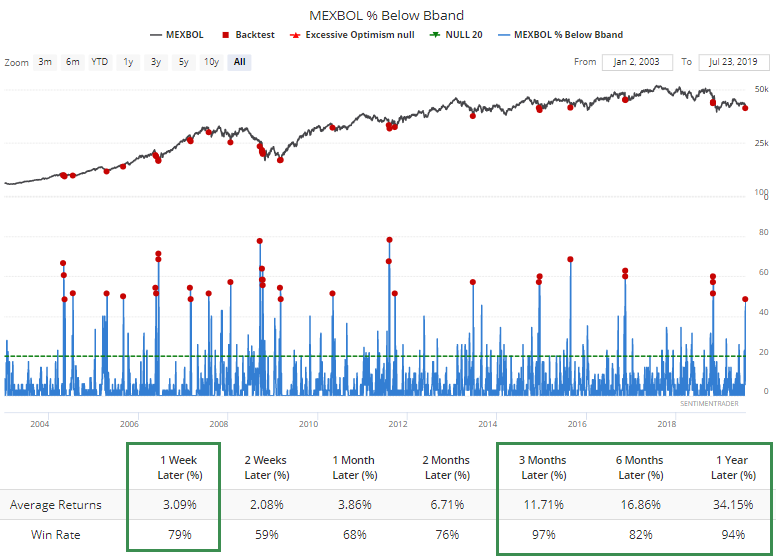
Almost the same story when nearly 50% of the stocks get hit so hard, and so fast, that they fall below their lower Bollinger Bands.
The breadth readings for this market are oh-so-close to true panic levels. Another 1-3 days of heavy selling pressure would likely tip them into historic territory, suggesting an opportunity for those looking for specific emerging market exposure.
Fading
With the rise in passive ETFs, and just ETFs in general, the last hour of trading has taken on increasing importance. And in recent sessions, that has meant selling pressure, with most days that showed gains earlier in the session morphing into losses.
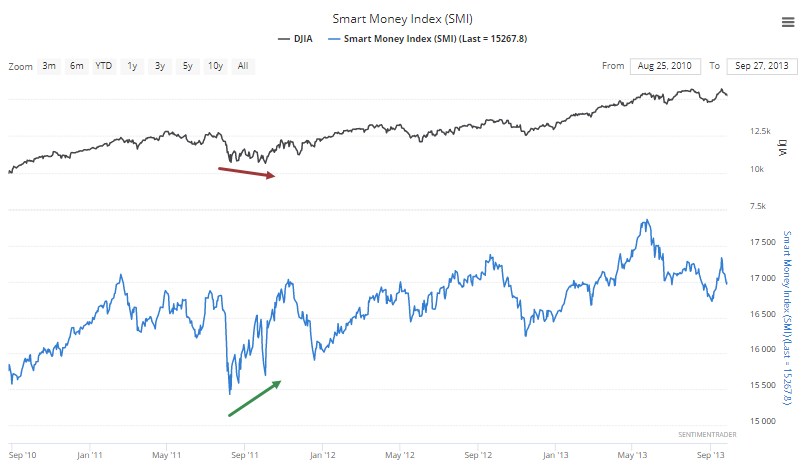
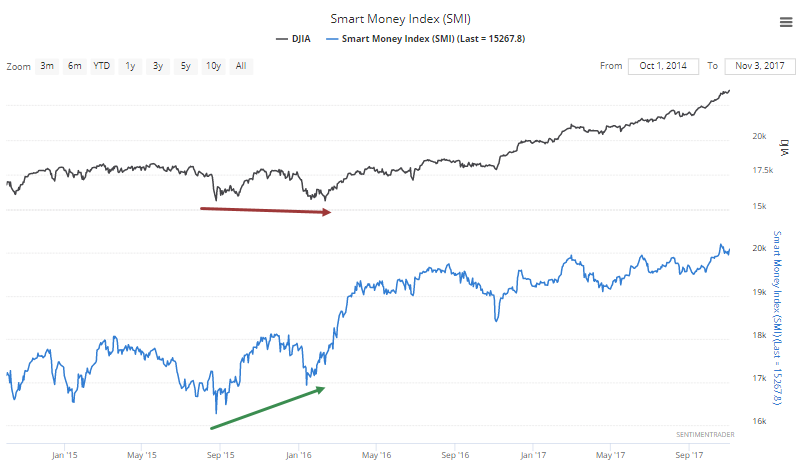
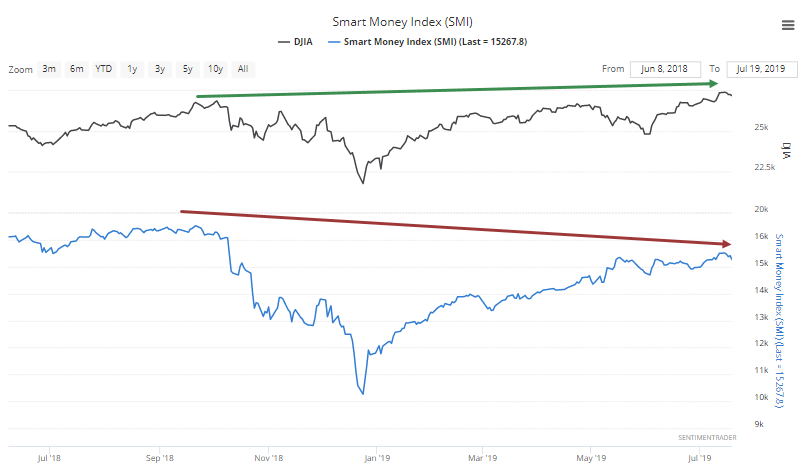
That has pushed the Smart Money Index (SMI) lower. The SMI compares trading in the last portion of the trading day to the rest of the session, with the dubious assumption that the "smart money" places trades near the session's close. That may have been the case in past years, but lately, it's more driven by fund flows, which is likely changing the definition of what type of money is trading the close.
Regardless, the SMI has continued to lag the market indexes badly.
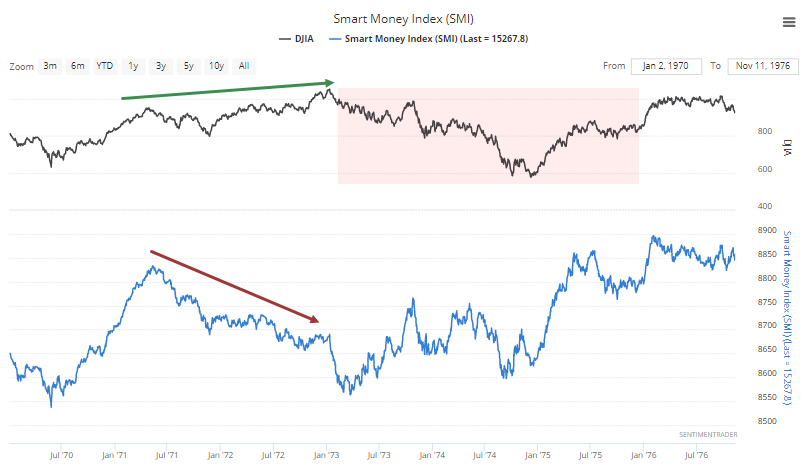
There have only been a few other times in history when the last hour of the session has so persistently dragged down performance. In 1972, sellers kept showing up near the close, even while the Dow Industrials managed to climb higher. That led to a nasty drawdown.
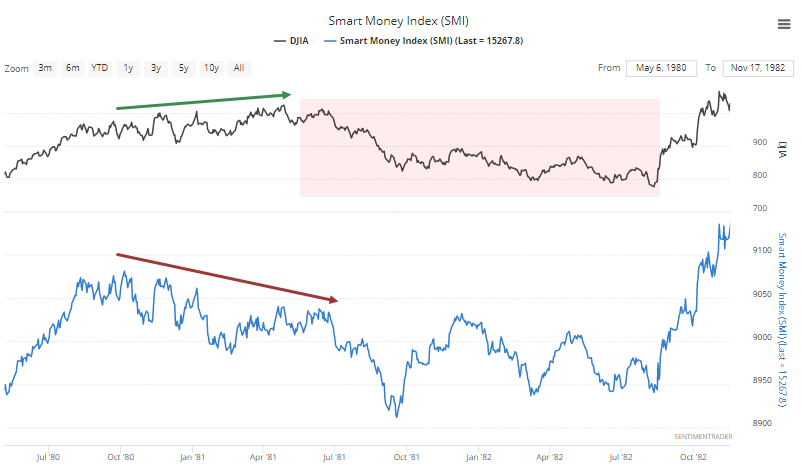
Same thing happened in 1981.
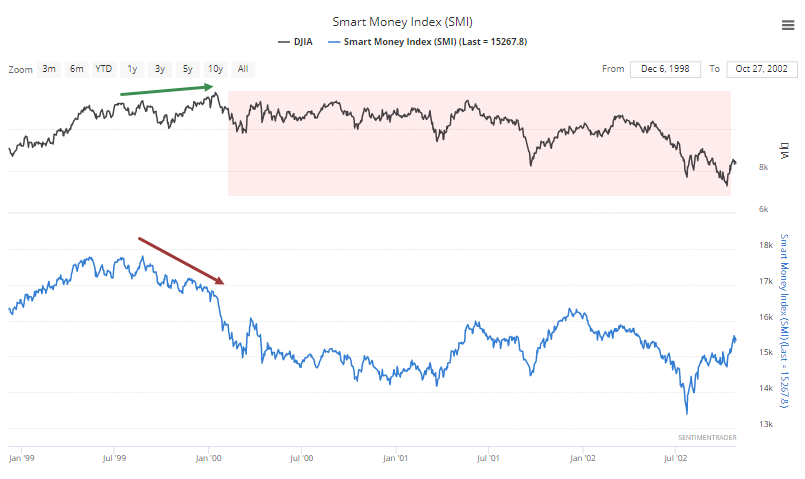
In 1998, it wasn't quite so pronounced, and the Dow did take a spill, but recovered quickly.
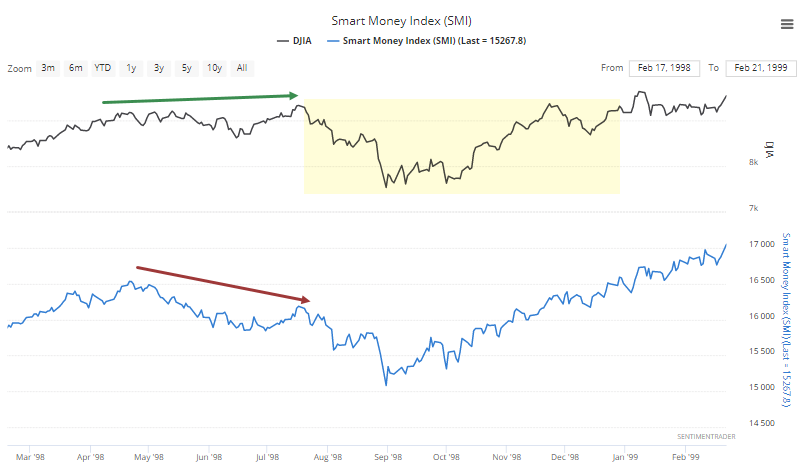
That led to 2000 and one of the nastier outcomes.
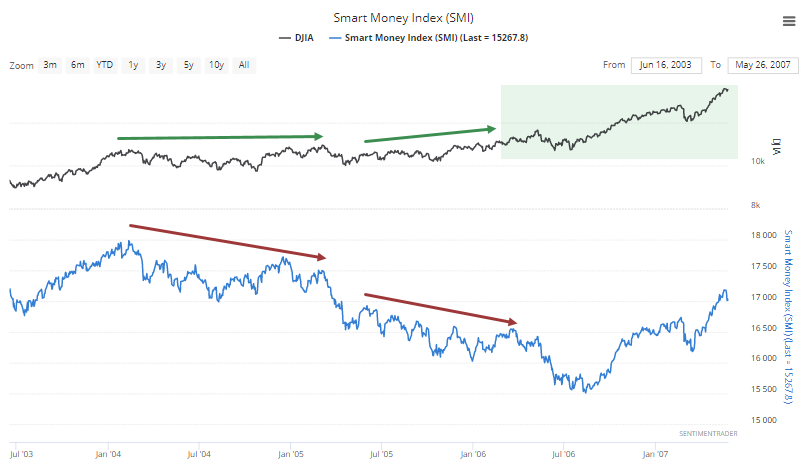
The biggest failure of the SMI to precede material weakness was in the mid-2000s when there was a persistent offer into the close, yet the Dow kept climbing. And climbing. And climbing. Sure, it ultimately morphed into the financial crisis but a 3-year lead time isn't much help to anyone.
Overall, it's a potential worry that sellers keep showing up, which has been the case for a while. The biggest caveats with taking it too seriously is that it has failed before (everything has at some point I suppose) and more so that ETF trading is taking up a larger and larger portion of late-day trading. It's not beyond the realm of possibility that this Smart Money Index is going to change into the Dumb Money Index before too long.
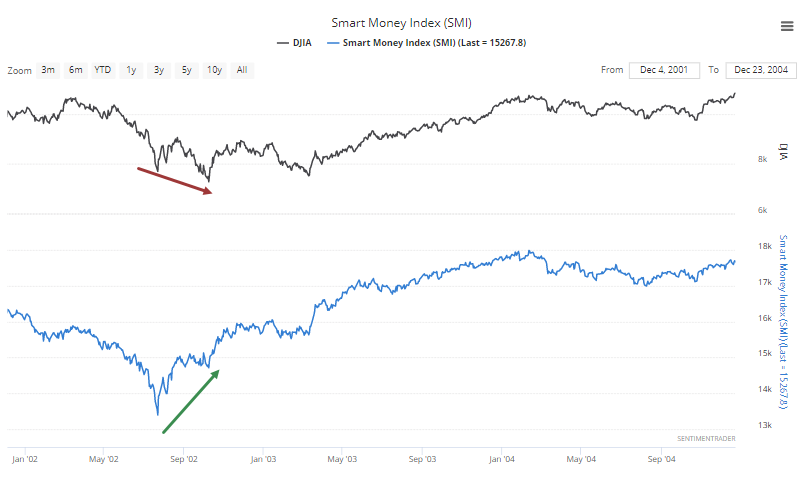
By the way, a more useful interpretation of this indicator is typically during selloffs. When we've seen sharp declines in stocks, then persistent late-day buying pressure, it has been a very good sign, like at the ends of the last two massive bear markets.
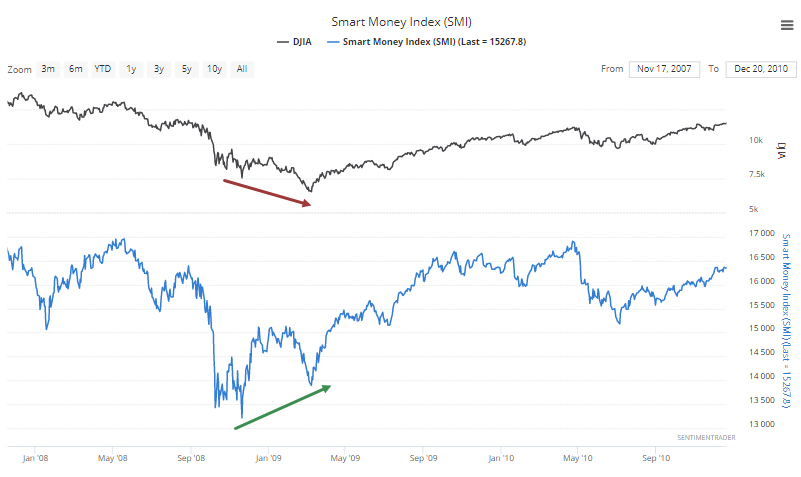
Also at the ends of lesser corrections since the financial crisis.