
Tuesday Color - Less Confident, Relative Lows, Bond Optimism, Gold Surge

Here's what's piquing my interest on a mostly weak day. Markets are likely going to be held to the latest posturings and headlines ahead of and during the upcoming G-20 meeting.
Less Confident
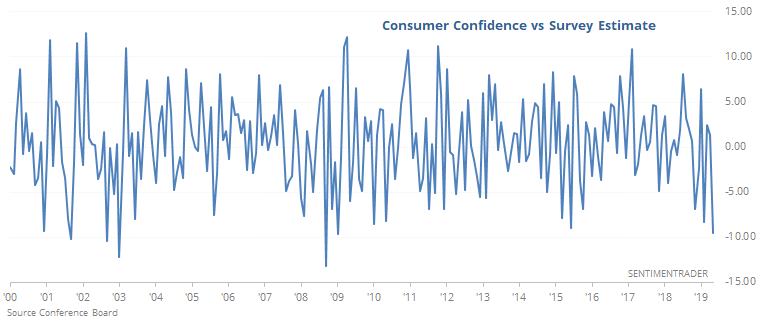
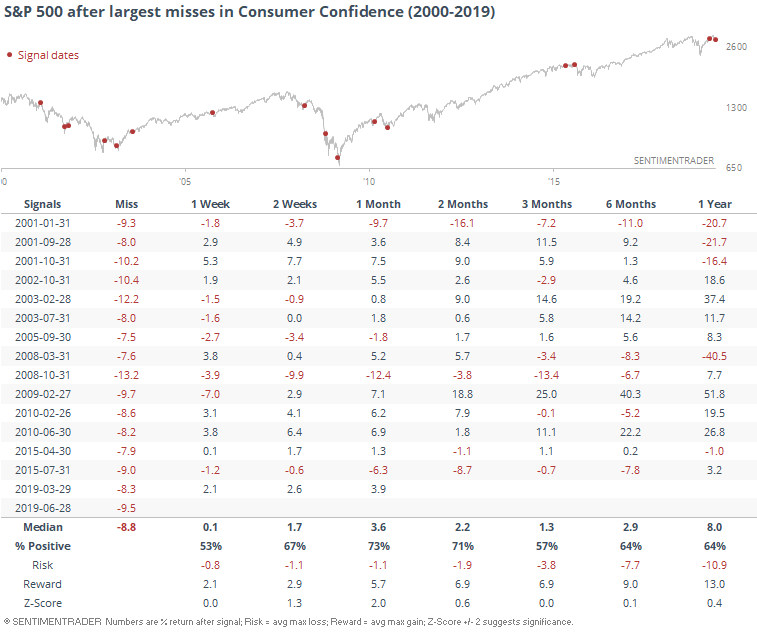
The latest Consumer Confidence survey came in way below economists' expectations, which won't help the surprise indexes any. It was one of the largest misses since 2000.
Whether this is a bad thing is debatable. Other big misses in the survey led to a higher S&P 500 over the next month 73% of the time.
Relative Lows
Most of the major stock indexes have pushed to new highs, and overall breadth figures have been good - both the S&P 500 and NYSE A/D Line have hit new highs in recent days.
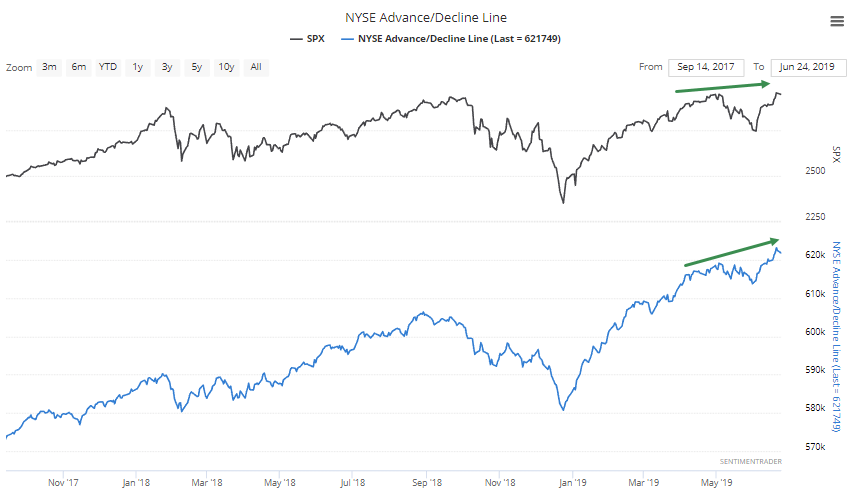
That doesn't mean all areas have been going along for the ride, and it's become more of a concern. Both the WSJ and Bloomberg note that small-caps, transportation stocks, and banks have been lagging the market badly.
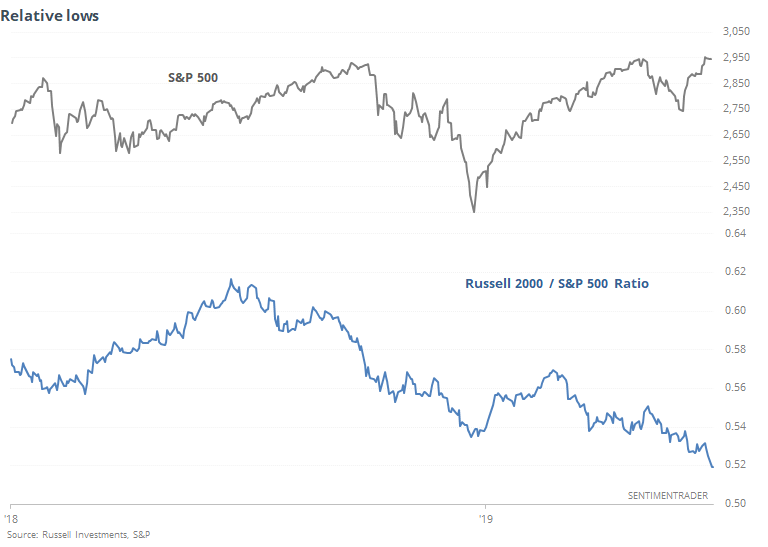
Relative to the S&P, small-caps just hit a new low, within days of the S&P hitting a high.
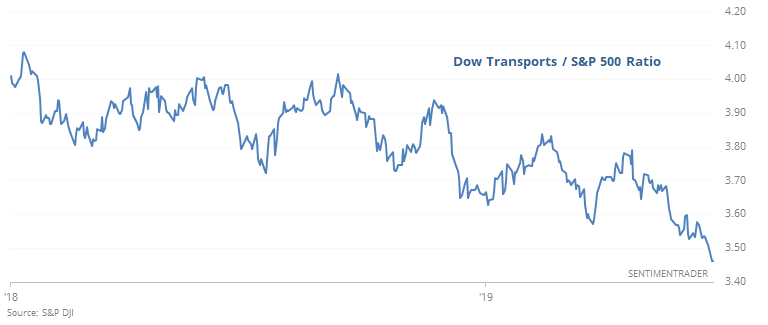
So did transports.
And banks.
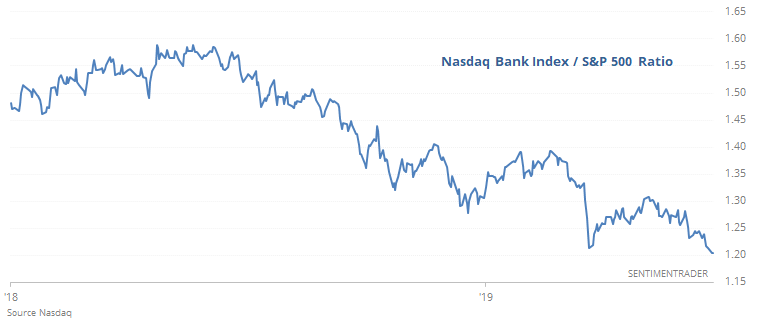
The only reason for using the Nasdaq Bank index as opposed to a more popular index like the BKX is more history. They have a very high correlation.
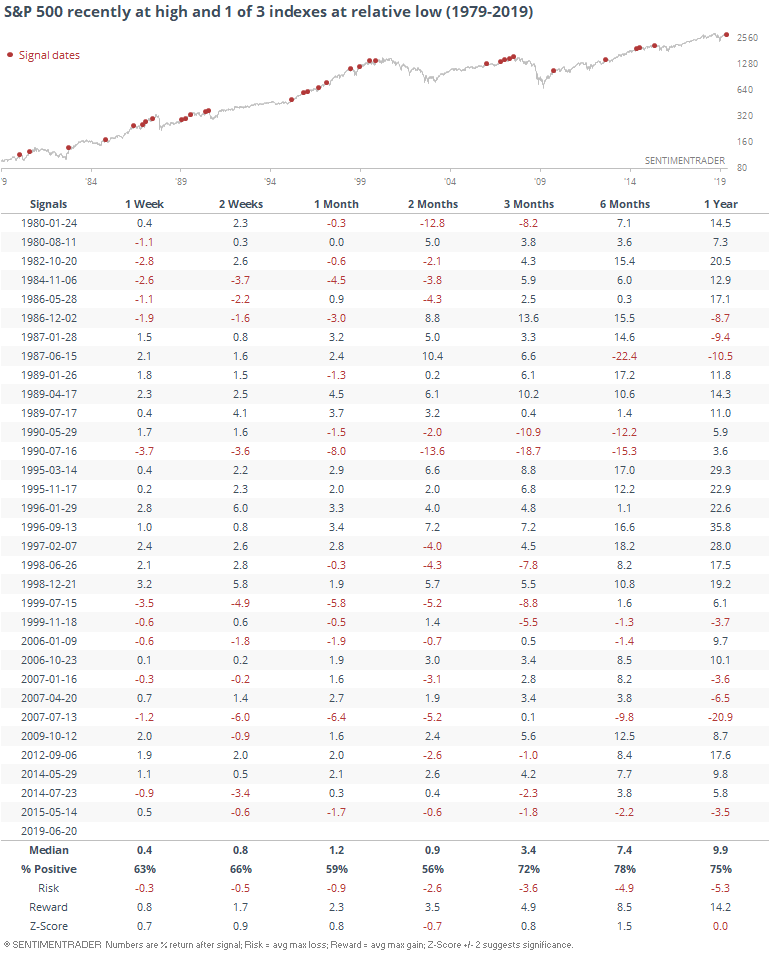
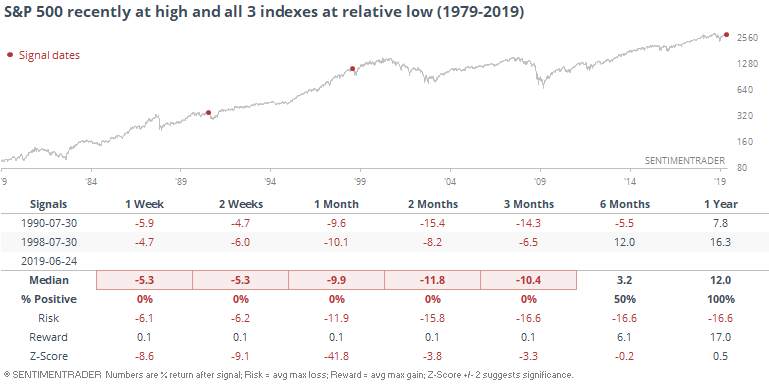
Whenever the S&P 500 recently hit a 52-week high and 1 of the 3 indexes hit a 52-week low, it didn't necessarily augur trouble.
When at least 2 of the 3 indexes hit a relative low, though, it was more cause for concern. At some point within the next 6 months, 4 of the 7 signals saw the S&P drop more than 19%.
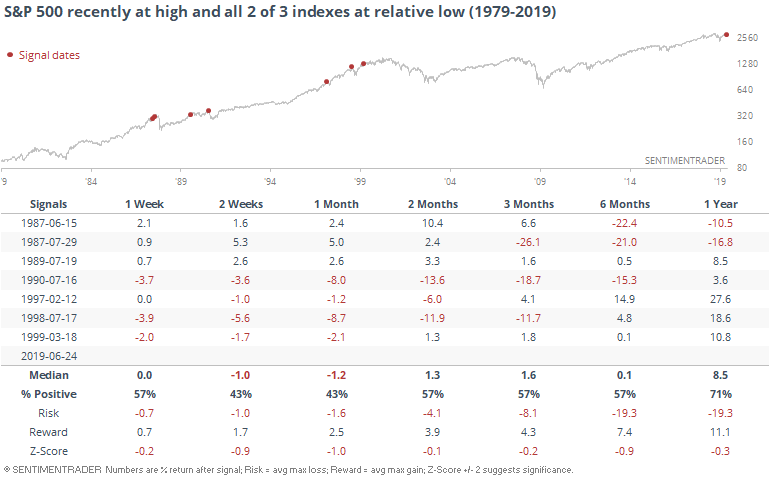
Here's the real kicker, though. This is only the 3rd time ever that all 3 indexes hit a relative low soon after a new high in the S&P itself. And both of the other two were...not good.
We've looked at relative strength between the S&P and broad sectors or assets many times in the past, and it's often an effective guide. When one area of the market is lagging badly, it usually hasn't necessarily led to trouble. We saw that again in the first table above. But when it's spread across more and more areas, the danger level increases.
It's hard to square this with the new high in the A/D Line, which has positive implications. Like we saw within the S&P 500 itself, this is a different kind of "split" market that we haven't really seen many, if any, times before. While it's questionable to say it's a definite negative, this look today is worrying.
Bond Optimism
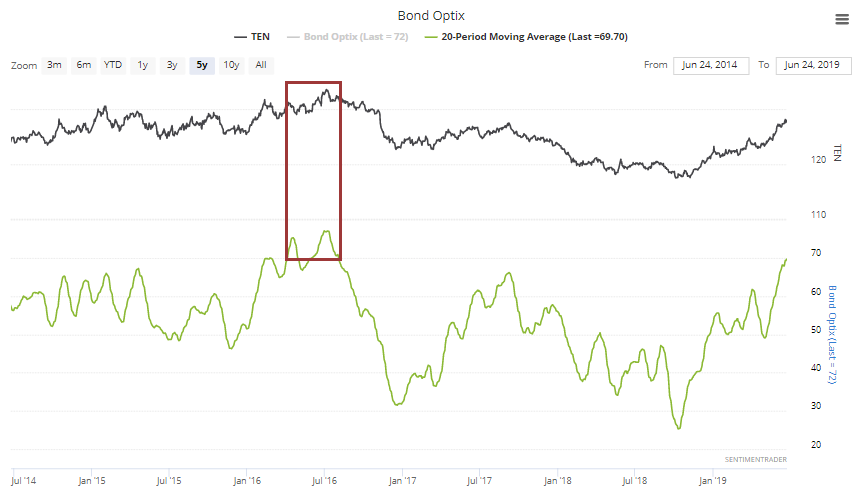
Sentiment on bonds continues to hold steady near extreme territory. The Optimism Index has been hovering near 70% for a month now. In the past 5 years, only the spring of 2016 can match it.
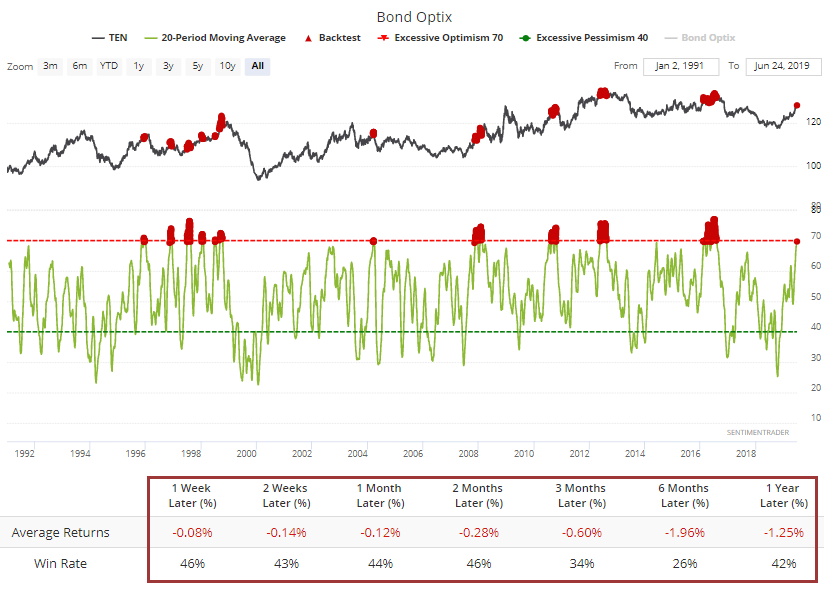
Since 1991, there have been a few periods with such elevated and prolonged optimism, and while Treasuries managed to build on their gains a couple of times, it was a tough slog overall.
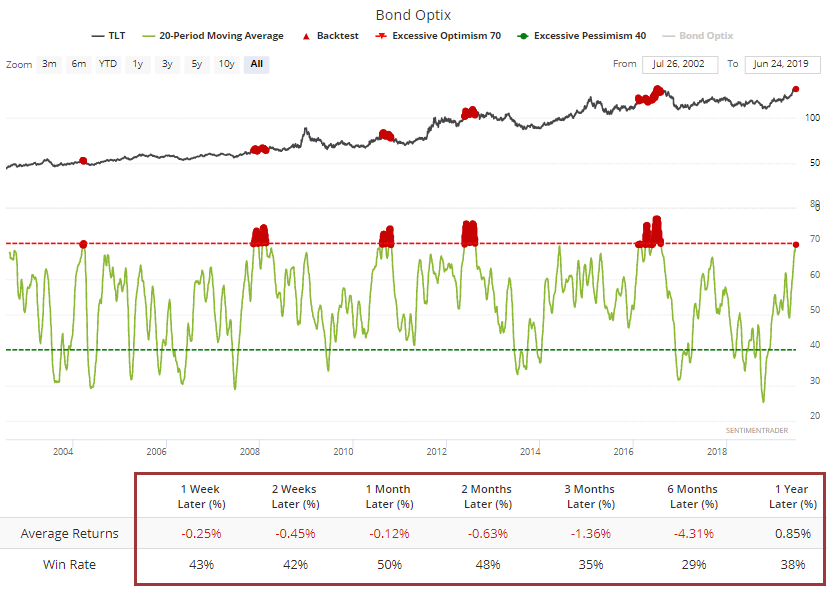
Most of us don't trade 10-year T-note futures, so using a more popular proxy, the TLT fund, returns were still weak.
Other parts of the bond market, like corporates, did much better than Treasuries when sentiment was at this kind of extreme.
All Aboard
It's kind of odd that panic-type assets like gold and bitcoin are showing such high optimism even while stocks hover near their highs.
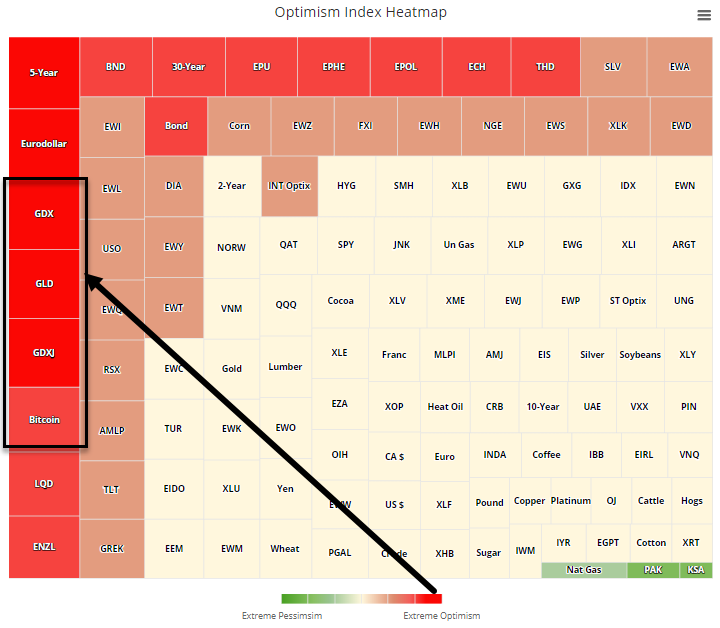
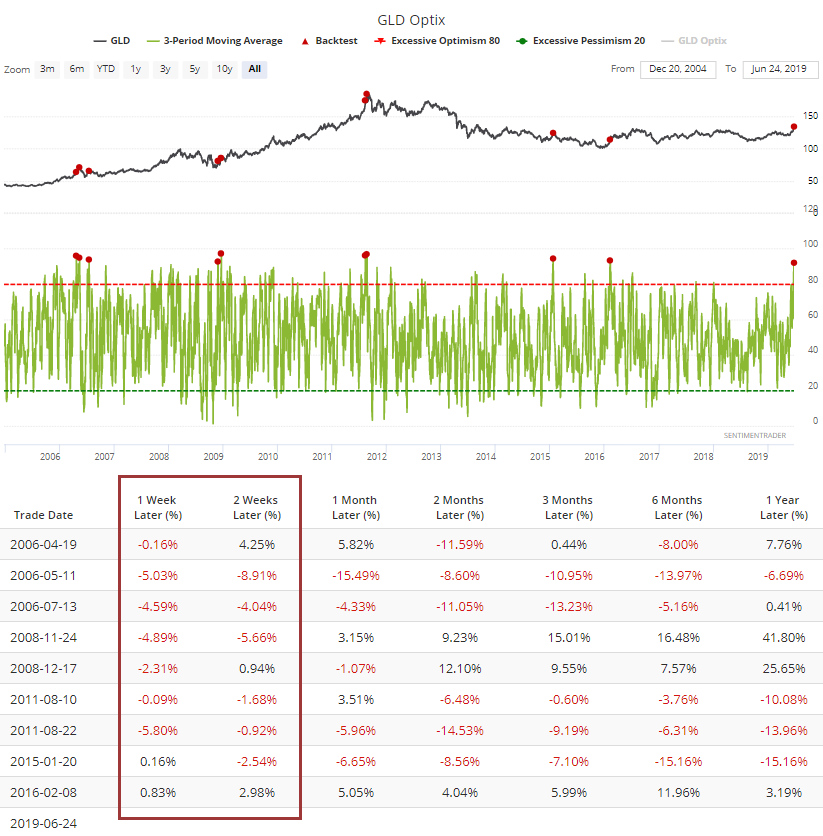
Adding to the evidence that gold bugs have to hope "this time is different," the Optimism Index on GLD has averaged greater than 92% over the past three sessions. That hasn't happened since 2016.
Since the fund's inception, it has really struggled to hold its gains over the next 1-2 weeks in particular.
Optimism on the gold miners has also spiked.
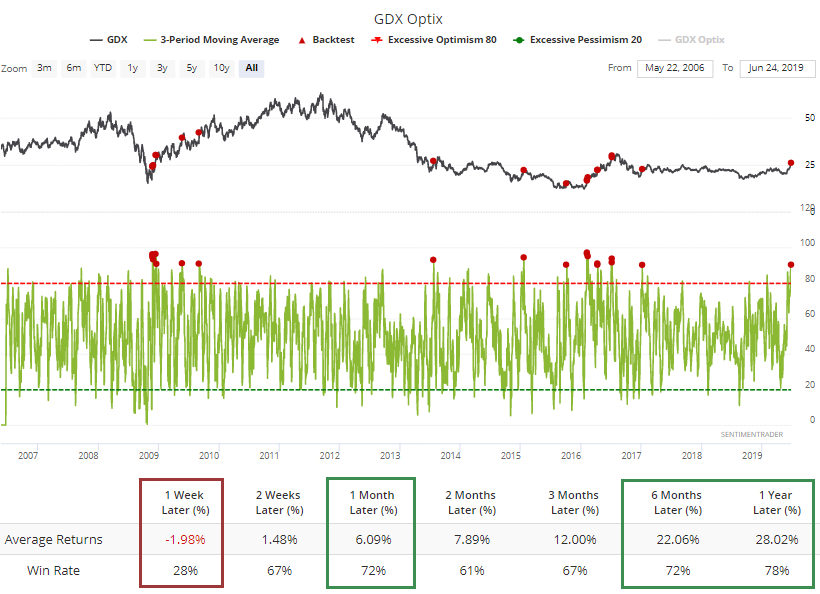
The interesting thing here, though, is that while they really struggled short-term, longer-term they tended to rally. That's saying something for a sector that has performed so poorly for so long.
Most of these signals clustered in early 2009 and mid 2016 when they were going on a nice run, so bulls should hope that after a brief respite, we get another round of buying enthusiasm like those periods.
Hedging Activity
Over the past year, ETF traders have used inverse funds to protect against potential downside. When volume in these funds spike, it shows high concern about a decline, and has been a good contrary indicator.
In recent days, Monday in particular, they've not found the need for so much protection. Volume in inverse ETFs dropped below 0.25% of all volume. Over the past year, this has been a mild warning sign.
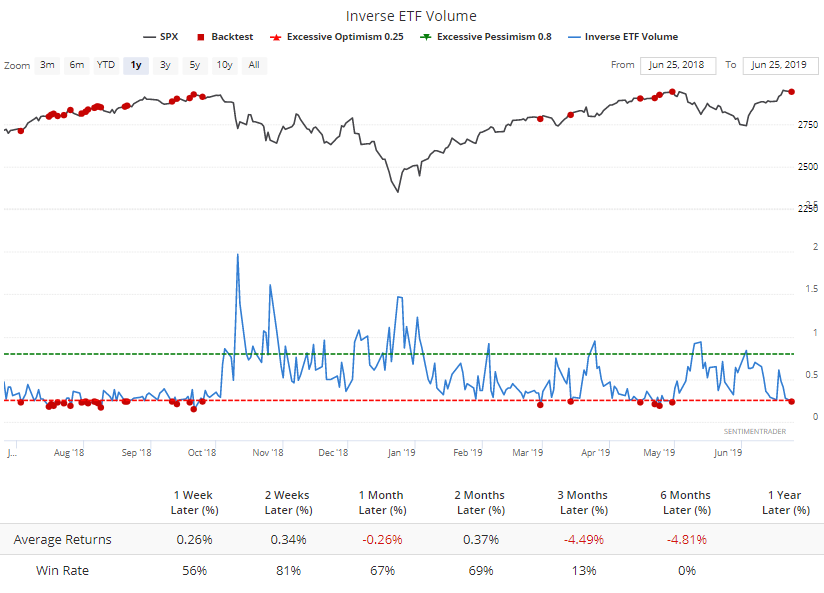
It's important to note that prior to the last year, readings below this level were common, and not a negative. So if we're heading back into an environment of generally less risk, then we'll likely continue to see inverse ETF volume levels at its current pace or below.