Tuesday Color - Tech's Recovery, Gold Loss, Sector Breadth, Semi's, Japan's Surprises

Here's what's piquing my interest as traders start to drift away ahead of what is likely to be an extended holiday weekend.
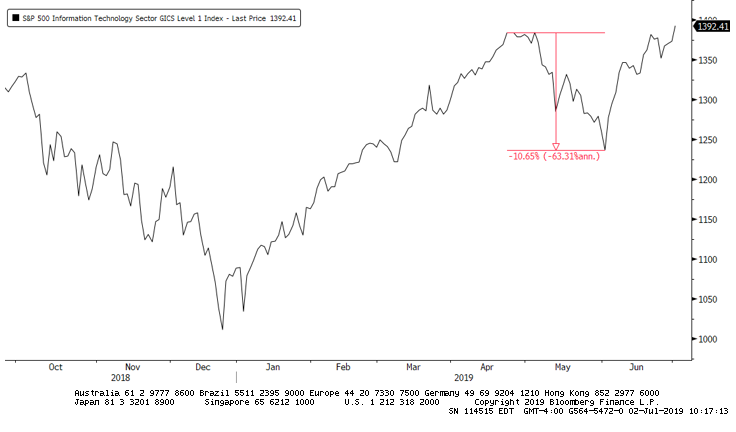
Tech Recovery
The WSJ notes that the S&P 500's tech components have reached a new high for the first time in months, erasing the 10% correction from May.
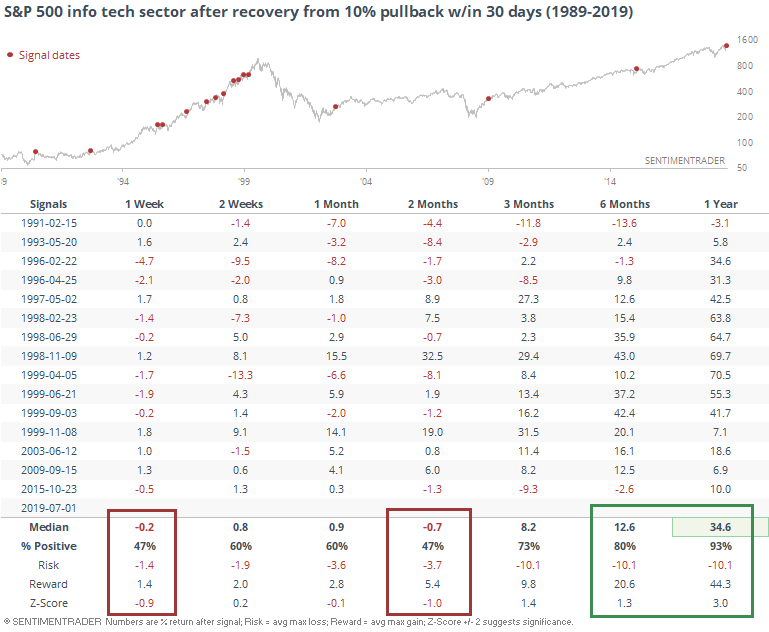
This is one of the sector's quicker recoveries, which happened frequently in the year(s) leading up to the bursting of the tech bubble. It has been a mixed blessing, especially shorter-term. Longer-term, though, mostly a good thing.
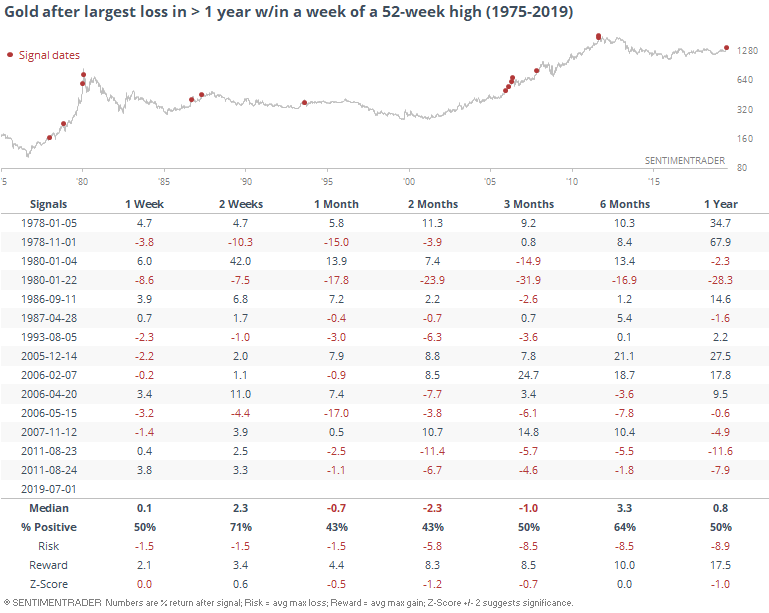
Gold's Non-Recovery
Gold has been trying to recover, recently hitting multi-year highs. It got a lot of attention - probably too much attention - and has since slid back.
Monday's loss was the largest in well over a year.
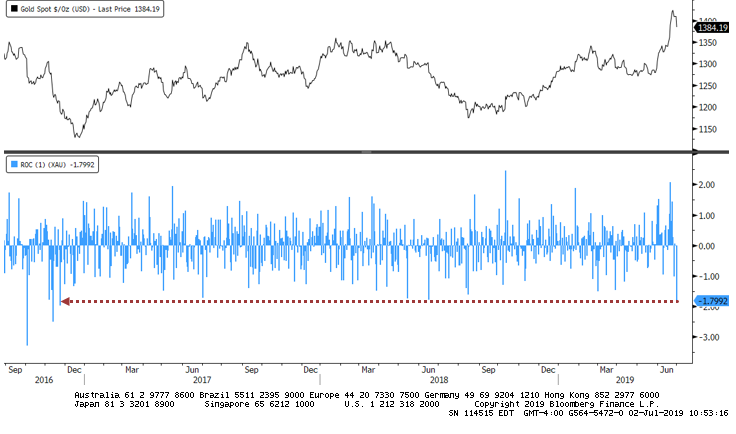
Other times it suffered such a large loss so close to hitting a 52-week high, sellers tended to continue their push over the next 1-2 months.
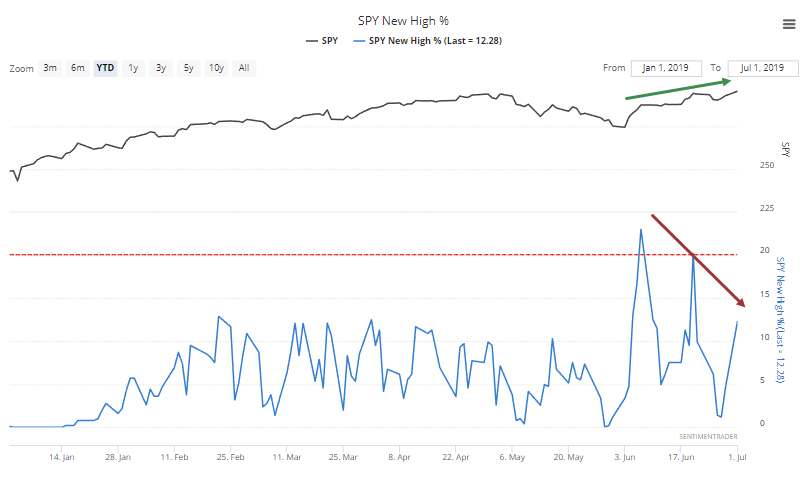
Breadth Review
While stocks jumped to new 52-week (at least) new highs on Monday, fewer stocks went along for the ride. Within just the S&P 500, fewer than 15% of stocks reached a fresh high along with the index. That's down from more than 20% a month ago.
That's always assumed to be a bad sign, a negative divergence. But divergences are tricky beasts, and should be quantified to see if they've been effective warning signs in the past. Some of them are, and others aren't. This is one of the latter.
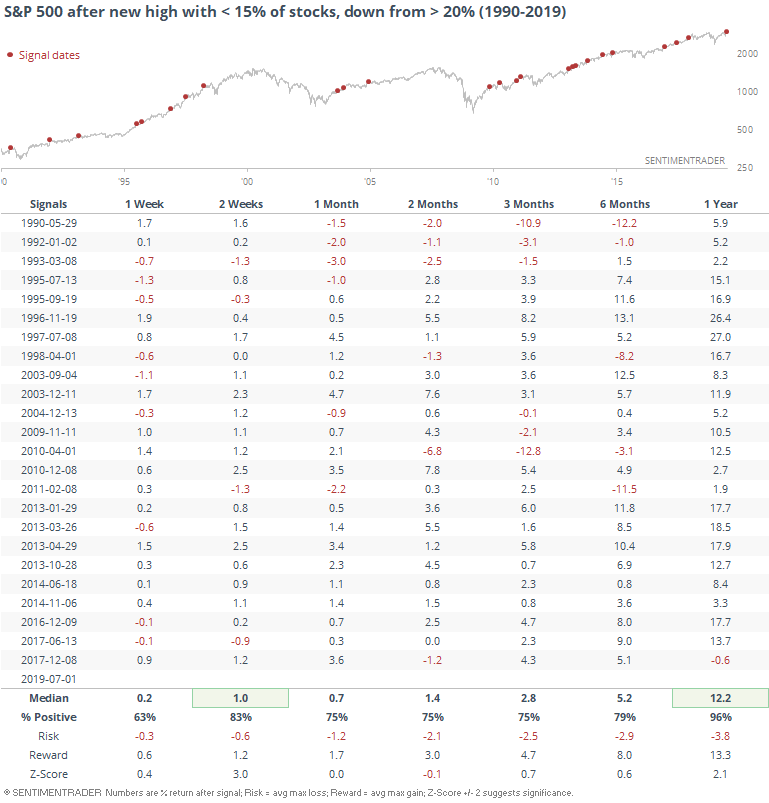
Out of 24 similar divergences, only 2 led to meaningful downside within three months. It wasn't effective as a warning sign on any time frame, especially shorter-term and longer-term, with an almost unblemished record of higher prices a year later.
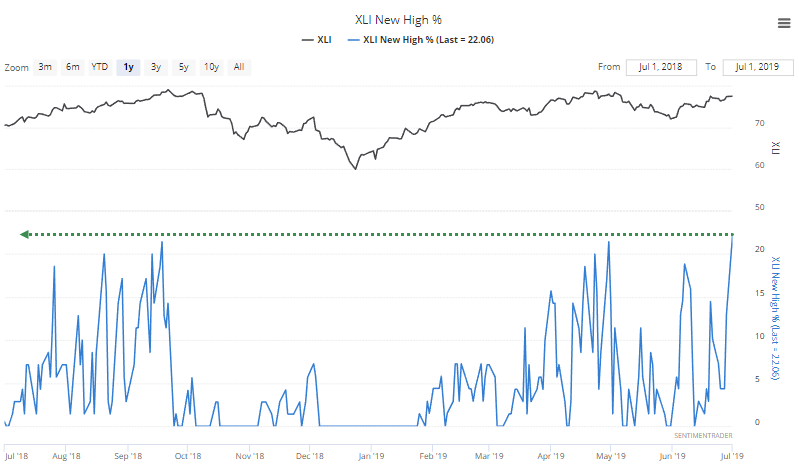
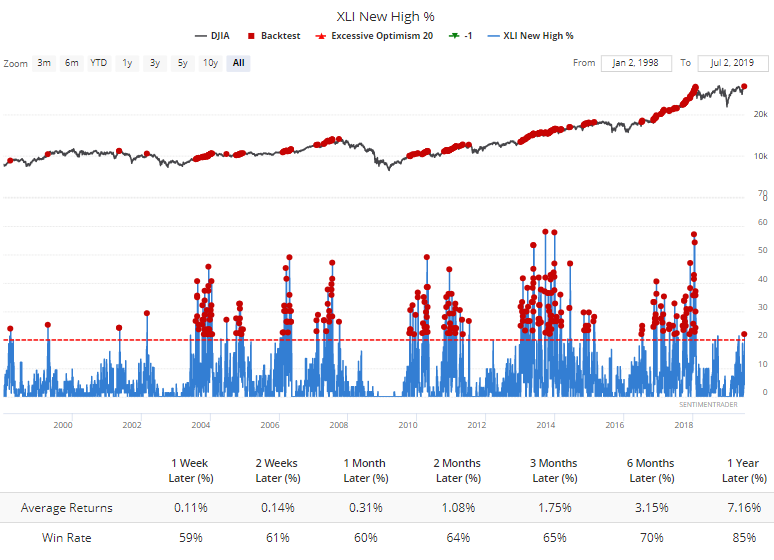
For industrial stocks, there was no such issue. More than 22% of them hit a new high, the most in over a year.
For some (most) sectors, more new highs aren't necessarily a good thing, since it shows over-eager buying pressure. Forward returns in the DJIA with a large number of new highs among industrials were "meh."
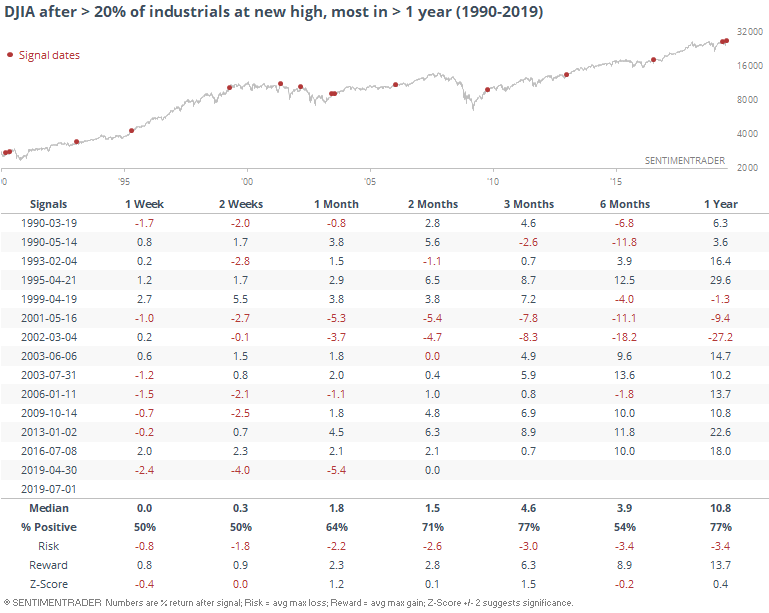
If we only look for the first instance in more than a month, and also require that it be the new new highs in at least year, again returns were mediocre. It triggered in April right before a 5% pullback.
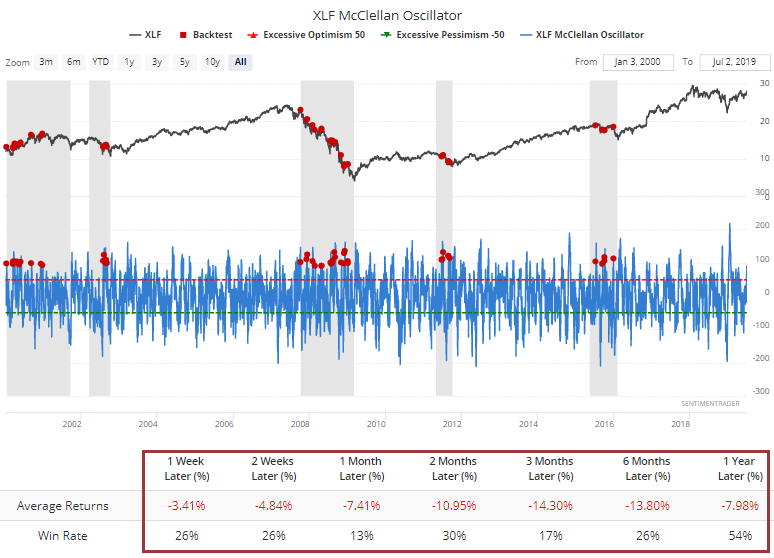
There has also been good buying pressure in financials, enough to push the McClellan Oscillator above 90, its highest since January.
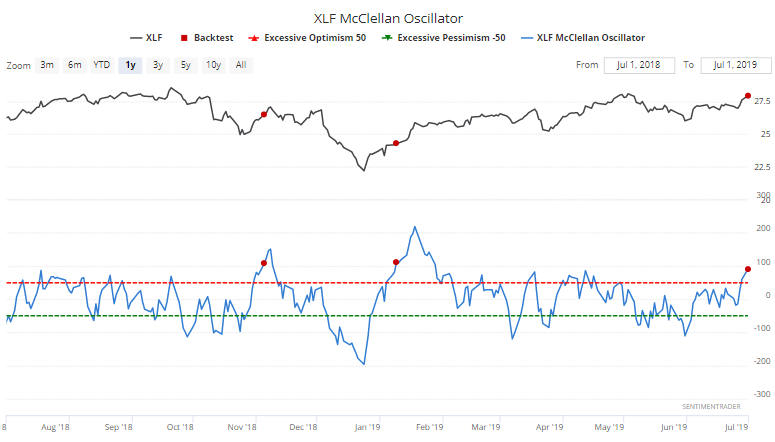
When this kind of a push triggers during a bull market environment, XLF has done well over the medium-term.
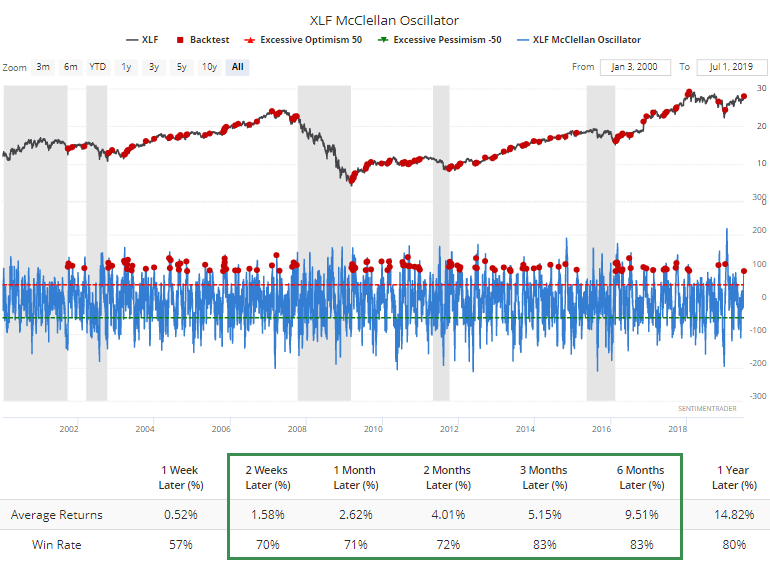
During bear markets...oof.
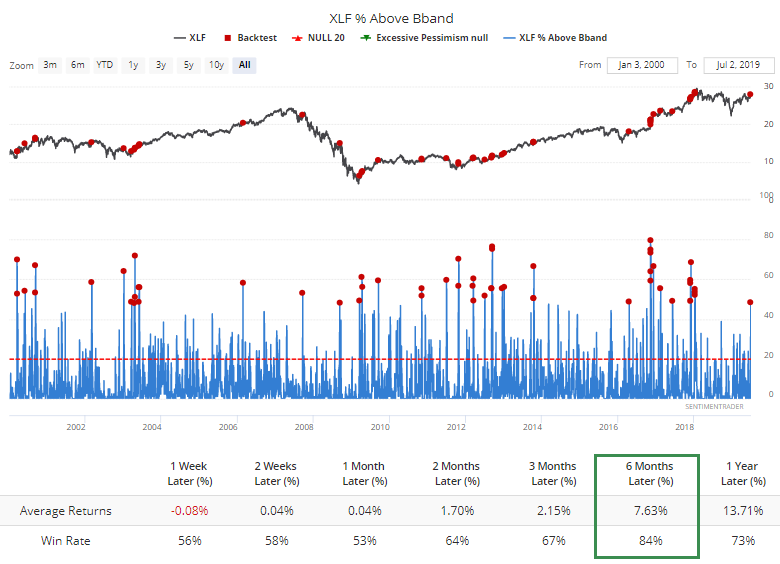
Nearly half of financials popped enough to trade outside their upper volatility bands. Regardless of market environment, this has been a good longer-term sign of intense and widespread buying interest.
On the Nikkei, there was also a big jump in the number of stocks trading outside their bands. This has been a good sign for that market, especially when it comes after a protracted downtrend instead of when the index is sitting at new highs.
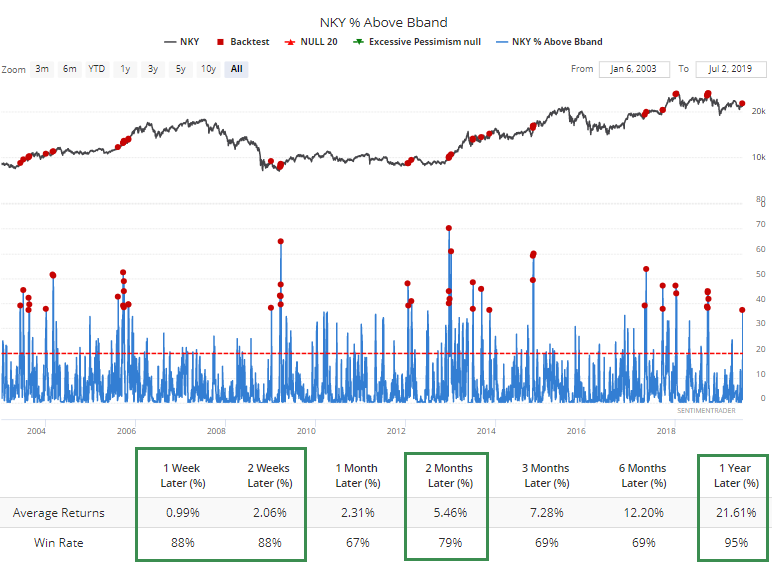
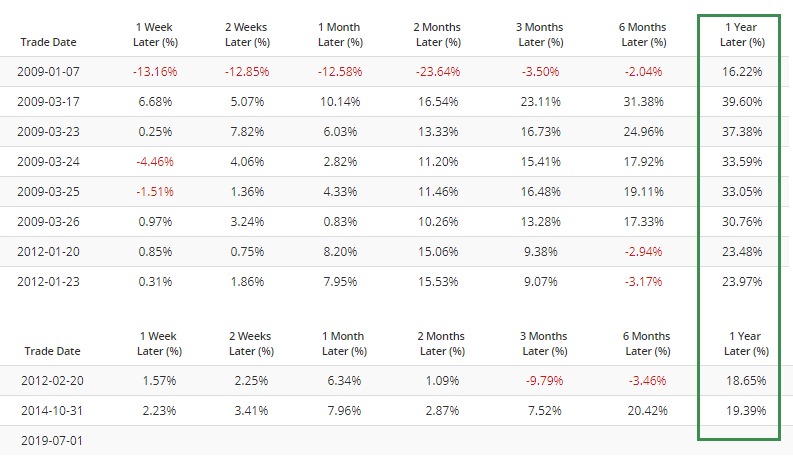
Following are the returns when this many stocks in the Nikkei trading outside their bands while the index was either below or above a downward-sloping 200-day moving average, which it is now. There was some big downside volatility as the index emerged from the financial crisis, but other than that, returns were very good.
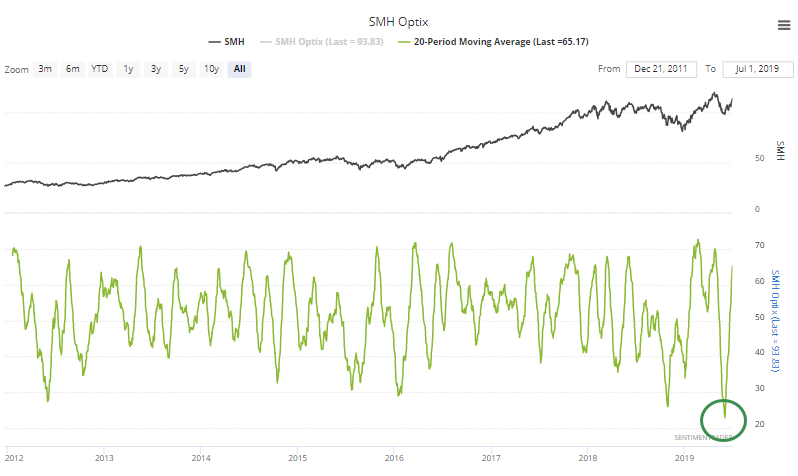
Semis
The 20-day Optimism Index on SMH is quickly recovering from its most pessimistic reading in at least 7 years.
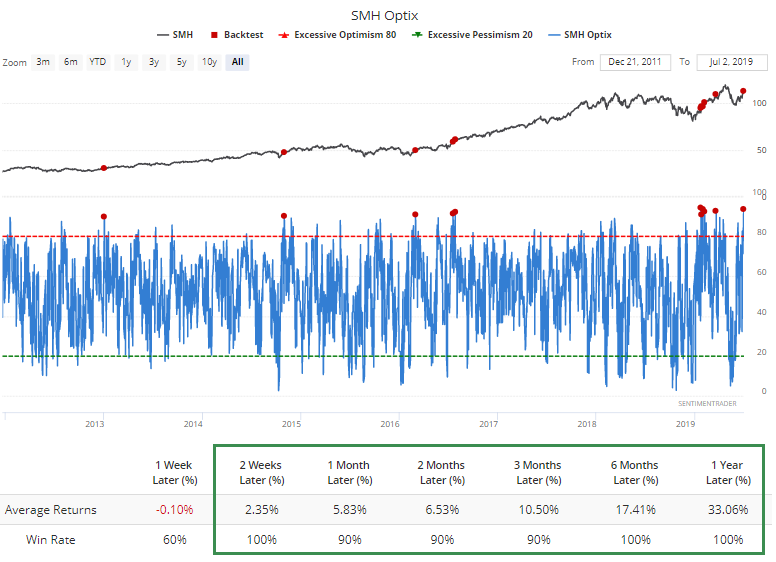
In returning, buyers pushed the Optix above 90 for one of only a handful of times. Bulls should hope that this time is not different, since the fund continued to rise over the next 2 weeks every other time it got this high.
Seasonality
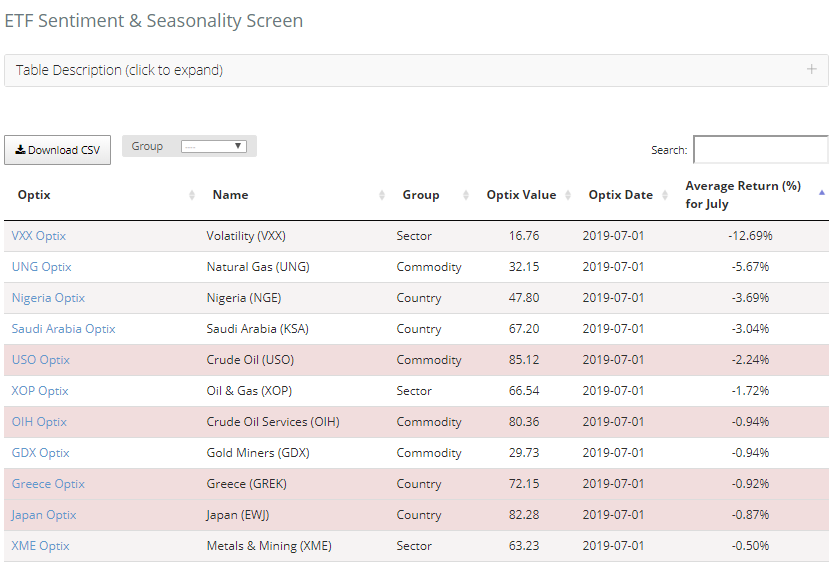
As a new month begins, it can be useful to scroll through the seasonality screens to see if there are any ETFs or commodities currently showing a sentiment extreme that is counter to its typical seasonal pattern.
Among ETFs, there are a few that have shown poor July returns yet currently have high optimism (highlighted in red).
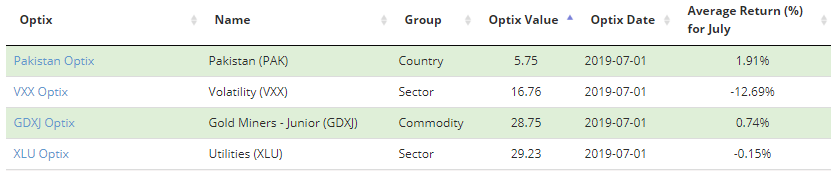
Only two show the opposite.
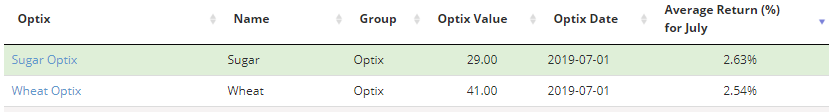
Among commodities, only unleaded gas is showing high optimism during what is usually a weak time of year.
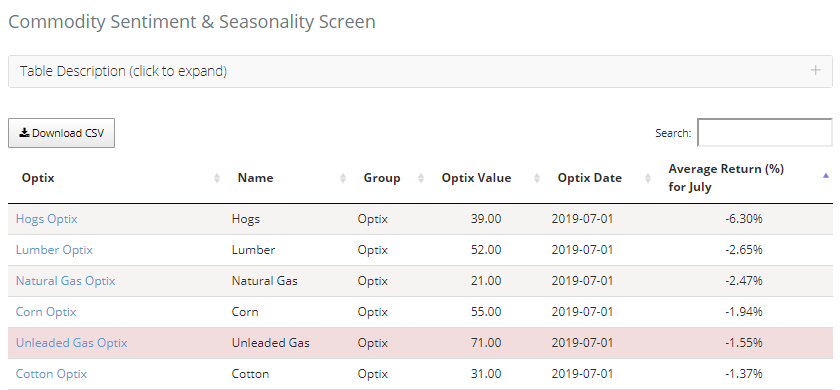
Sugar is showing the opposite.
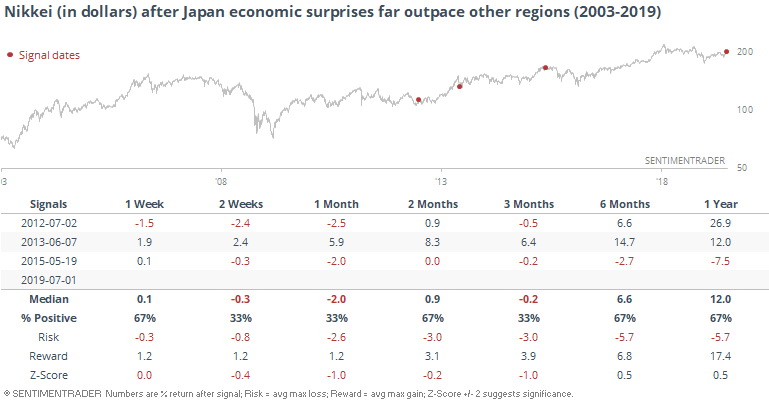
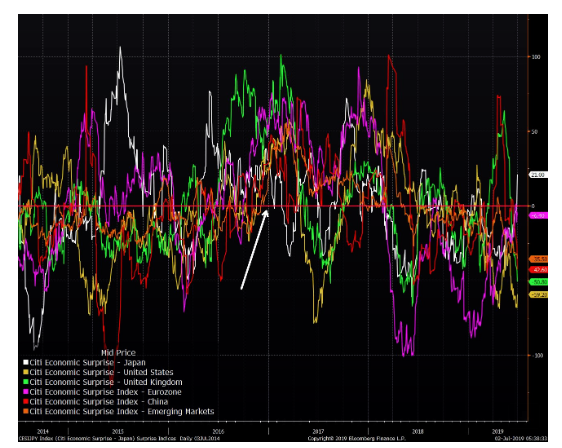
Go Japan!
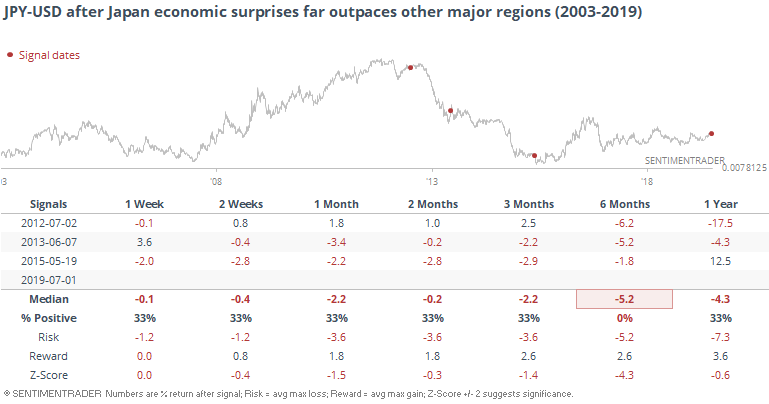
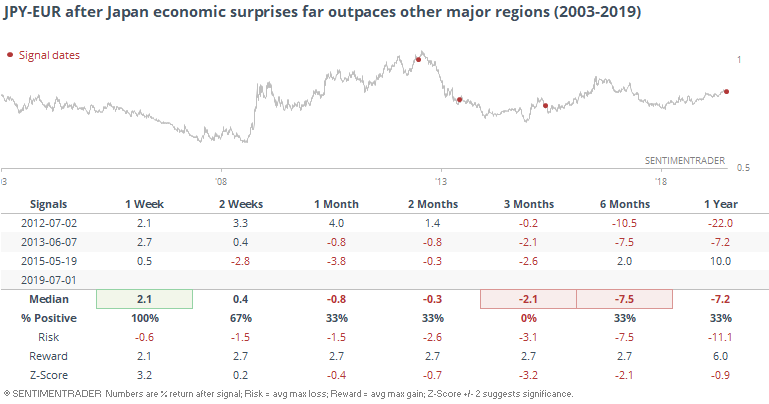
Bloomberg notes that among major economies or regions, Japan's economic surprises are far outpacing everyone else.
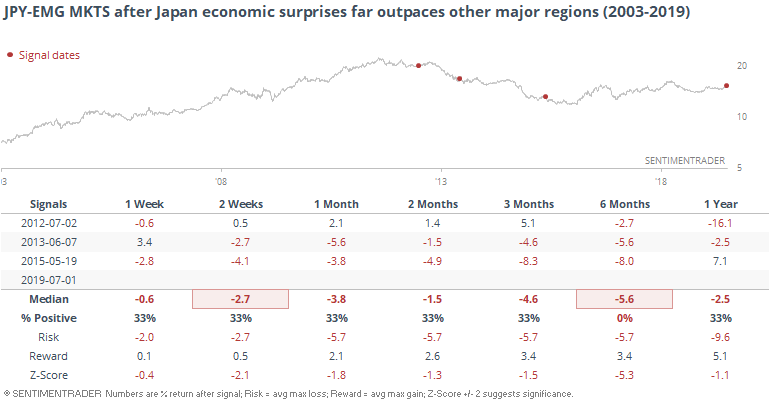
We've already seen how the U.S. is lagging Canada, and everywhere else, and Japan is the alter ego. Following, we can see how the yen fared against other major currencies after the only other times this has happened. Not too spiffy.
For Japanese stocks (in yen), it was a mixed picture, with two gains and one loss.
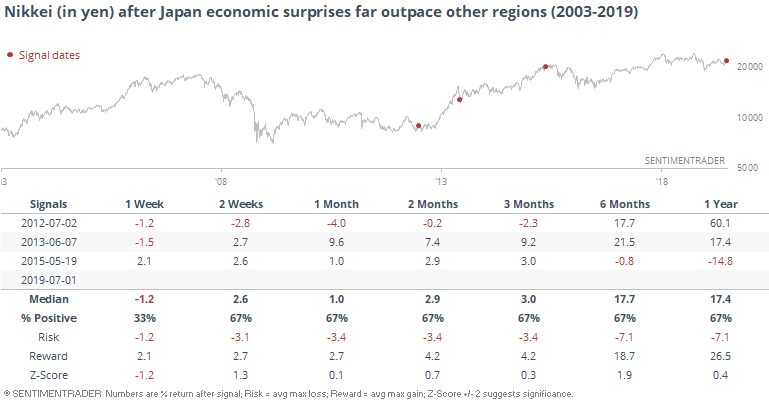
When expressed in dollars, one of those gains turned into a loss.