Tuesday Color - Value's Back, Small Business Outlook, Euro Banks, Index & Gold ETF Flow

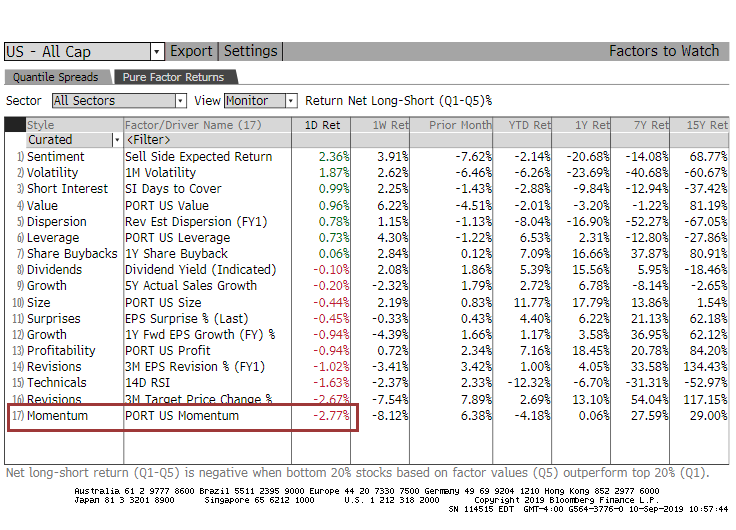
Here's what's piquing my interest so far today as momentum stocks once again fare poorly.
Value's Back
The trash bin is overflowing with proclamations that finally value stocks are about to have their moment in the sun. They've lagged growth stocks so badly, and for so long, that sentiment seems to have shifted in recent months to the potential that maybe historical relationships no longer work.
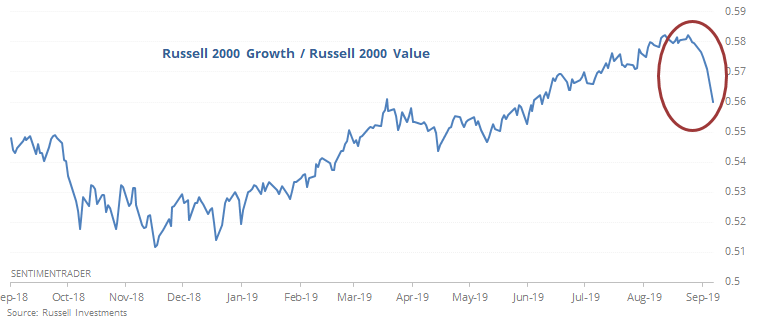
Yesterday, that flipped. We saw in the report that Monday's session was marked by a historic shift in momentum, with YTD winners dropping heavily and YTD losers gaining. Because most of those winners were growth stocks, and most of the losers value stocks, there has been a big shift in that ratio as well.
Like we saw with the momentum shift, a change like this raises fears that stocks may no longer be powered by the growth stocks that have been leading, triggering weakness in the overall market.
To see if this has been a consistent reason to worry, the table below shows S&P 500 returns after every time when the Growth/Value ratio fell more than 2% from a 52-week high that it had achieved within the last couple of weeks.
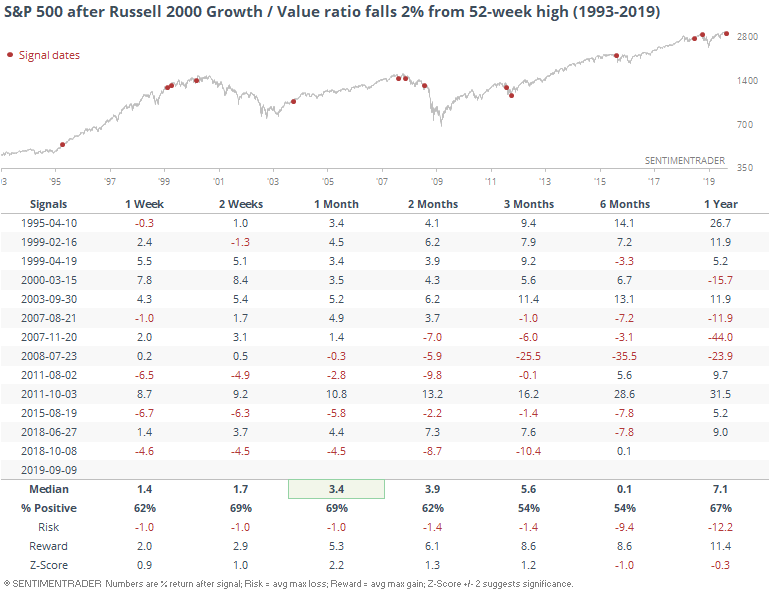
It wasn't a good reason to sell stocks in general, with the S&P 500 rising nearly 70% of the time over the next month. A few of those turned sour, though, over the next few months.
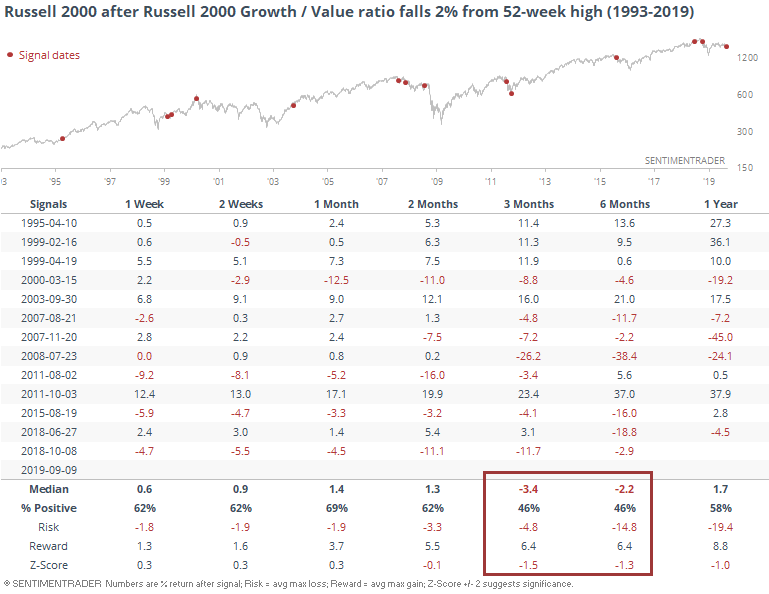
For the Russell 2000, it was more of a medium-term concern.
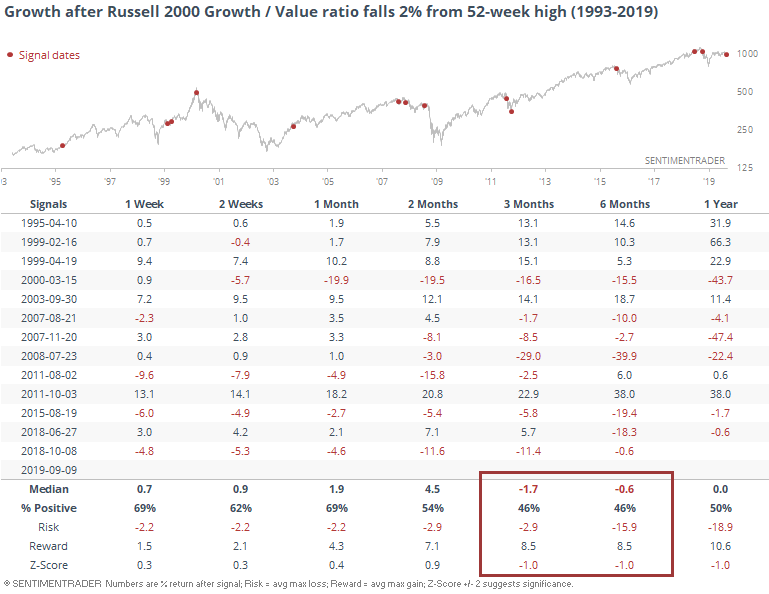
The growth stocks within the Russell also showed more weakness than strength over the medium-term.
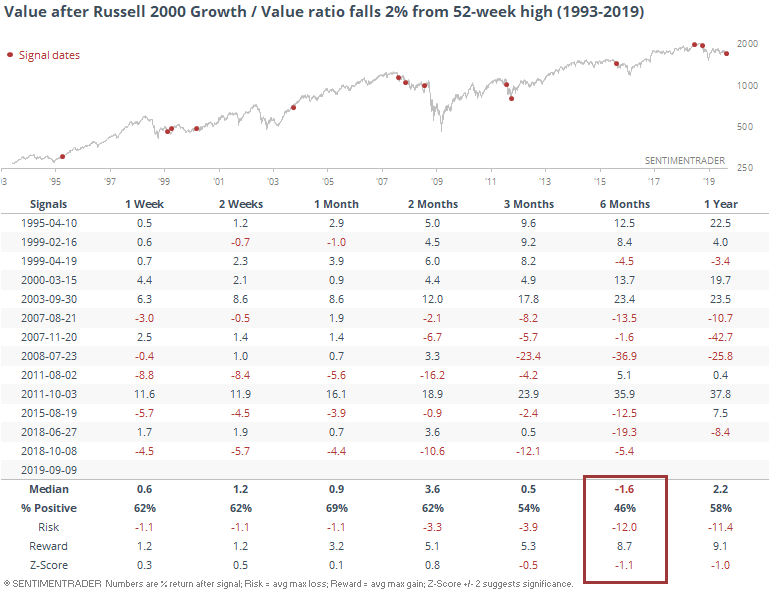
Value stocks held up a little better, a little longer, but even they showed more losses than gains over the next 6 months.
Overall, this sudden and meaningful shift in the market's underlying dynamics may be part of a bigger change, but it's way too early to tell. From the reversal that has happened so far, previous instances haven't been an immediate warning, but is slightly concerning on a medium-term time frame.
Sliding Optimism
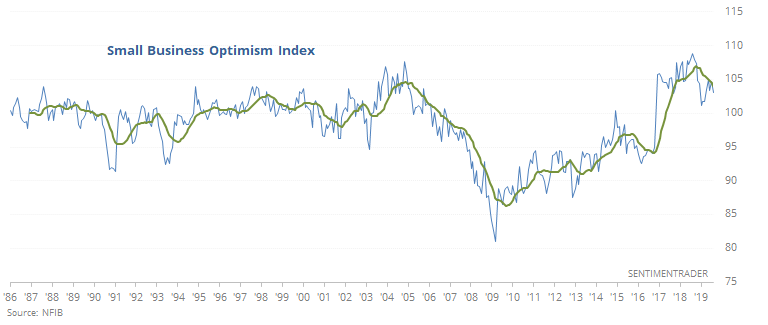
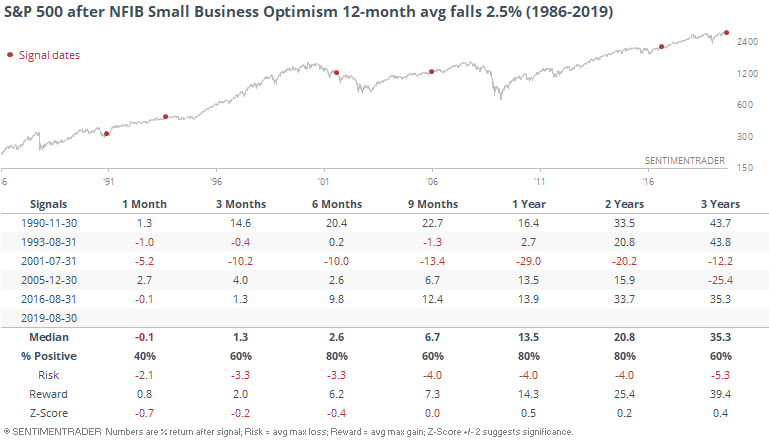
Maybe small business owners have been on the leading cusp of signaling a looming slowdown. The NFIB just released their latest Small Business Optimism survey through August, and it showed still-high-but-declining optimism. The 12-month average continues to slide.
It hasn't really been a consistent worry for the broader stock market, with the S&P 500 rising 3 or 4 times and dropping once or twice over the medium- to long-term.
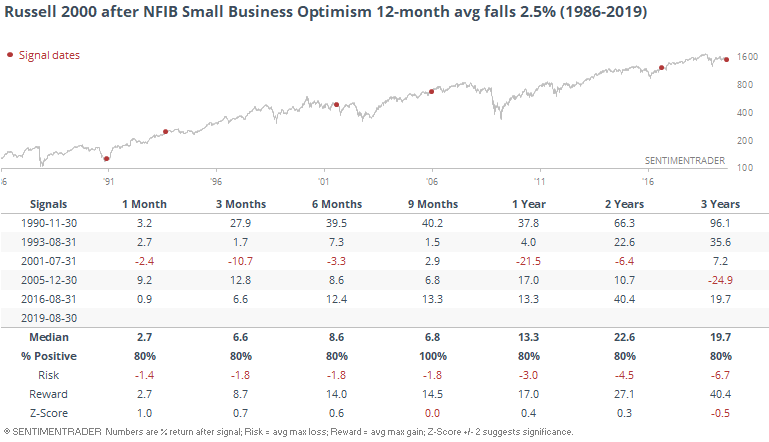
It was even less of a worry for the index that should have the most exposure, the Russell 2000.
Perhaps more of a worry is what Troy pointed out, that the surveys more related to personal finances are showing so much less optimism than those focused on the economy in general. It's still too early to know if this is a negative yet, since we don't know if the data has bottomed.
Banking Boom
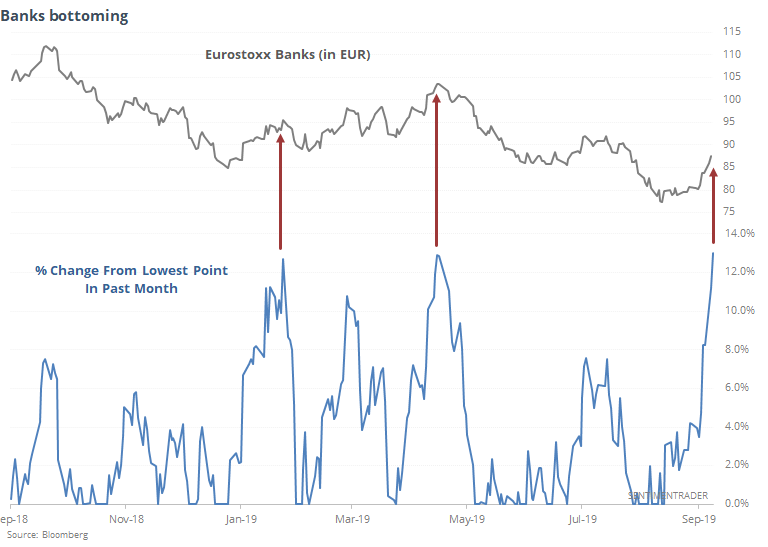
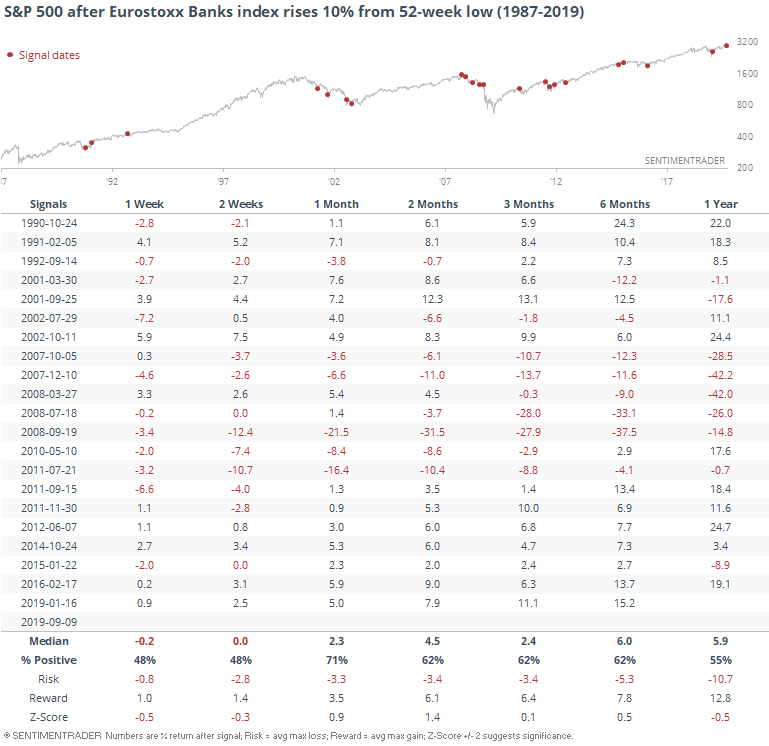
Among other evidence of a sudden dash to trash is the rally in European banking shares. They have been an off-and-on concern for global markets in recent months, but those concerns have gotten a reprieve over the past couple of weeks. The Eurostoxx Banks index has jumped more than 10% from its low.
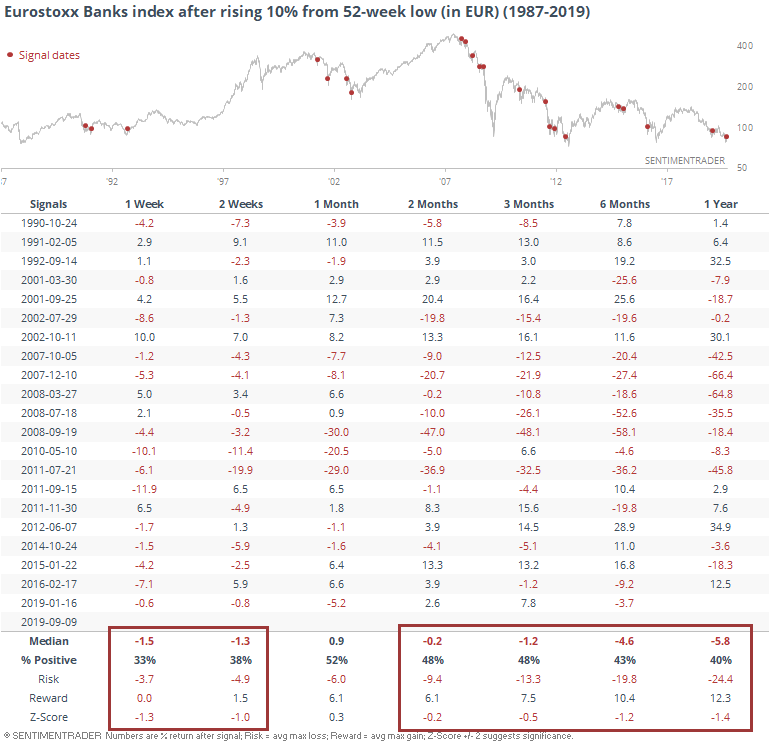
The other two times it did this so far in 2019, they peaked immediately, so buyers have to hope this time is different. Longer-term, the evidence on that score doesn't really favor the optimists.
Just for fun, here's how the S&P 500 responded. No real bias.
Index Flow
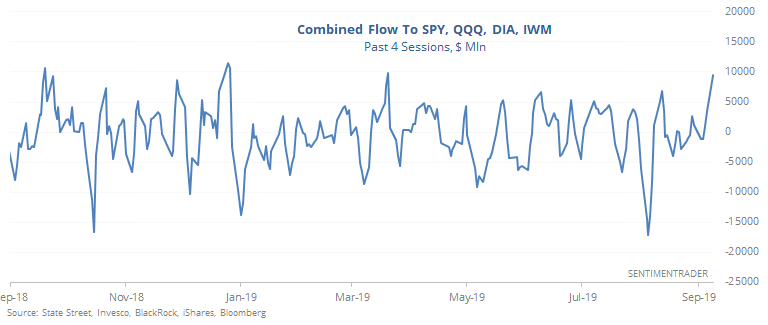
Are traders finally jumping in? Looking at flows to the major index ETFs, it seems so. For only the 2nd time this year, more than $9 billion has flowed into SPY, QQQ, DIA, and IWM over the past four sessions. That's one of the largest gulps in the past year.
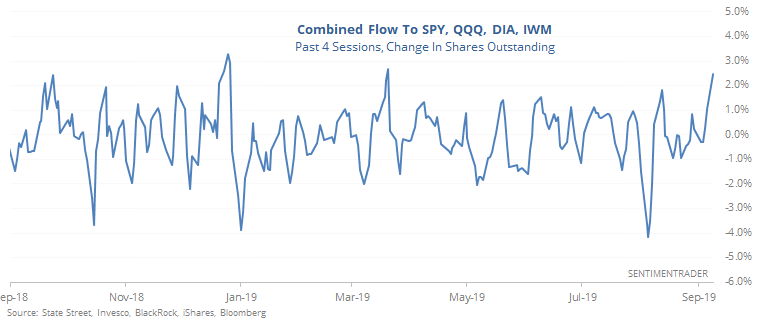
That has increased their shares outstanding by more than 2.5%.
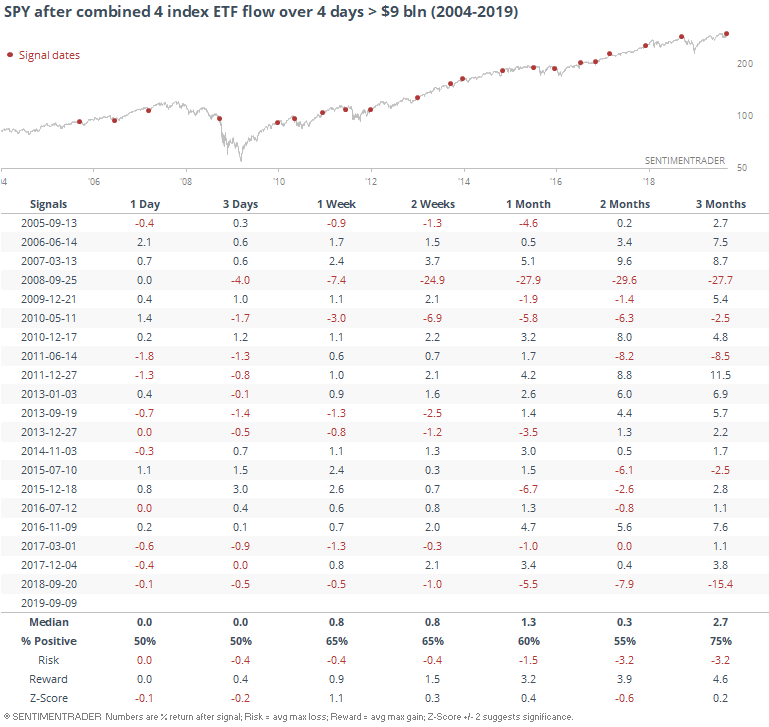
There was a surge like this right as stocks peaked last September, which seems like an obvious warning sign in hindsight. To see if it's a consistent worry, the table below shows every time since 2004 when the four funds saw at least a $9 billion inflow over 4 sessions for the first time in at least 3 months.
The funds have gathered assets over the years, so looking at the absolute level of flow can be misleading. If we instead look at the change in share count, the current surge becomes quite a bit more unusual.
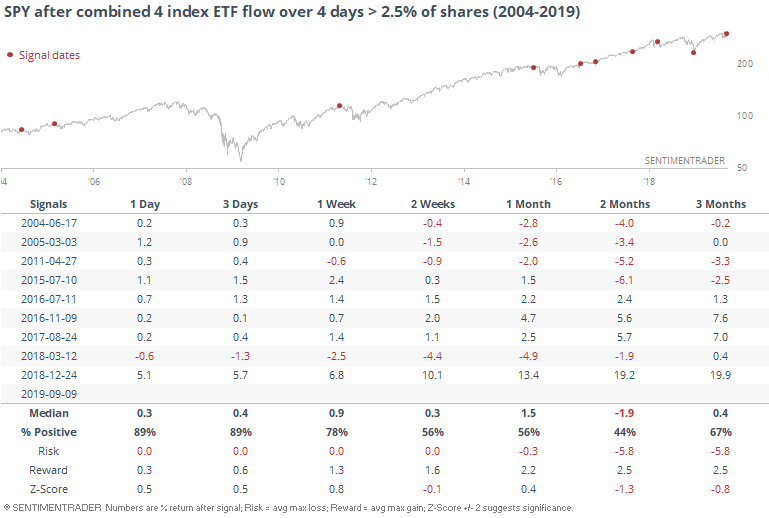
Again, though, it was not a consistent boogeyman for stocks. It did trigger at a few peaks, but also before a few rallies. On a micro basis like this, fund flows can be hard to use because they aren't very consistent. Likely that has something to do with shorting activity distorting the flows, but whatever the reason, the current influx of cash to the big 4 index funds doesn't look like a compelling negative.
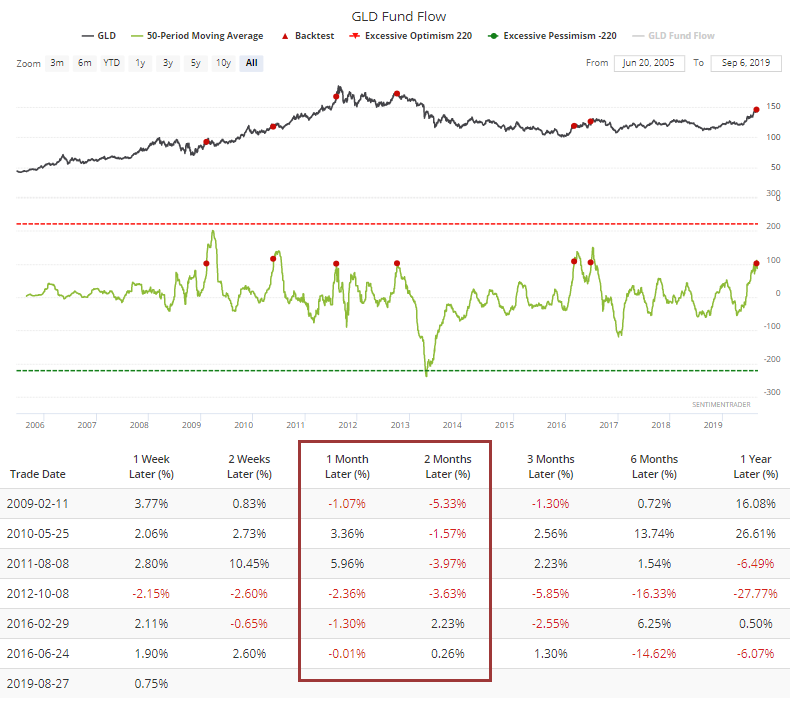
On the other end of the spectrum, traders have been leaving the GLD gold fund for the first time in a while. Over the past 3 sessions, it has averaged an outflow of more than $200 million per day, relatively rare when trading above its 200-day average.
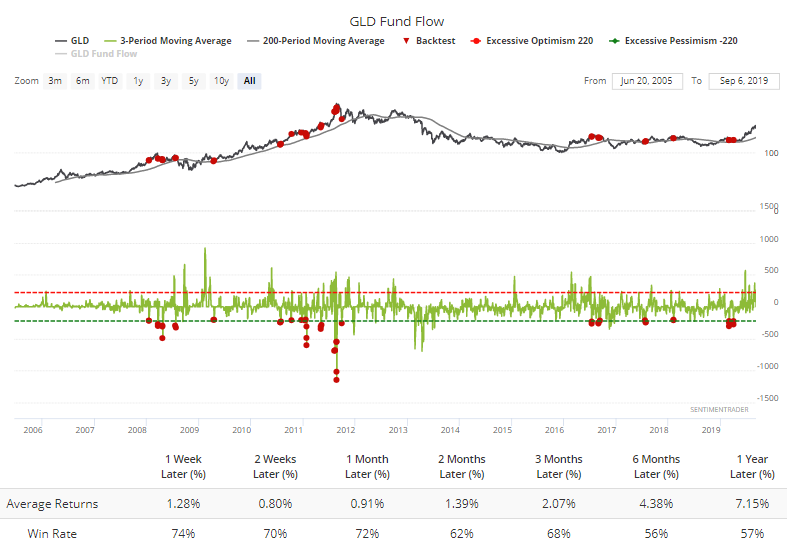
Its future returns were pretty good after the other outflows. The problem? There has been a steady inflow over the past couple of months, as it averaged a rise in assets of more than $100 million per day over the past 50 days, something that has led to a more prolonged digestion period the other times.