
Two more favorable points of light for stocks

Key Points
- Human nature is the one thing that never changes
- Fear and greed are in a never-ending battle in the financial markets
- When fear becomes overdone, markets tend to react positively
- The key is objectively identifying when fear has become overdone and when that condition is reversing
NASDAQ McClellan Summation
The Summation Index is based on work pioneered by Sherman and Marian McClellan and is carried on by their son Tom. It is a longer-term look at the momentum of the underlying breadth of the market, adding each day's McClellan Oscillator reading to the day before. Momentum is positive when it is above zero; below zero, it is negative. It also works as an overbought/oversold indicator when it pushes above +500 or below -1000.
With many overbought/oversold, the catch is that one never really knows "how low is low" until after the fact. As a result, buying in at the first sign of a slightly oversold condition can result in the proverbial "trying to catch a falling safe" as the market continues to plummet to its ultimate bottom. Therefore, an alternate approach is waiting for signs of a reversal of an oversold condition before jumping in. That is the approach we will take for this test.
A cross above -1200
The red dots in the chart below highlight those days when the NASDAQ McClellan Summation index crossed back above a reading of -1200. You can run this test in the Backtest Engine.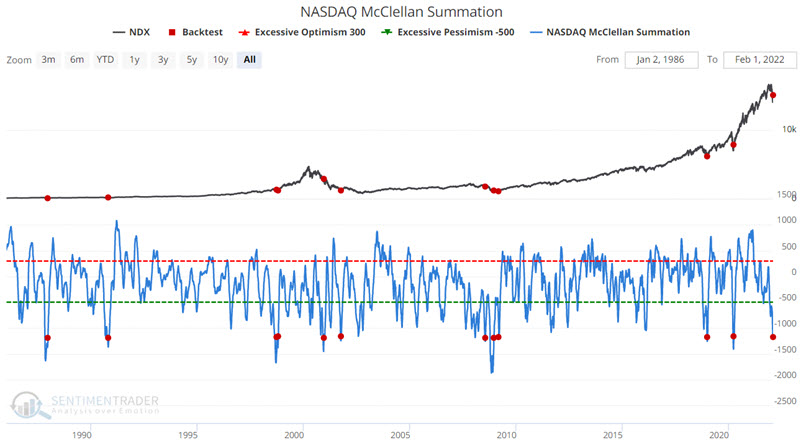
The table below displays a summary of Nasdaq 100 Index (NDX) performance following the dates highlighted in the chart above.
NOTE: The latest signal was triggered at the close on 2/1/2022.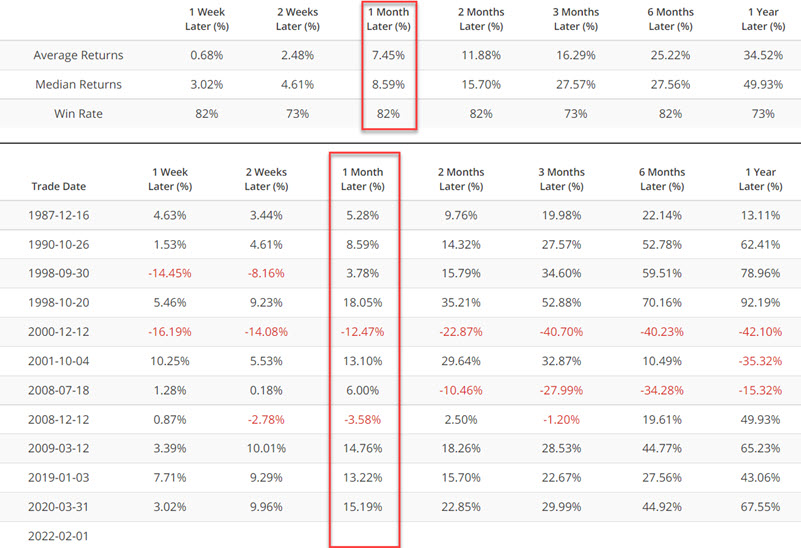
Of particular interest is the performance 1-month after each signal - with an 82% Win Rate and a Median Return of +8.59%. The chart below displays the hypothetical growth of $1 invested in NDX for one month after each signal.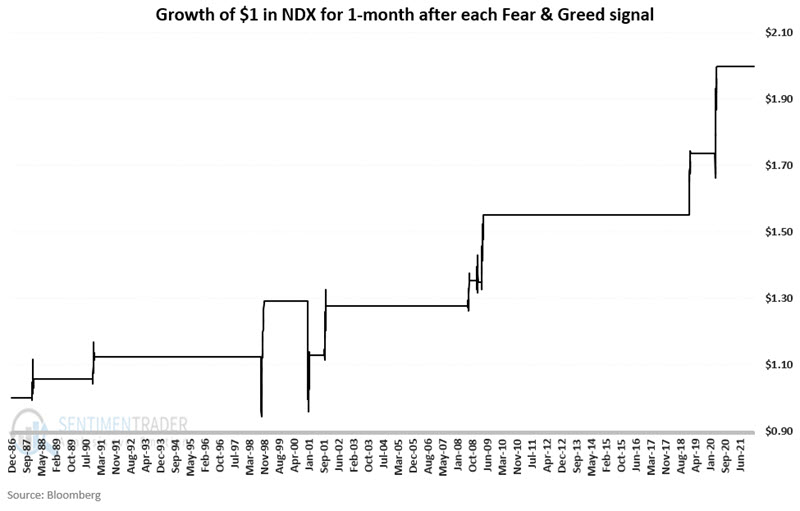
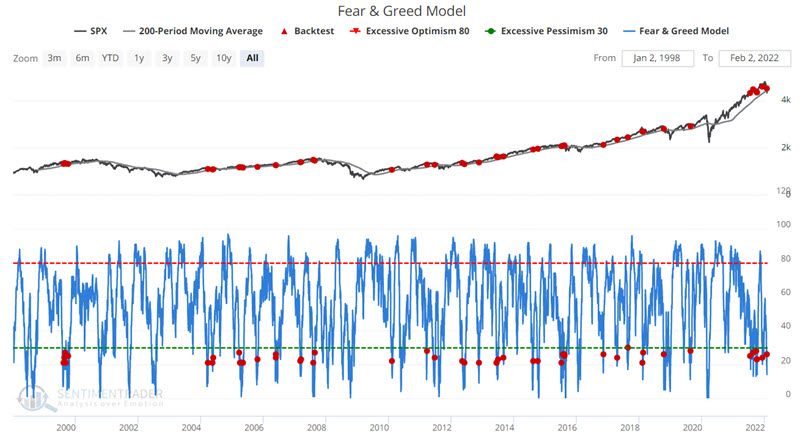
Fear and Greed Model
The Fear and Greed Model is based on CNN's published on their public website (we suggest you visit their site to learn more about the model). This is our model calculation based on the inputs discussed on their website. It does not reflect the values published by CNN. Instead, it is our interpretation of the model.
For this test, we will use the Fear and Greed Model in the same way we did with the NASDAQ McClellan Summation index - by waiting for a reversal from an oversold condition.
The red dots in the chart below highlight those days when the Fear and Greed Model crossed back above 20 while the S&P 500 Index was above its 200-day moving average. You can run this test in the Backtest Engine.
The table below displays a summary of Nasdaq 100 Index (NDX) performance following the dates highlighted in the chart above.
NOTE: The latest signal was triggered at the close on 1/31/2022.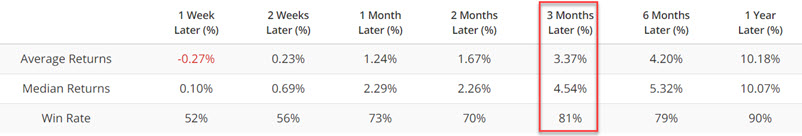
Of particular interest is the performance 3-months after each signal - with an 81% Win Rate and a Median Return of +4,54%. The chart below displays the hypothetical growth of $1 invested in SPX for three months after each signal. NOTE: If a new signal occurs within three months of a previous signal, the holding period is extended for another three months.
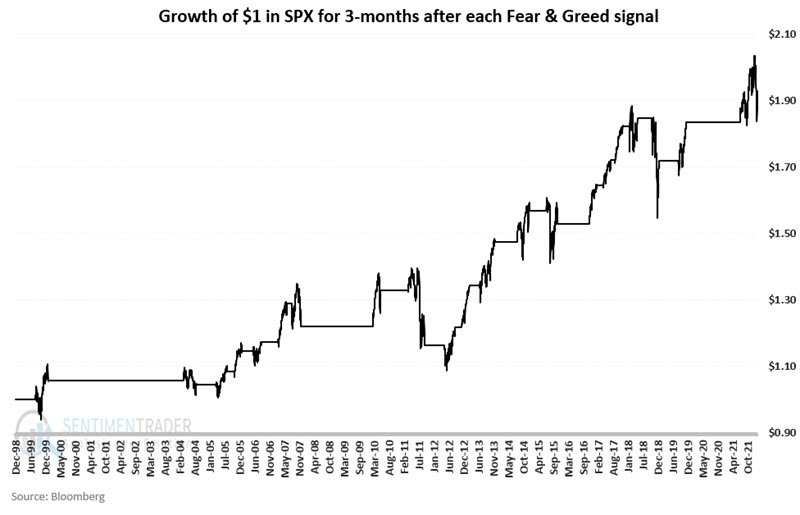
Note that the results in the chart above are far from a "straight-line, sure thing" result. But no one is advocating using this signal as a standalone trading method. Nevertheless, given the long-term trend from "lower left to upper right," this signal can lend bullish credence to a broader "weight of the evidence" approach.
What the research tells us…
Many overbought/oversold type indicators have been triggered recently as being oversold and/or reversing off of an oversold reading. (See here, here, here, here, here, here, and here). From a purely objective point of view, these signals suggest the potential for higher stock prices - at least for a while.