
Ultimate Guide to MACD
The MACD indicator (Moving Average Convergence Divergence) is a momentum and trend following indicator that demonstrates the strength of the market's momentum. But unlike other guides online, I won't just show you how to use this indicator in a generic way and how well it "works" (only showing you the successful trades while sweeping the failures under the rug). Instead, you'll discover in this post:
- What is MACD and how is it calculated
- How traders use this indicator
- Skepticism towards MACD
- How useful is this indicator? Let's look at the data and facts instead of hoping and praying that this indicator "works".
- What is the best MACD settings for various markets and various time frames? Here's the data and proof.
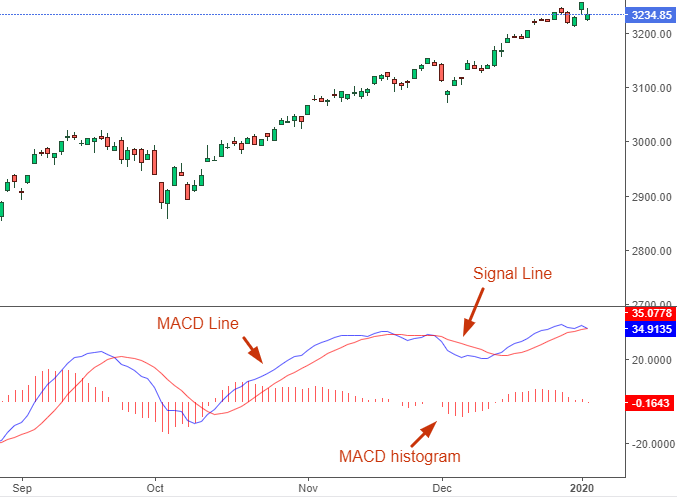
MACD is shorthand for "moving average convergence divergence" and was developed and popularized by Gerald Appel in the 1970s. The name implies that this indicator looks for the relative strength between 2 moving averages to identify how strong (or weak) the market's momentum is. MACD can be applied to any time frame: hourly charts, daily charts, weekly charts, and monthly charts. It has 3 parts:
- MACD Line: market's 12 day exponential moving average minus the market's 26 day exponential moving average
- Signal Line: 9 day exponential moving average of the MACD line
- MACD histogram: MACD Line minus the Signal Line
*These settings (12 day ema and 26 day ema) can be customized to whatever you want, but 12 and 26 are the default settings.
Here's an example diagram:
*All market charts in this post are courtesy from TradingView.
In essence, the MACD Line shows you how strong the market's short term uptrend or downtrend is. The stronger the trend, the more the market's 12 ema will be away from its 26 ema. Using that same example:
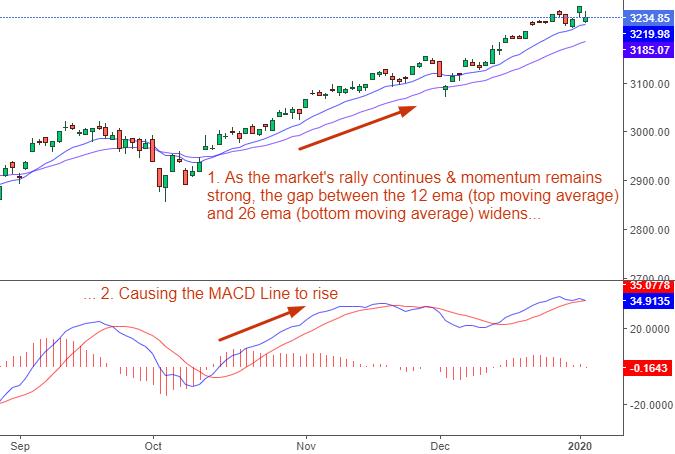
Meanwhile, the Signal Line is just a smoothed average of the MACD Line, and the MACD histogram is just the difference between the two.
- The higher the MACD histogram, the more the MACD Line is above the Signal Line. This implies that the market's upwards momentum is extremely strong.
- The lower the MACD histogram, the more the MACD Line is below the Signal Line. This implies that the market's downwards momentum is very strong.
There are 4 main ways to use MACD when trading. I'll explain each method in this post, look at cases in which it works (or doesn't work), and then show you with data exactly how well each trading method works when you add up the successes & failures in different markets. The 4 MACD strategies are:
- Buy and sell on the MACD crossover. This is a trend following strategy.
- Look for MACD divergences, which *hopefully* help predict turning points in the market.
- Look for extreme MACD readings in anticipation of a market reversal
- Use MACD as a trend filter when finding trades
Here are the 4 strategies in detail:
#1: Buy and sell on MACD crossovers
This is probably the most common way to use MACD:
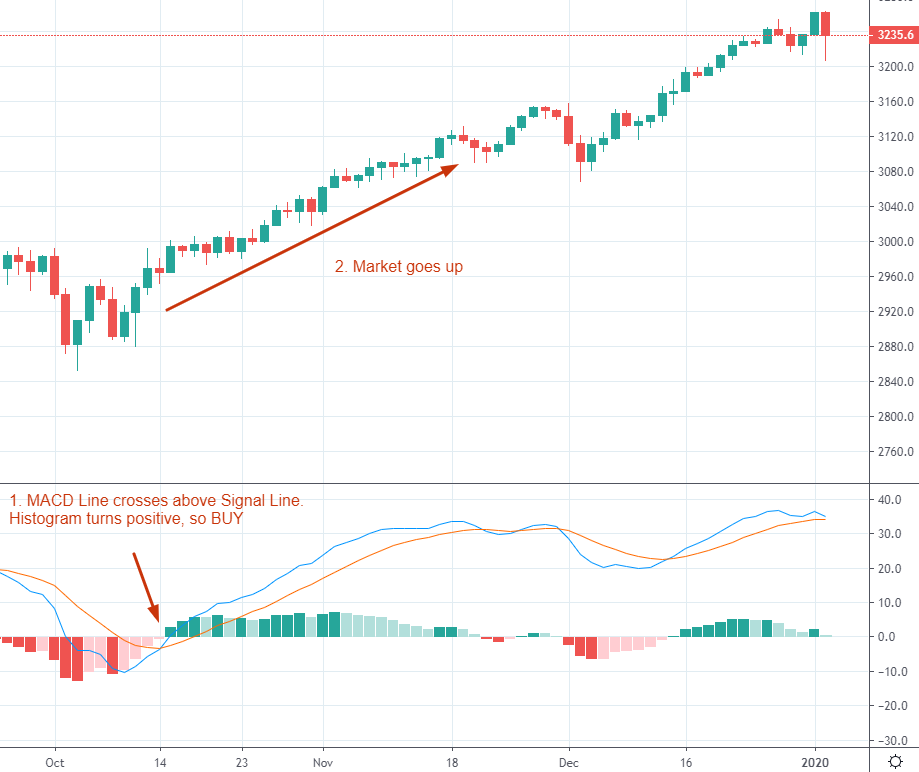
- Buy when the MACD Line crosses above the Signal Line (in other words, buy when the MACD histogram rises above 0 and turns positive).
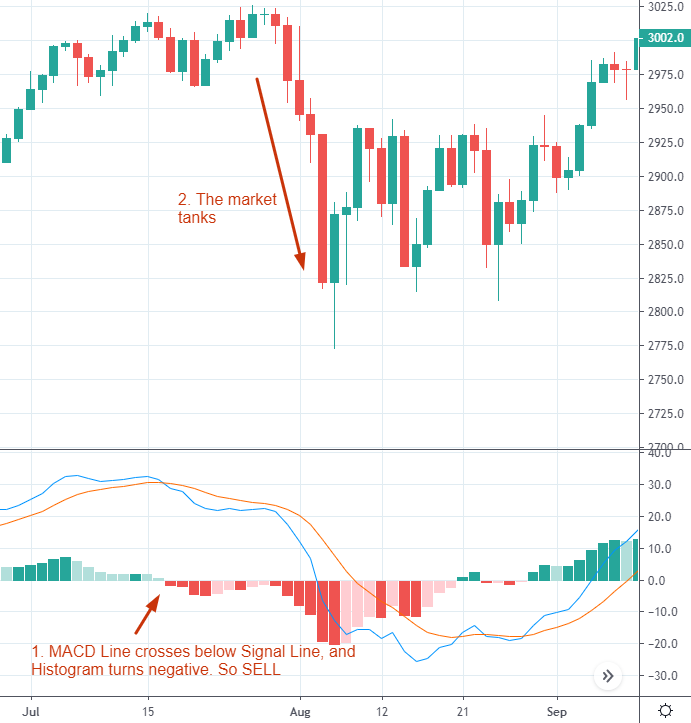
- Sell when the MACD Line crosses below the Signal Line (in other words, sell when the MACD histogram falls below 0 and turns negative).
The logic behind this trading strategy is that markets tend to "roll over" at many market tops or "roll up" at some market bottoms. As a result, market tops are often marked by weakening momentum. Since MACD's job is to notify traders of weakening momentum, it can be useful for predicting market tops and bottoms.
Here's an example of a bullish trade using MACD crossovers:
Here's an example of a bearish trade using MACD crossovers:
#2: Look for MACD divergences to help predict turning points
Many traders and technical analysis books use MACD divergences to help predict turning points in the market. Divergences occur when:
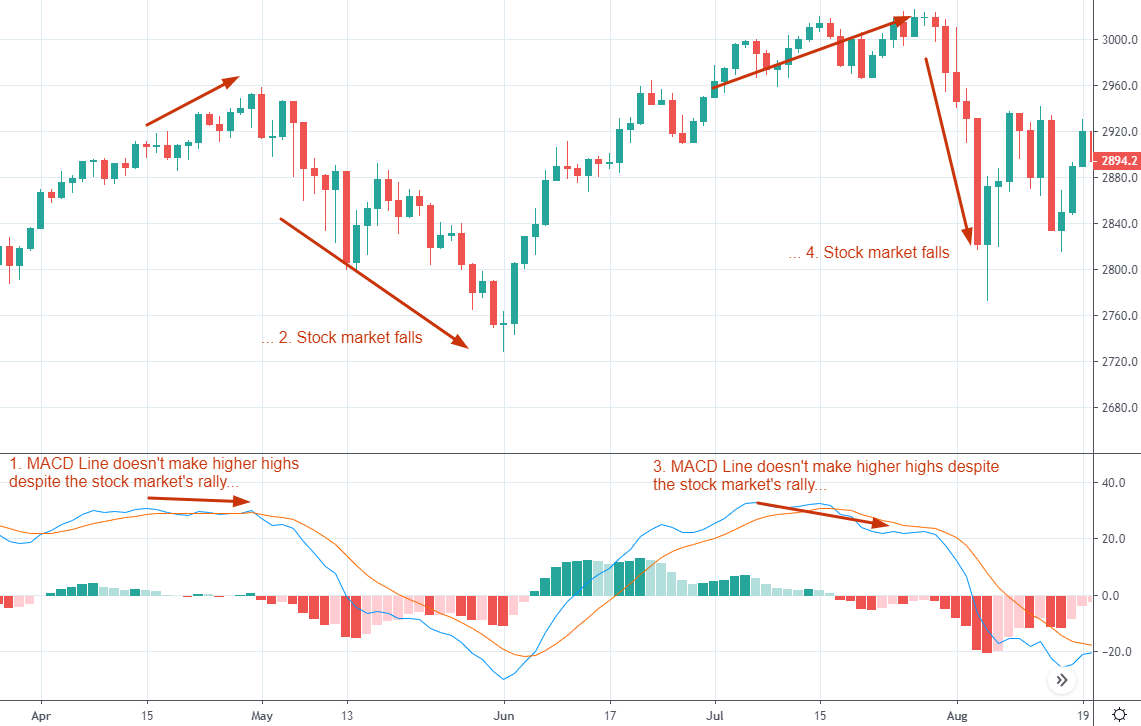
- The market continues to go up, but the MACD Line does not make higher highs. This indicates that while the market is still rallying, the pace of its rally is slowing down, which means that the rally might be losing steam. Perhaps the market will soon reverse downwards.
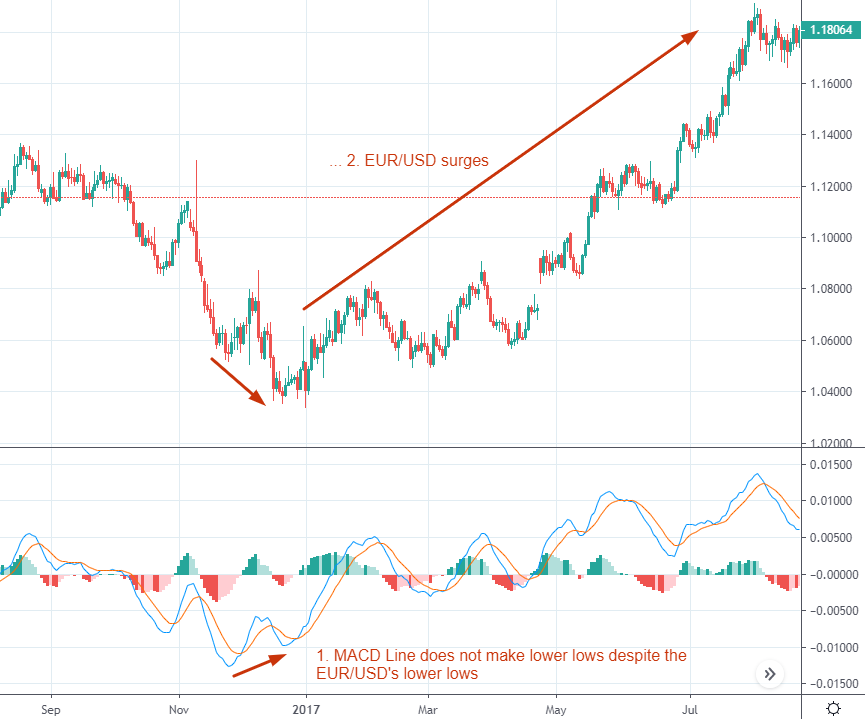
- The market continues to go down, but the MACD Line does not make lower lows. This indicators that while the market is still fallying, the pace of its decline is slowing down, which means that the decline might be losing steam. Perhaps the market will soon reverse upwards.
Here's an example of a bearish MACD divergence using the S&P 500 in 2019:
Here's an example of a bullish MACD divergence using EUR/USD in 2016:
#3: Extreme MACD histogram readings can predict market reversals
As is the case with many momentum indicators, extreme readings can be used to predict market reversals and create mean-reversion trades. Using this strategy:
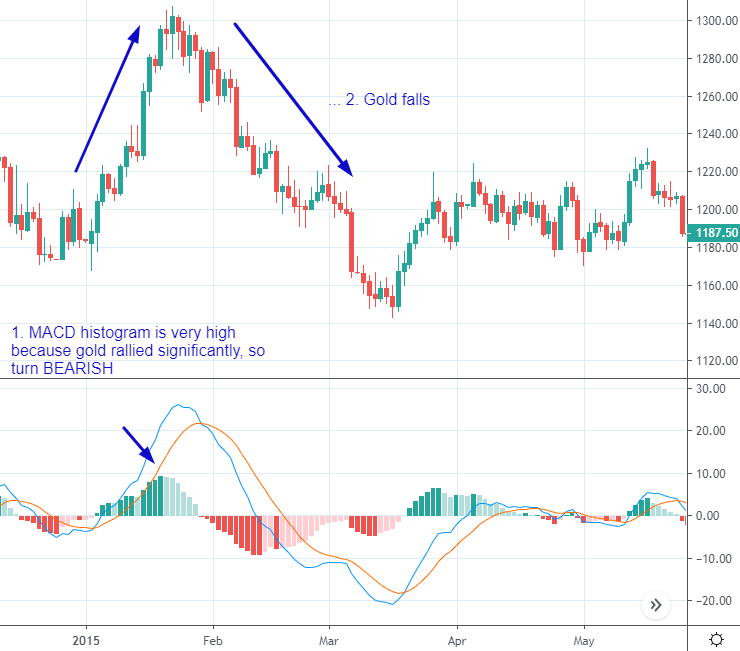
- When the MACD histogram is extremely high (meaning that the market's upwards momentum is extremely strong), traders should look to turn bearish on the market.
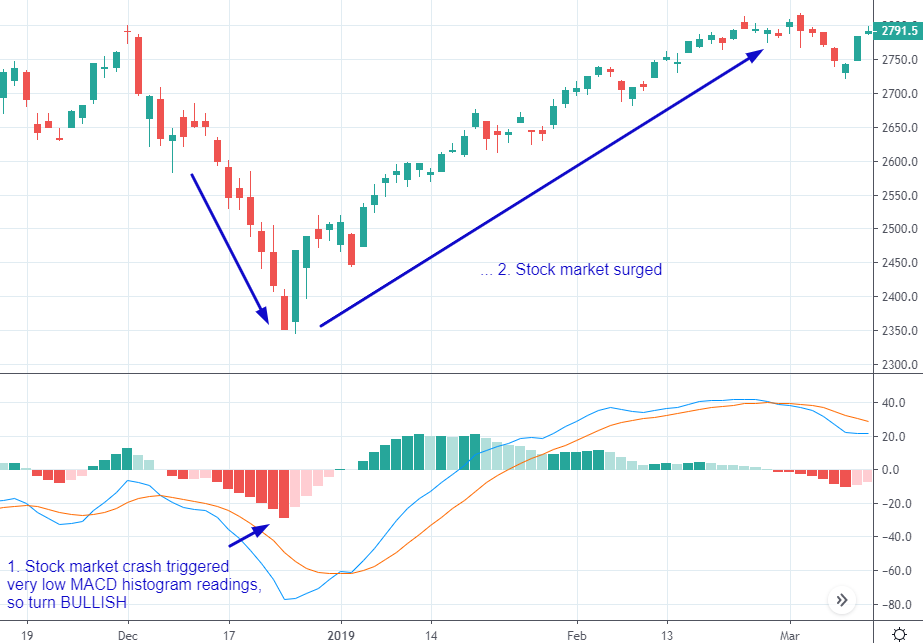
- When the MACD histogram is extremely low (meaning that the market's downwards momentum is extremely strong), traders should look to turn bullish on the market.
Here's an example of using extremely high MACD histogram readings to turn bearish on gold in 2015:
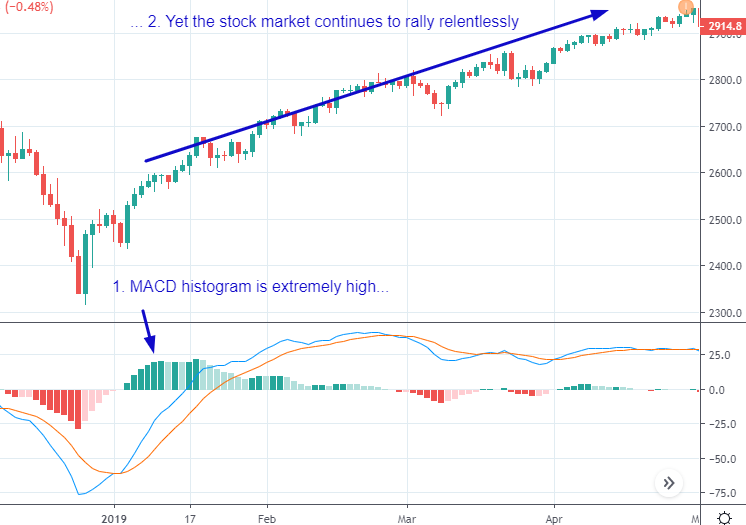
Here's an example of using extremely low MACD histogram readings to turn bullish on the S&P 500 in 2019:
#4: Use MACD as a trend filter to help you identify trades
It's generally better to trade on the side of the market. This means that you should look for bullish trades when the market is trending "upwards" and look for bearish trades when the market is trending "downwards". Sounds logical, right? But how do we know what counts as an "uptrend" or "downtrend"?
Enter MACD.
We can use the MACD trend filter to help us identify which way the market is trending and what trades to look for. Here's how:
- Identify the time frame on which you're looking for trades. This could be hourly, daily, weekly, etc.
- Apply the MACD to one time frame higher. This means that if you're looking at the daily chart for trade ideas, look at the market's MACD histogram on a weekly chart.
- If the MACD histogram is positive, look for trades on the long side.
- If the MACD histogram is negative, look for trades in the short side.
The above 4 MACD strategies are not exactly revelations. These strategies are well known and can be found on countless websites or books. However, most websites/books only highlight the cases in which MACD works and don't look at the cases in which MACD doesn't work. That's why many beginning traders who use this indicator without great success scratch their heads and wonder "I was told that this indicator should work really well. Why is it no better than a coin toss"?
Before we look at exactly how well MACD really works (no sweeping failures under the rug like many financial marketers who sell the trading dream), let's first think about why MACD might not work.
And by "work", we must recognize that even the best indicators don't work 100% of the time. We're merely trying to find indicators that work better than a coin toss (e.g. random chance).
Let's look at each of the 4 common MACD strategies and understand why they may not work.
#1: Buy and sell on MACD crossovers
In this strategy, the trader looks to turn bearish when the market's upwards momentum weakens or turn bullish when the market's downwards momentum weakens.
But herein lies a critical problem:
- Just because the market's upwards momentum is weakening, doesn't mean that the uptrend will end. Perhaps the market is just taking a pause before it continues to trend higher.
- Just because the market's downwards momentum is weakening, doesn't mean that the downtrend will end. Perhaps the market is just taking a pause before it continues to trend lower.
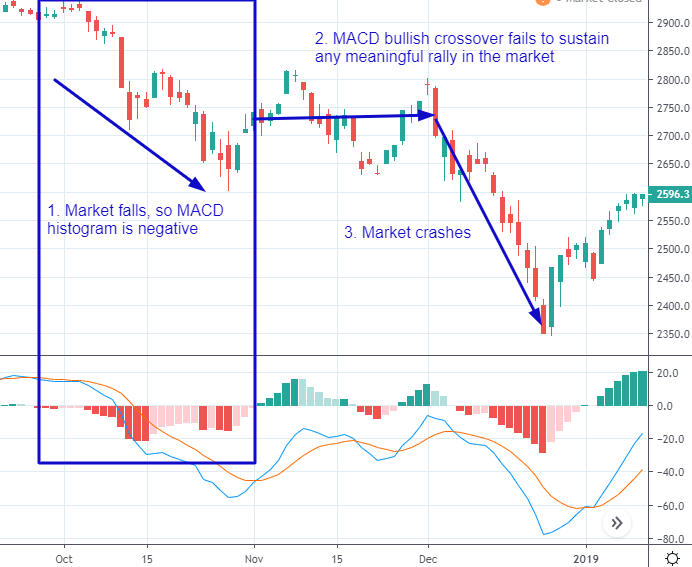
Here's an example of a failed bullish MACD crossover with the S&P 500 in 2018:
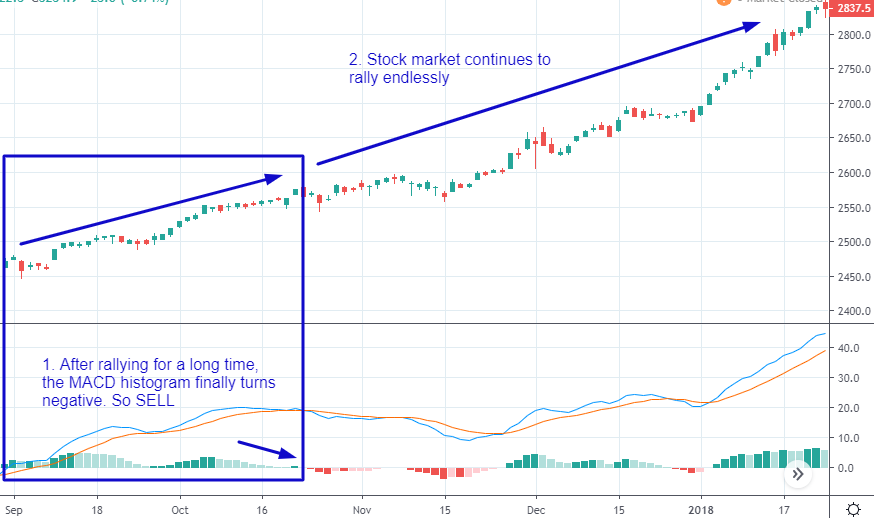
Here's an example of a failed bearish MACD crossover with the S&P 500 in 2017:
#2: Look for bullish/bearish MACD divergences to help predict tops/bottoms in the market
Traders sometimes use MACD divergences to help predict tops and bottoms in the market. But the problem with any strategy that relies on "divergences" is that the concept of a "divergence" is extremely hard to quantify. The human eye is prone to seeing whatever it wants to see on a chart. So if a trader is already inclined to be bullish, he can always spot a "bullish MACD divergence" to justify his bullish stance. If he is already inclined to be bearish, he can always spot a "bearish MACD divergence" to justify his bearish stance.
Moreover, many divergences aren't able to predict market tops or bottoms.
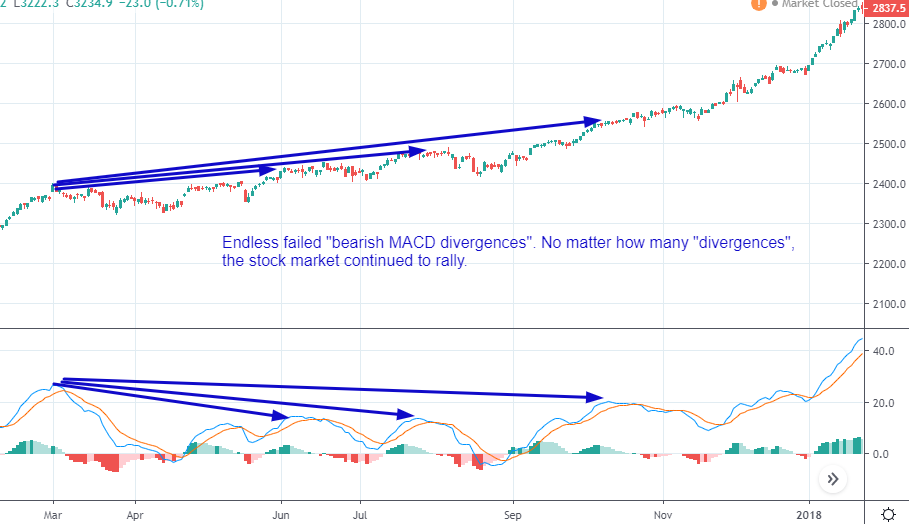
Here's an example of a failed bearish divergence with the S&P 500 in 2017:
Bearish divergences are more prone to failure than bullish divergences, particularly for the U.S. stock market.
#3: Extreme MACD histogram readings
Traders using this strategy will turn bullish when the MACD histogram is extremely low and turn bearish when the MACD histogram is very high. This can be problematic because:
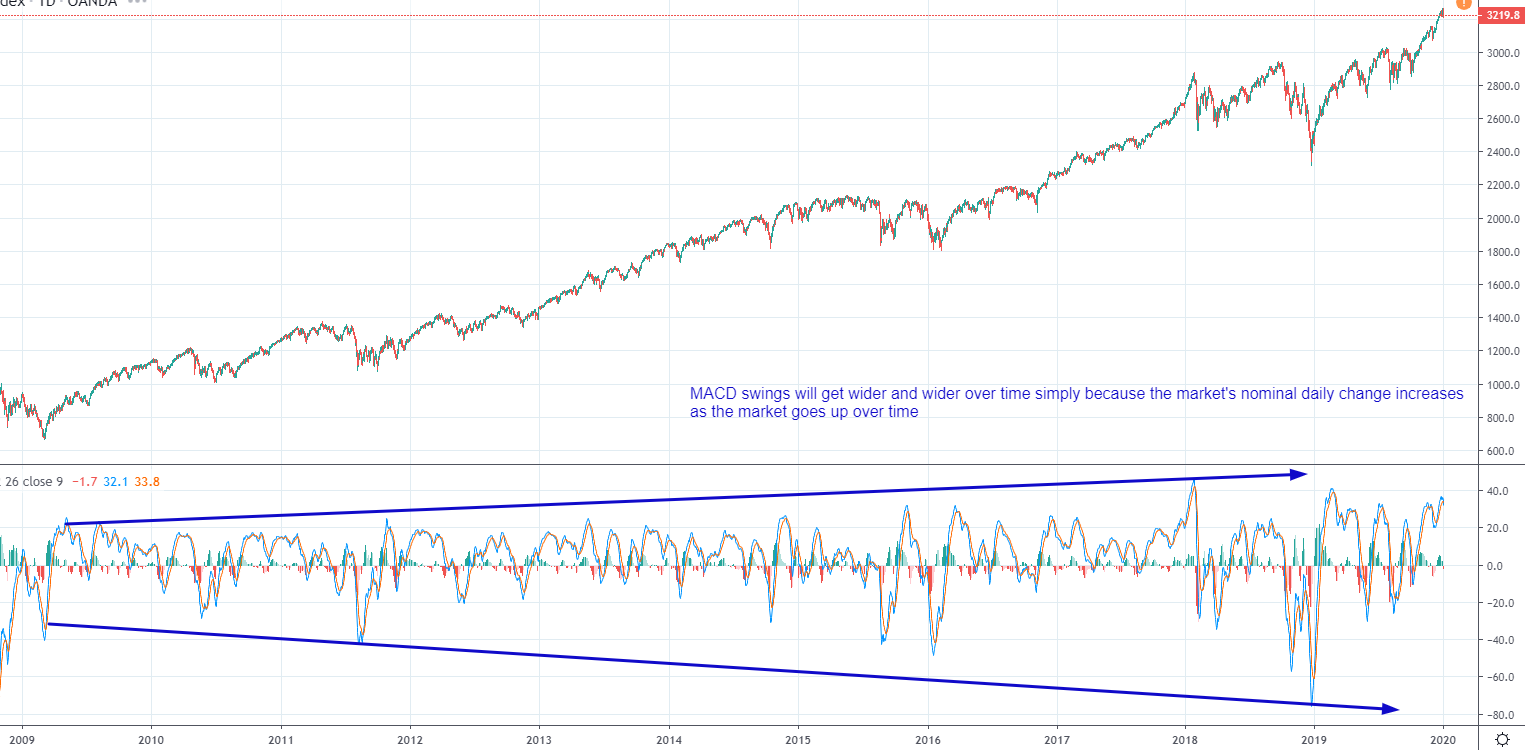
Problem #1: "Extreme" can become even more extreme. Just because the MACD histogram is very high, doesn't mean the market can't continue to rally and push the MACD histogram even higher. Just because the MACD histogram is very low, doesn't mean the market can't continue to fall and push the MACD histogram even lower.
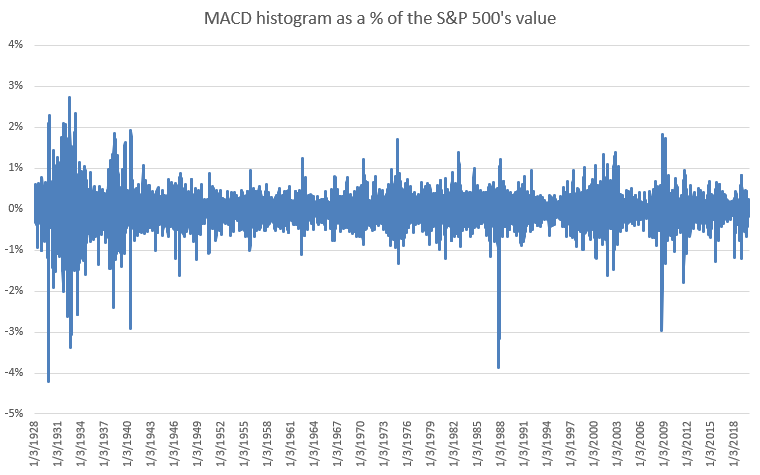
Problem #2: The MACD histogram is based on nominal numbers. Which means that over a long period of time, peaks will get higher and troughs will get lower. So to make long term comparisons worthwhile, you must divide the MACD histogram by the market's value to get an apples-to-apples comparison throughout history.
#4: Use MACD as a trend filter to help you identify trades
This MACD strategy has the least skepticism towards it, because the data easily proves that this works.
The only skepticism here is that there nothing special about the MACD in terms of how useful it is as a trend filter. In other words, is the MACD really better than a simple moving average at keeping you on the right side of the market? After all, if you looked for bullish trades when the market was above its 200 dma and bearish trades when the market was below its 200 dma, perhaps the results are no worse than if you looked for bullish trades when the MACD histogram was positive and bearish trades when the MACD histogram was negative.
Now that we've looked at potential problems with various MACD trading strategies, let's see exactly how well MACD works. Remember: focus on the data and the facts, and forget about what trading gurus or books have told you in the past. Their job is to sell you "the secret" by convincing you how smart their tactics are. Your job as a trader is to remain as objective as possible.
How well does MACD actually work when trading?
We looked at 4 MACD trading strategies:
- Buy and sell on the MACD crossover.
- Look for MACD divergences.
- Use extreme MACD readings to predict market tops & bottoms.
- Use MACD as a trend filter when finding trades.
We'll ignore the 2nd strategy (look for MACD divergences) because it is extremely difficult to be objective about what a "divergence" is. No 2 traders staring at the same chart will spot the same divergences. We'll also ignore the 4th strategy (use MACD as a trend filter) since it isn't a complete trading strategy on its own (you need to combine it with other indicators). We'll test the following 2 strategies on 3 markets: the S&P 500, gold, and the U.S. Dollar Index
- Buy and sell on the MACD crossover.
- Use extreme MACD readings to predict market tops & bottoms.
*You can test these MACD strategies on any market you want. But for the sake of keeping this post brief, we'll stick to these 3 markets.
*Most forex traders don't trade the U.S. Dollar Index - they trade specific forex pairs. But the U.S. Dollar Index does correlate with many currency pairs, so if you're a forex trader then please use the following data for demonstration purposes only.
*All strategies here use the daily MACD (not hourly, weekly, or monthly MACD)
Data & facts for strategy #1: buy and sell on the MACD crossover
For the S&P 500
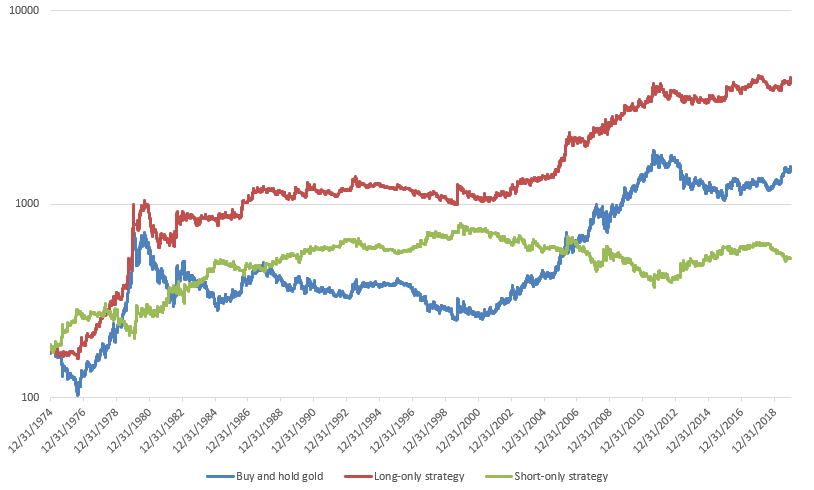
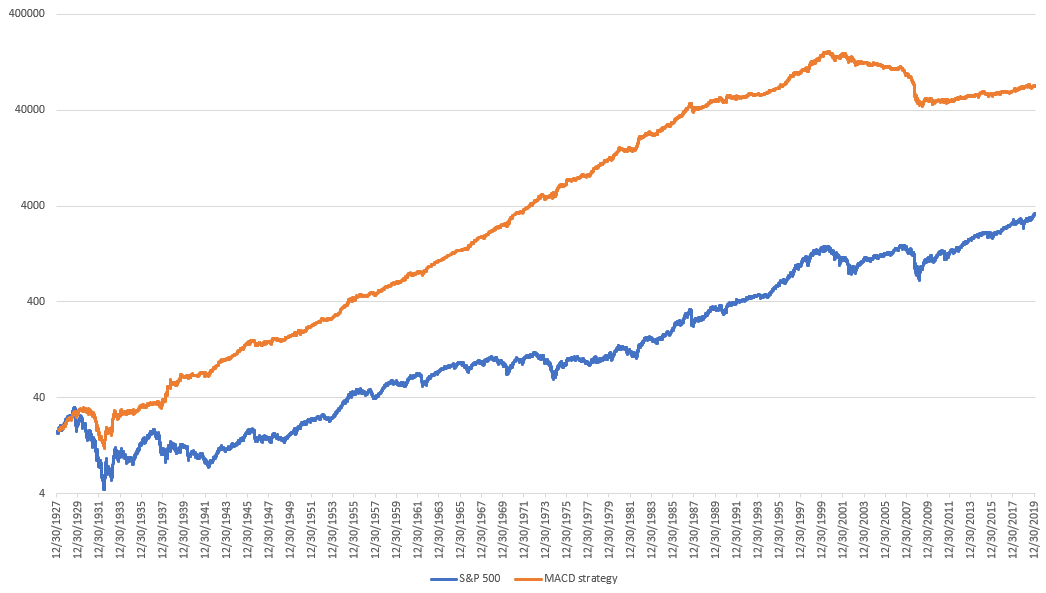
Here's what happens when you:
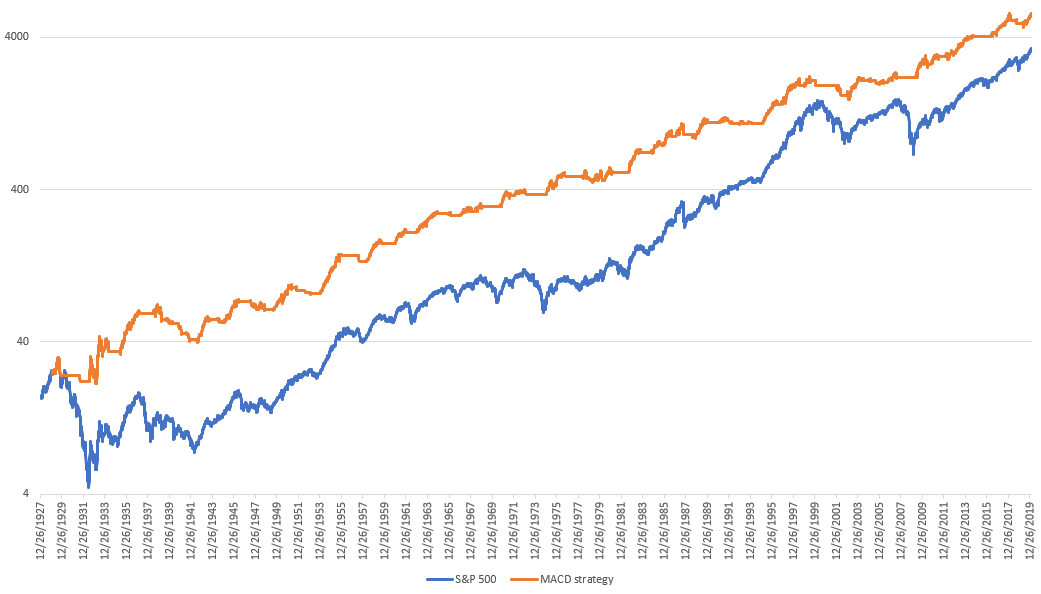
- Long-only strategy: buy and hold the S&P 500 when its MACD histogram is above 0.
- Short-only strategy: short the S&P 500 when its MACD histogram is below 0.

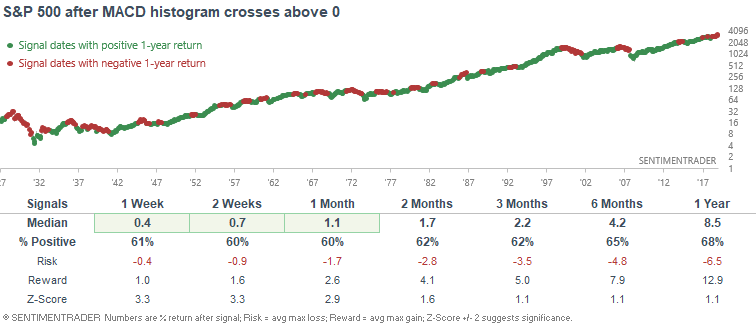
We can look at this from a different angle. Here's what happened next to the S&P 500 after its MACD made a bullish crossover (its histogram turned positive):
*872 historical cases
Here's what happened next to the S&P 500 after its MACD made a bearish crossover (its histogram turned negative):
*872 historical cases
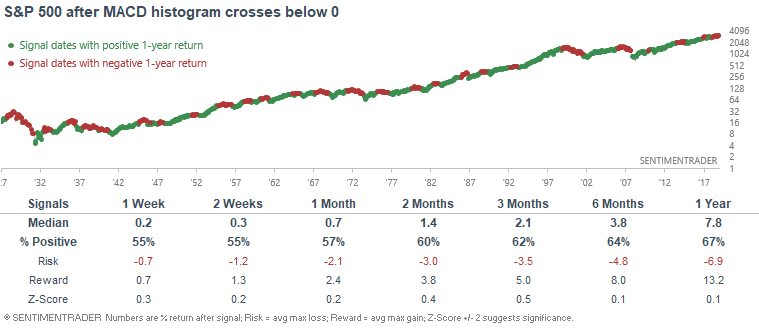
As you can see, using bullish MACD crossovers is a profitable strategy, although it does not beat buy and hold for the S&P 500. Meanwhile, using bearish MACD crossovers isn't a particularly effective strategy for the S&P 500.
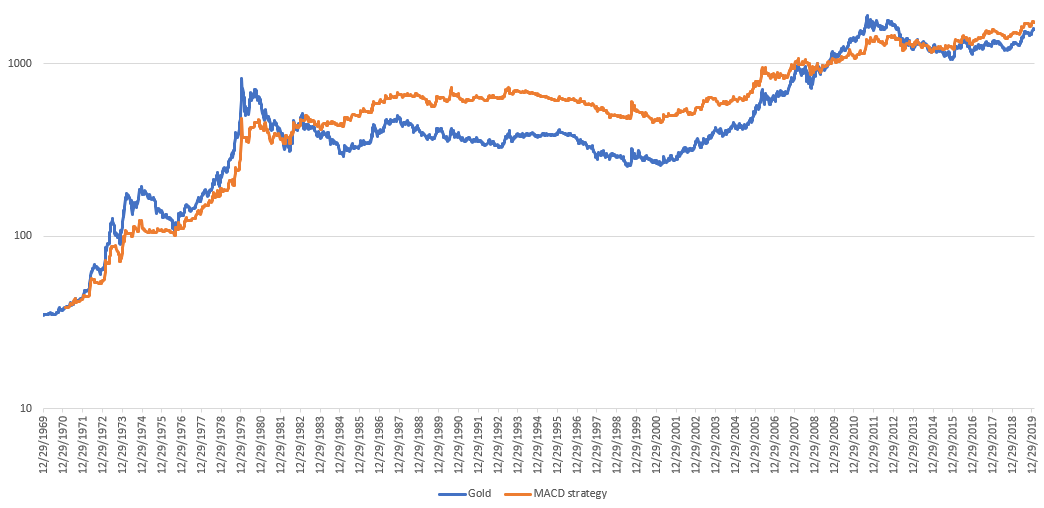
For gold
Here's what happens when you:
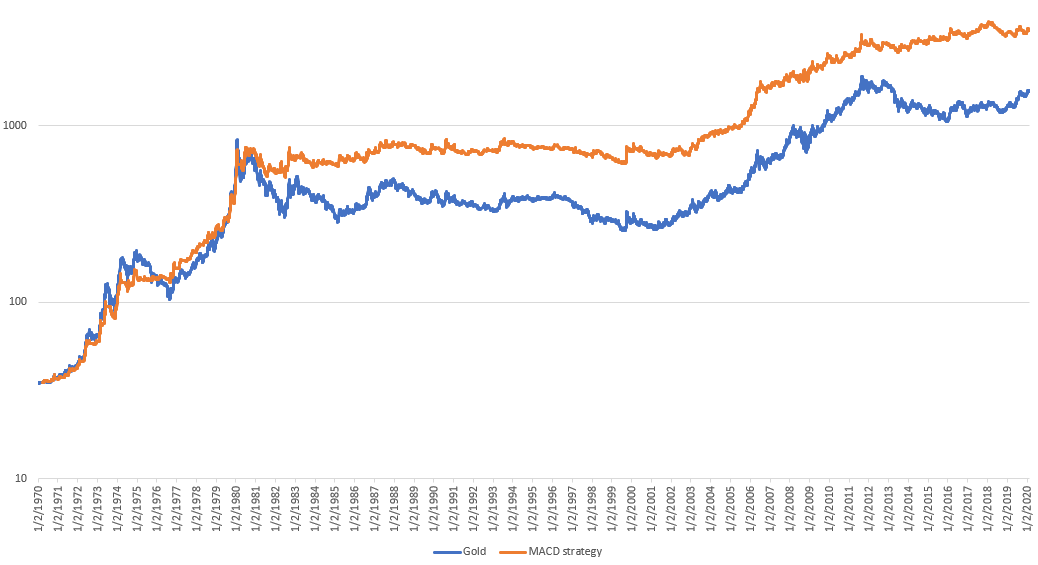
- Long-only strategy: buy and hold gold when its MACD histogram is above 0.
- Short-only strategy: short gold when its MACD histogram is below 0.
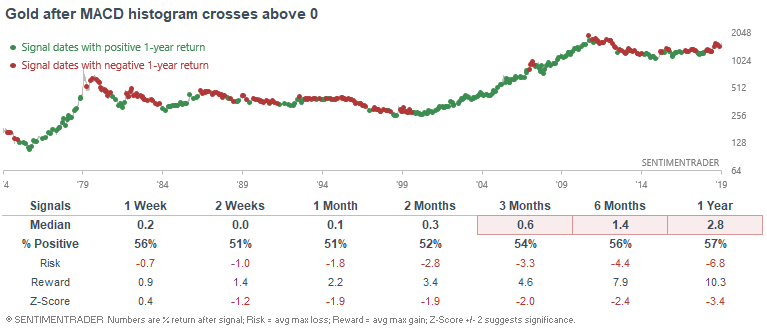
Here's what happened next to gold after its MACD made a bullish crossover (its histogram turned positive):
*425 historical cases
Here's what happened next to gold after its MACD made a bearish crossover (its histogram turned negative):
*425 historical cases
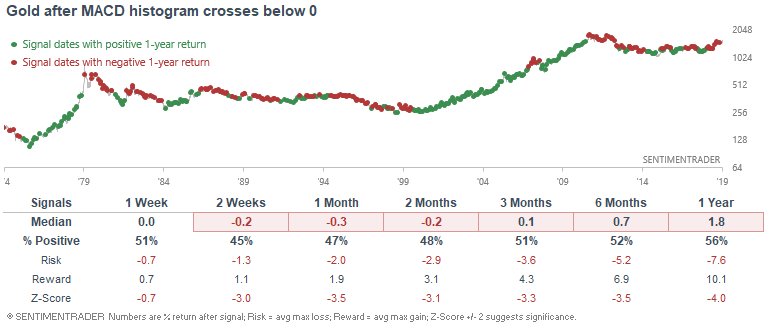
Overall, turning bullish on gold when its MACD histogram is positive has enabled traders to profit from gold. However, much of the outperformance against buy and hold occurred prior to the 2000s. Since the 2000s, this strategy has not really outperformed buy and hold for gold. Meanwhile, using a bearish MACD crossover on gold isn't particularly effective, although there is a slight tendency for gold to drop in the 2 weeks after a bearish MACD crossover occurred.
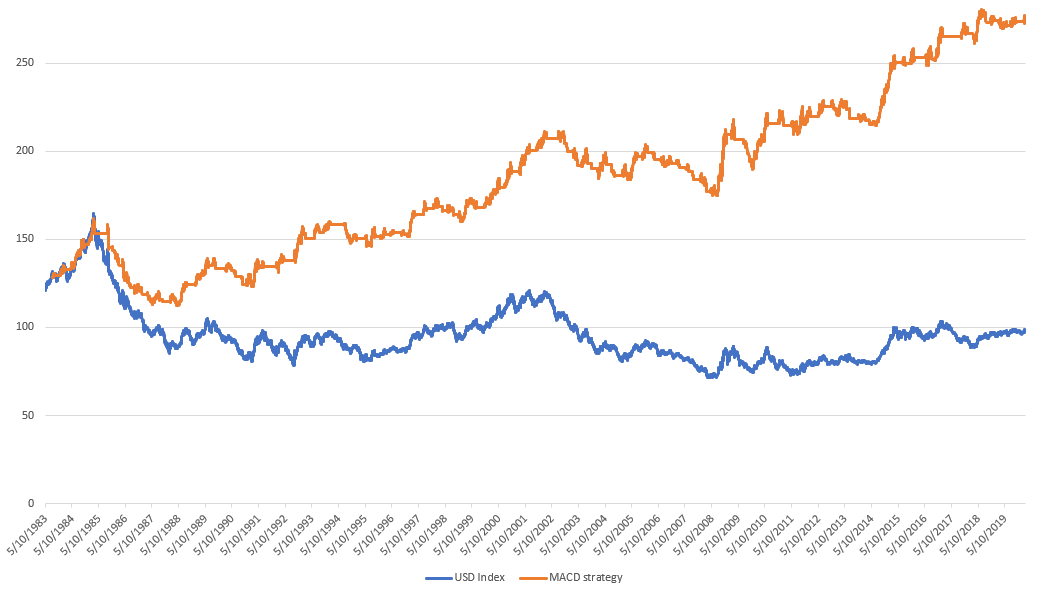
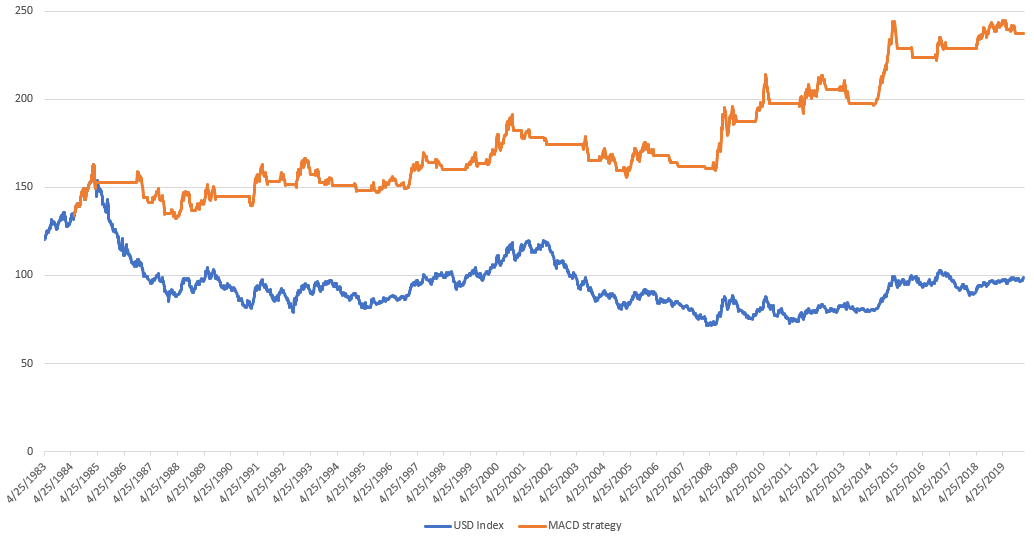
For the U.S. Dollar Index
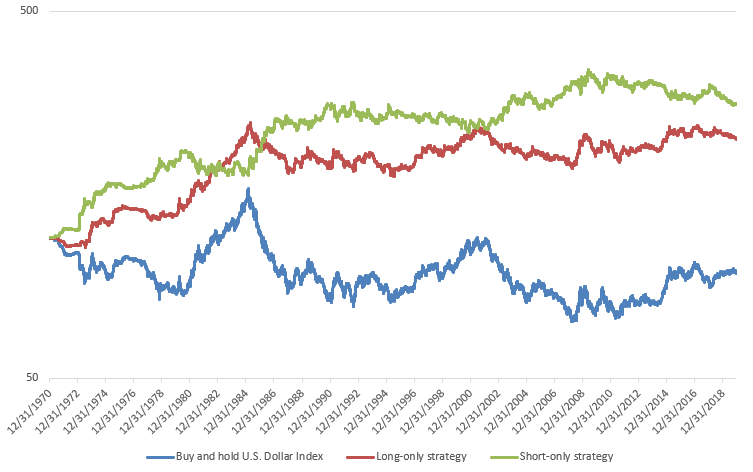
Here's what happens when you:
- Long-only strategy: buy and hold the USD when its MACD histogram is above 0.
- Short-only strategy: short the USD when its MACD histogram is below 0.
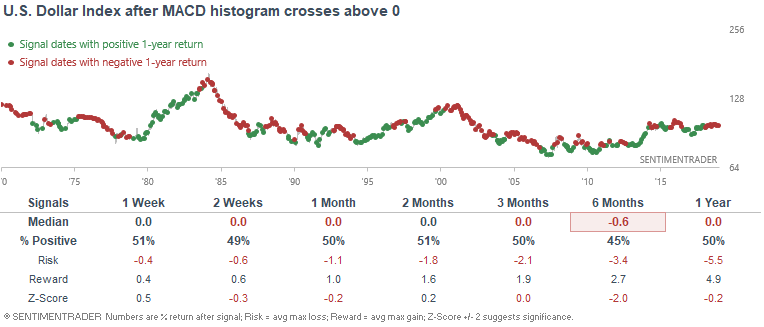
Here's what happened next to the USD after its MACD made a bullish crossover (its histogram turned positive):
*465 historical cases
Here's what happened next to the USD after its MACD made a bearish crossover (its histogram turned negative):
*465 historical cases
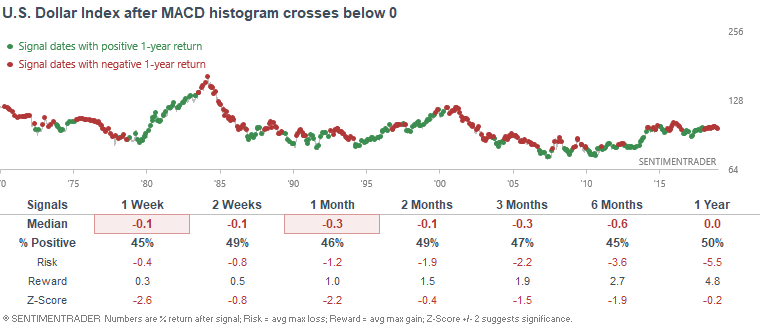
In short, using this MACD strategy to trade the USD does outperform buy and hold. However, much of the gains were before the 1990s. Since then, its effectiveness has been questionable. With that being said, there is a slight tendency for the U.S. Dollar to fall in the weeks after its MACD made a bearish crossover.
Data & facts for strategy #2: use extreme MACD readings to predict tops and bottoms
In order to test how useful the MACD is for contrarian trades, we must first turn its histogram into a % of its market's nominal value. That way the MACD histogram will consistently fluctuate within a range throughout history.
Then, we can look at the extreme percentiles of adjusted-MACD histogram readings and see how successful MACD is at predicting market reversals.
S&P 500
Here's the S&P 500's MACD histogram as a % of the S&P's value:
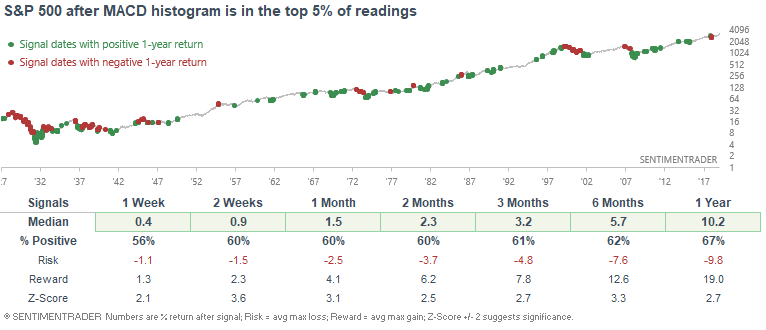
When the MACD histogram was in the top 5% of its readings, here's what the S&P 500 did next:
*1155 historical cases
When the MACD histogram was in the bottom 5% of its readings, here's what the S&P 500 did next:
*1155 historical cases
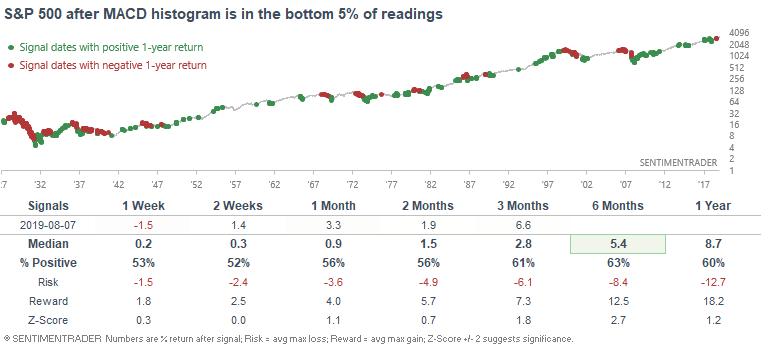
Overall, extremely high MACD readings were more bullish than bearish for the S&P 500. This is because extremely strong momentum is usually followed by more gains, hence the momentum effect. Meanwhile, extremely low MACD histogram readings weren't consistently bullish or bearish for the S&P.
Gold
Here's gold's MACD histogram as a % of gold's value:
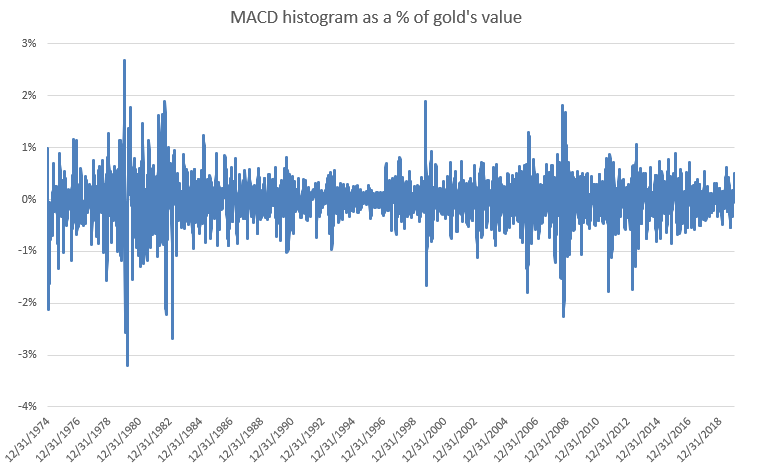
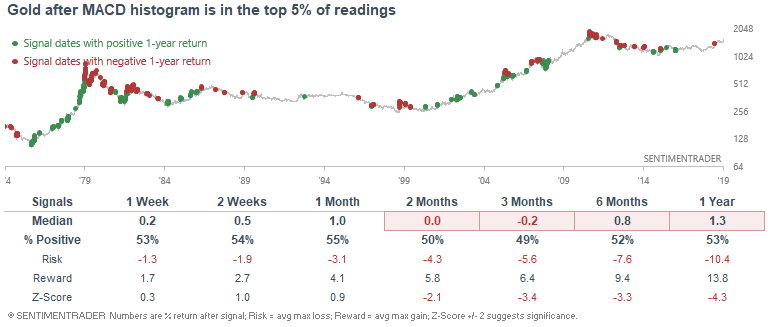
When the MACD histogram was in the top 5% of its readings, here's what gold did next:
*577 historical cases
When the MACD histogram was in the bottom 5% of its readings, here's what gold did next:
*577 historical cases
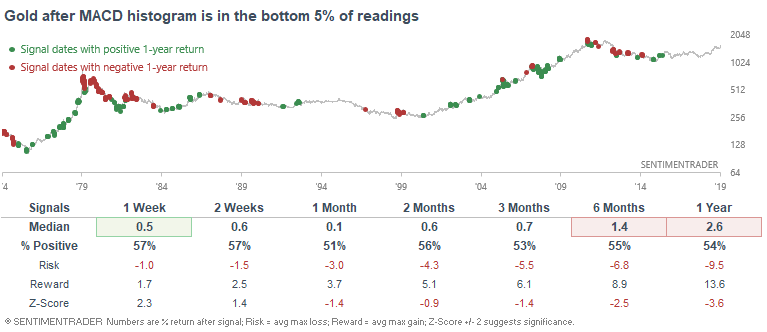
Overall, there wasn't a particularly strong edge using extreme MACD readings.
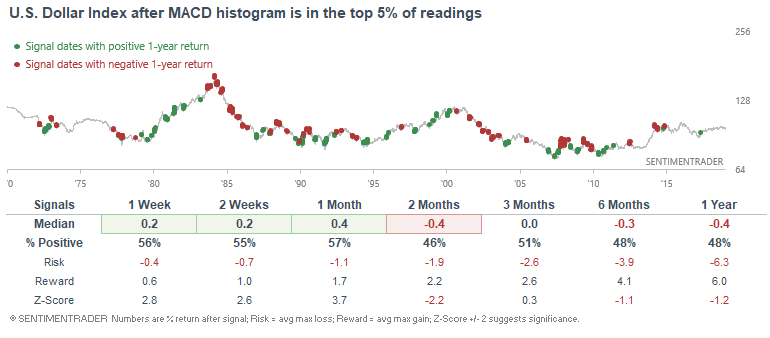
U.S. Dollar Index
Here's the U.S. Dollar Index's MACD histogram as a % of the U.S. Dollar's value:
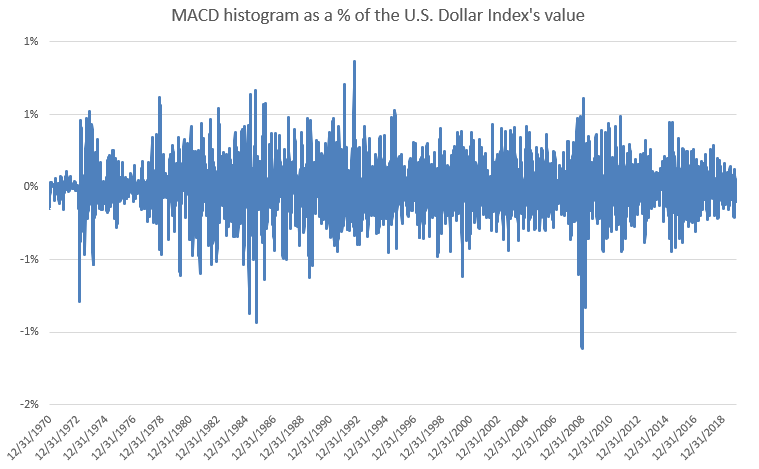
When the MACD histogram was in the top 5% of its readings, here's what the U.S. Dollar Index did next:
*626 historical cases
When the MACD histogram was in the bottom 5% of its readings, here's what the U.S. Dollar Index did next:
*626 historical cases
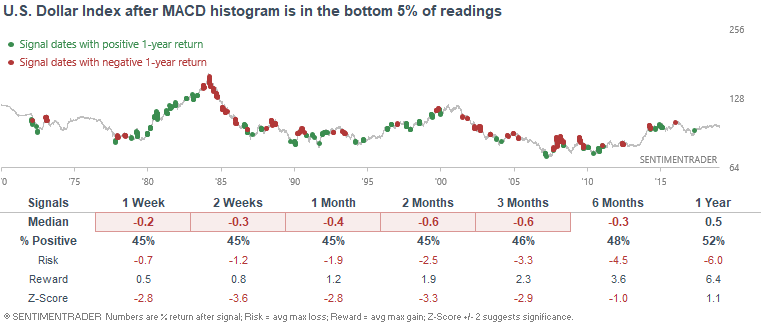
In summary, extremes often beget more extremes. When the Dollar rallied and its MACD histogram became very high, the Dollar more-often-than-not continued to rally. And when the Dollar tanked and its MACD histogram became very low, the Dollar more-often-than-not continued to face weakness.
Key takeaways
Here are several key takeaways from our analysis of how well MACD works.
- MACD is not a Holy Grail. There is no "secret best way to use this indicator", contrary to what you might see on other websites or youtube videos. Moreover, how well MACD works really differs from market to market. It doesn't work equally well in all markets.
- It is possible to make money over the long term with MACD. However, on its own this indicator does not consistently beat buy and hold in the long run.
- Using MACD in long-only strategies is more profitable than using short-only strategies in markets that trend upwards over the long term, such as the U.S. stock market. This illustrates just show hard it is to make money in the long run on the short side of a market that trends upwards.
- Like many momentum indicators, extreme MACD readings don't usually mean that the market is about to reverse. More often than not, the market's trend tends to continue instead of reverse.
What's the best MACD settings for different markets and different time frames?
I see this question get asked a lot of times, particularly by beginners: "what's the best setting for MACD"? The standard setting is 12-26-9, but everyone seems to have their own opinion on what's the best custom setting.
Let's put aside opinions, belief, and " in my own experience" statements. Instead, let's just look at the facts.
I'm going to test the most common moving average strategy on 3 different markets and 2 different times frames. Using some code, I'll show you the optimal MACD settings based on historical performance.
Strategy (MACD crossover)
Buy (go long) when the MACD histogram (custom setting X, Y, and Z) crosses above 0, and sell when the MACD histogram crosses below 0.
*I'll test every MACD setting from 2 to 60 to see which setting provides the best historical performance. In total, I'll run through tens of thousands of MACD settings.
E.g. MACD 12-26-9, MACD 3-42-31, MACD 6-21-8...
Markets
I'll test this strategy on the S&P 500, gold, and U.S. Dollar Index
Time frames
I'll test this strategy on daily and weekly price data.
Now let's get into the data and facts.
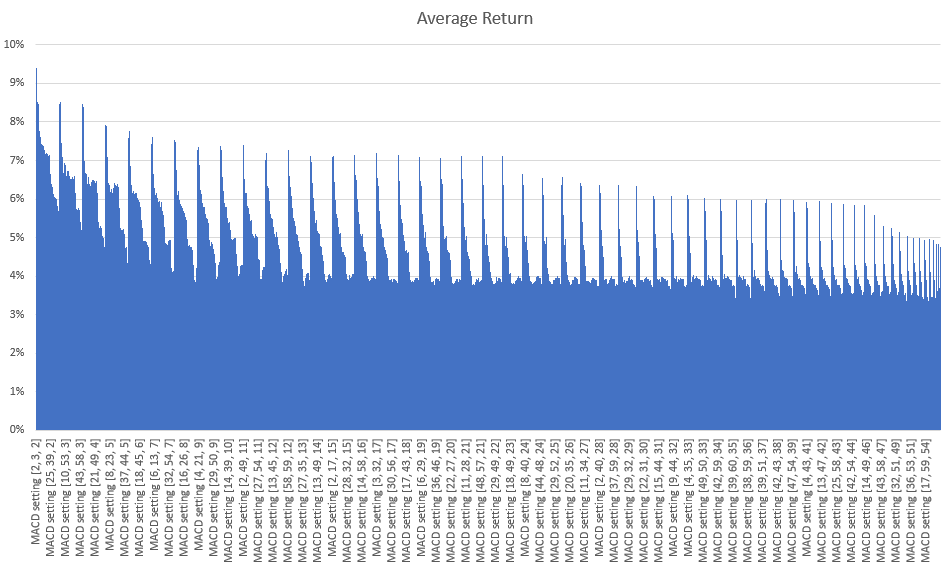
S&P 500
Daily
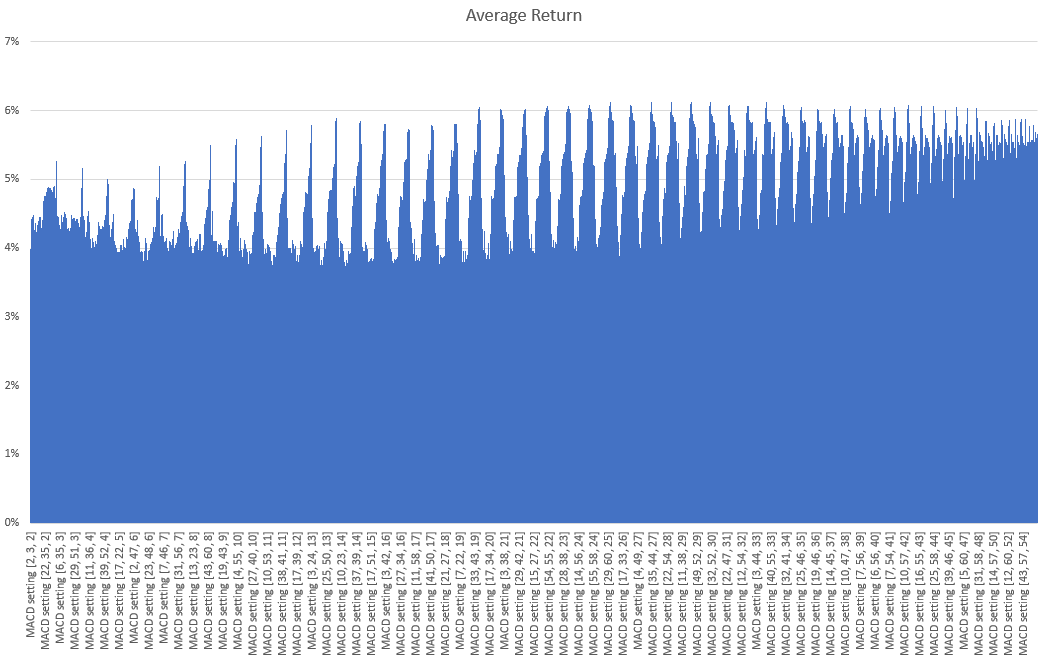
The optimal MACD setting was (2, 60, 2), which means the MACD Line = 2 ema - 60 ema, and the Signal Line was the 2 ema of the MACD Line.
This yielded an average of 9.41% per year vs. buy and hold's 5.78% per year (not including dividends reinvested).
The following chart illustrates every MACD setting and its % annual return:
Weekly
The optimal MACD setting was (30, 57, 27), which means the MACD Line = 30 ema - 57 ema, and the Signal Line was the 27 ema of the MACD Line.
This yielded an average of 6.12% per year vs. buy and hold's 5.51% per year (not including dividends reinvested).
The following chart illustrates every MACD setting and its % annual return:
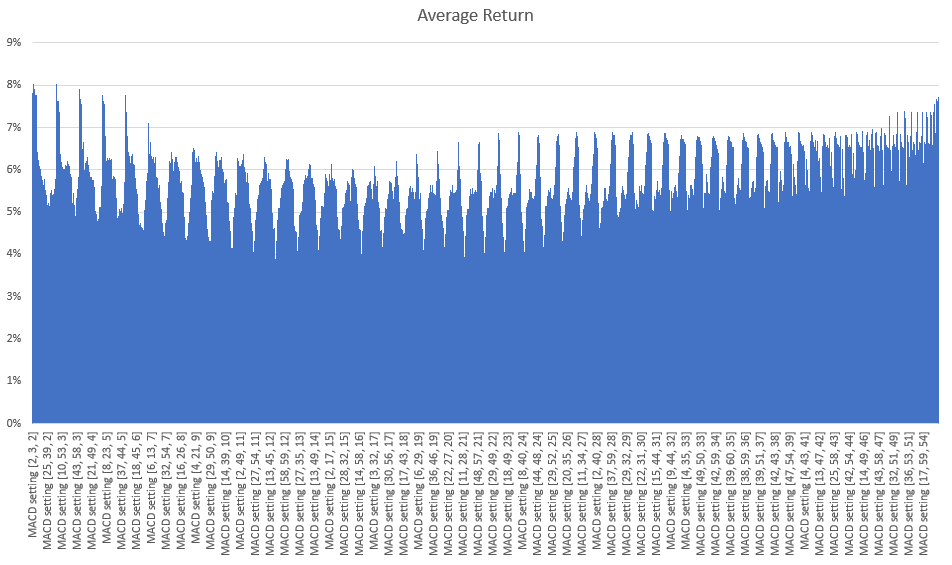
Gold
Daily
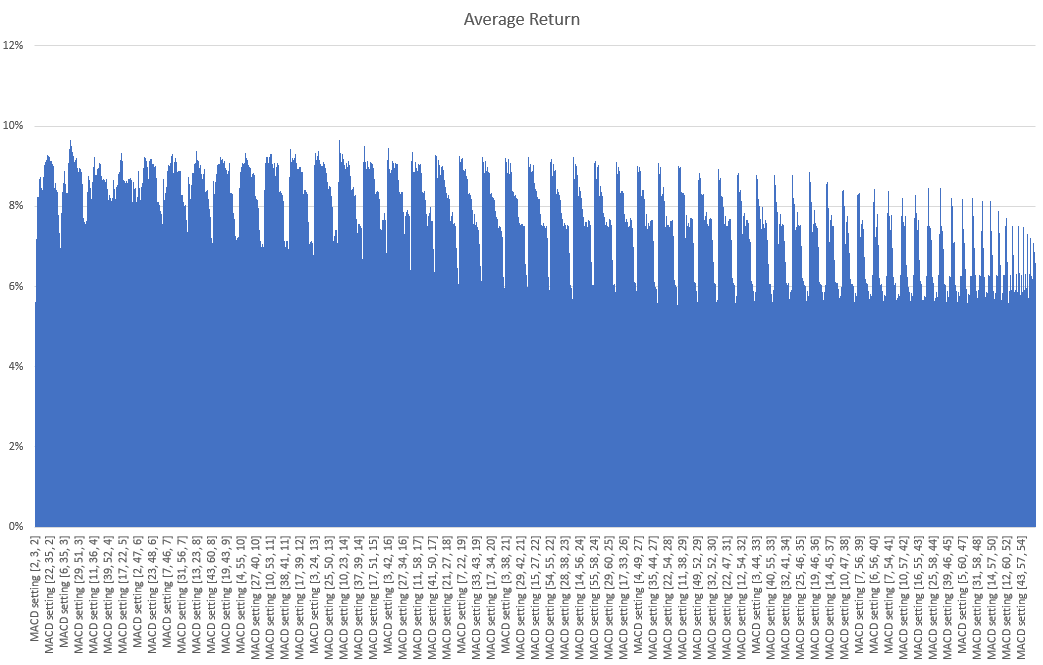
The optimal MACD setting was (14, 48, 3), which means the MACD Line = 14 ema - 48 ema, and the Signal Line was the 3 ema of the MACD Line.
This yielded an average of 9.66% per year vs. buy and hold's 7.92% per year.
The following chart illustrates every MACD setting and its % annual return:
Weekly
The optimal MACD setting was (2, 8, 2), which means the MACD Line = 2 ema - 8 ema, and the Signal Line was the 2 ema of the MACD Line.
This yielded an average of 8.09% per year vs. buy and hold's 7.82% per year.
The following chart illustrates every MACD setting and its % annual return:
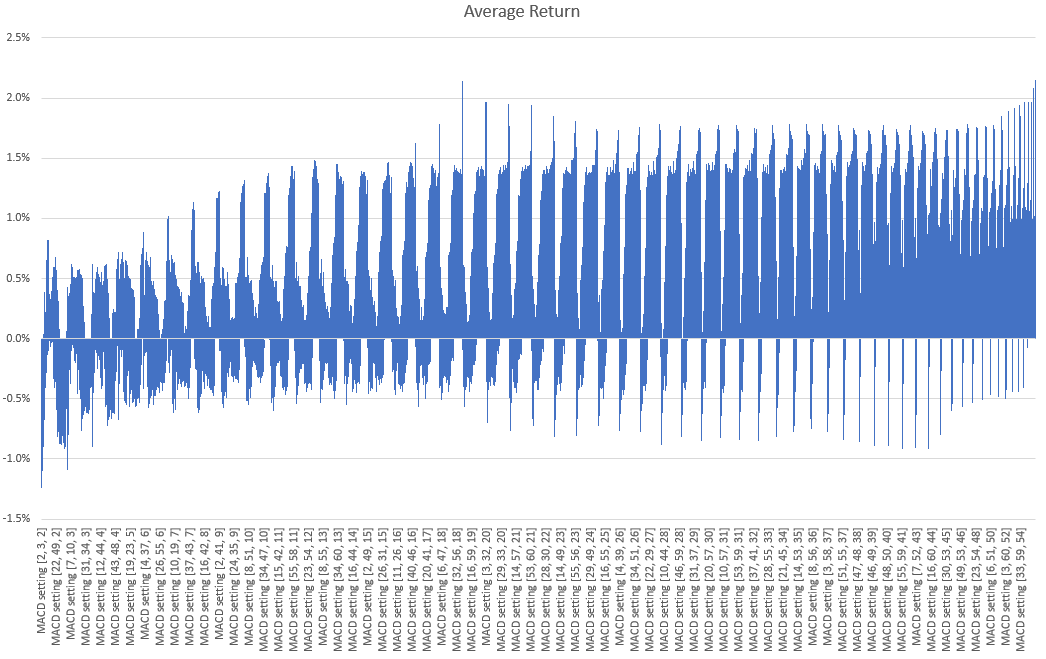
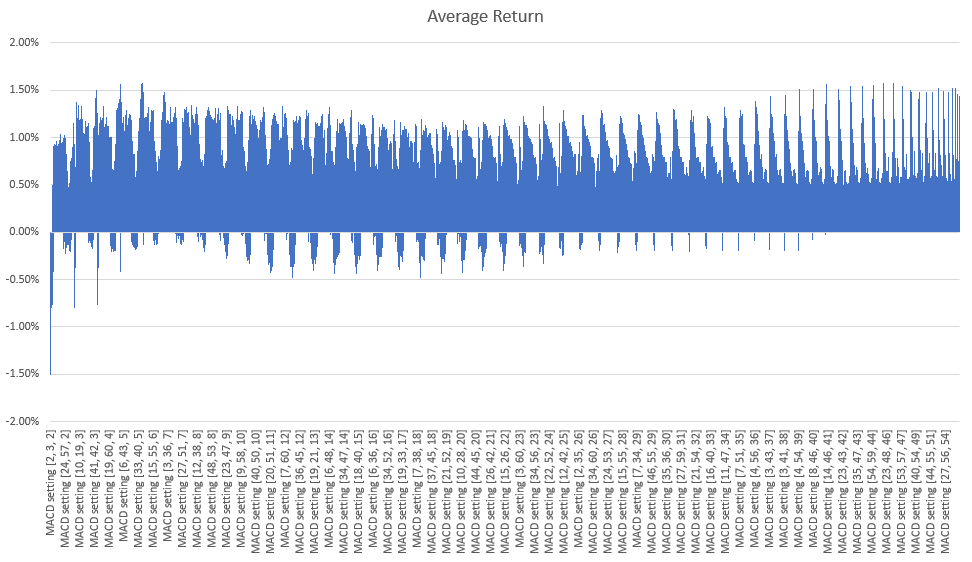
U.S. Dollar Index
Daily
The optimal MACD setting was (18, 60, 59), which means the MACD Line = 18 ema - 60 ema, and the Signal Line was the 59 ema of the MACD Line.
This yielded an average of 2.14% per year vs. buy and hold's -0.72% per year.
The following chart illustrates every MACD setting and its % annual return:
Weekly
The optimal MACD setting was (46, 52, 5), which means the MACD Line = 46 ema - 52 ema, and the Signal Line was the 5 ema of the MACD Line.
This yielded an average of 1.57% per year vs. buy and hold's -0.89% per year.
The following chart illustrates every MACD setting and its % annual return:
Conclusion for MACD optimization
There is a "best" MACD setting, at least historically. There's no need to guess which MACD setting is best.
With that being said, I caution traders against spending too much time trying to optimize their indicators' settings (e.g. MACD):
- The "best" MACD setting varies significantly from market to market, and also varies significantly based on different times frames.
- The difference between a good setting and a bad setting isn't massive.
- The best MACD setting in the past might not be the best MACD setting in the future. What worked in the past may suddenly (and without warning) stop working in the future.
- What made a MACD setting work better than another MACD setting in the past is probably just due to random luck (i.e. there's no solid reason why one should work better than another).
And finally, MACD IS NOT a holy grail, no matter how popular this indicator is or how many trading gurus promise "EXPLOSIVE MACD strategies" but never show you the non-existent millions they made from trading with MACD.
*As an important sidenote, these returns do not include transaction costs or slippage. After doing so, a MACD with shorter term settings (and hence more transactions) might not outperform a MACD with longer term settings (and hence fewer transactions).