
Uptrends galore, with a breakout in breakouts

This week has been one for the record books, in a number of different ways. Most spectacularly, the surge in small-cap stocks that pushed the Russell 2000 to its best-ever gain while hitting a new high.
The record-breaking rally in that index didn't occur in isolation, of course - the index rallied because many stocks within the index did. And enough of them rallied well enough to tickle 52-week highs. More than 15% of stocks within the Russell managed to score a fresh high on Wednesday, the most since 2016.
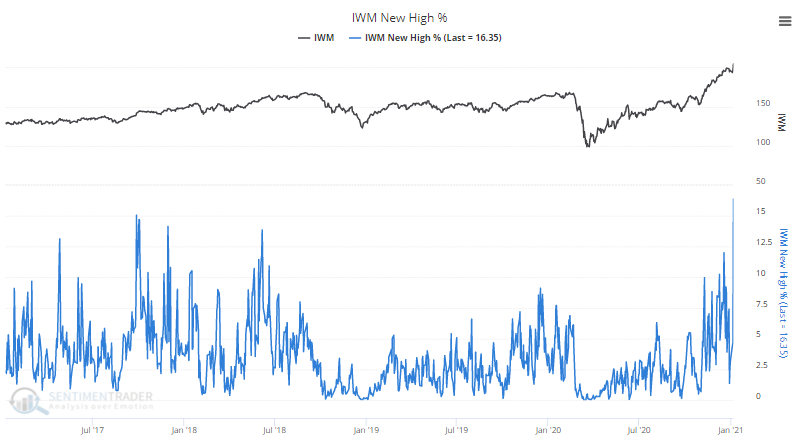
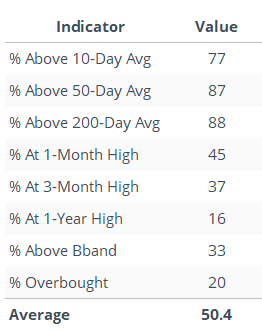
There was a jump in other metrics that track the underlying health and momentum of small-caps. The surge pushed most of them above all moving averages, at multi-month (if not multi-year) highs, into overbought conditions, and outside of their volatility bands.
If we create a composite breadth indicator out of them all, then Wednesday's reading was the highest in several years.
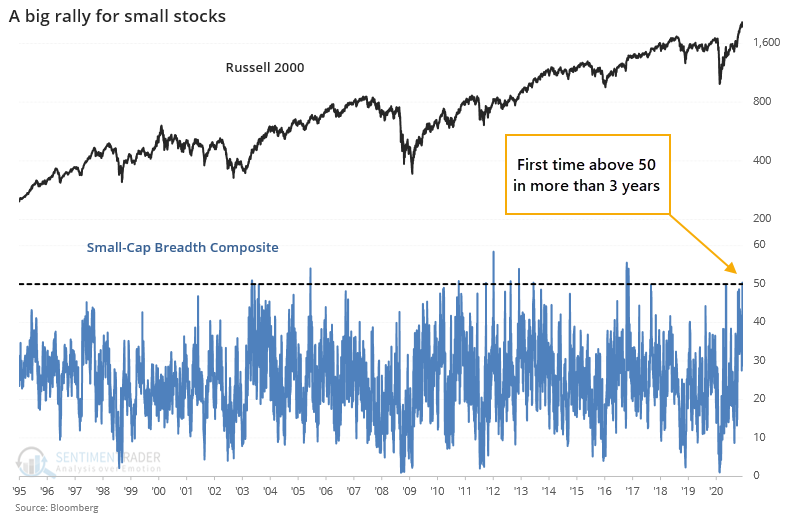
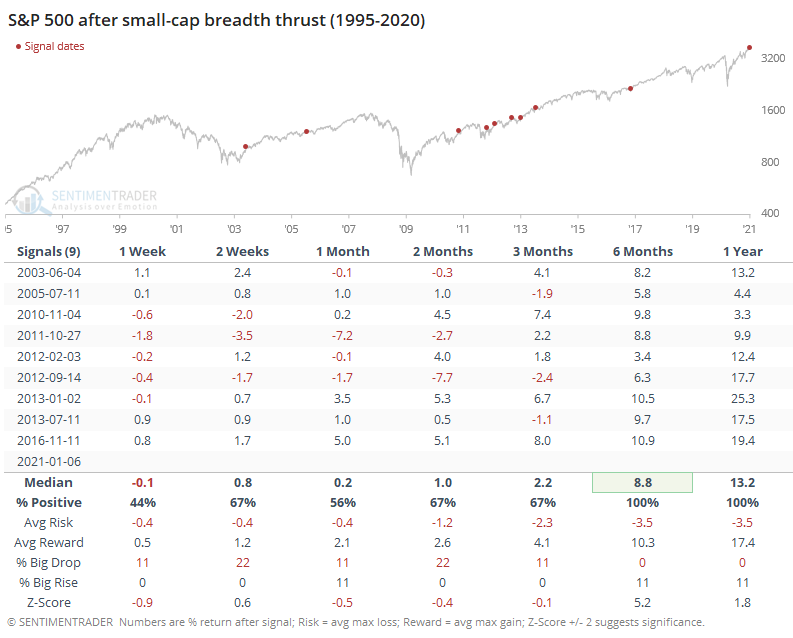
When this composite first jumped above 50, small-cap stocks tended to take a 1-2 week breather (except for the last 2 instances), but over the next year, the Russell 2000 showed a positive return every time.
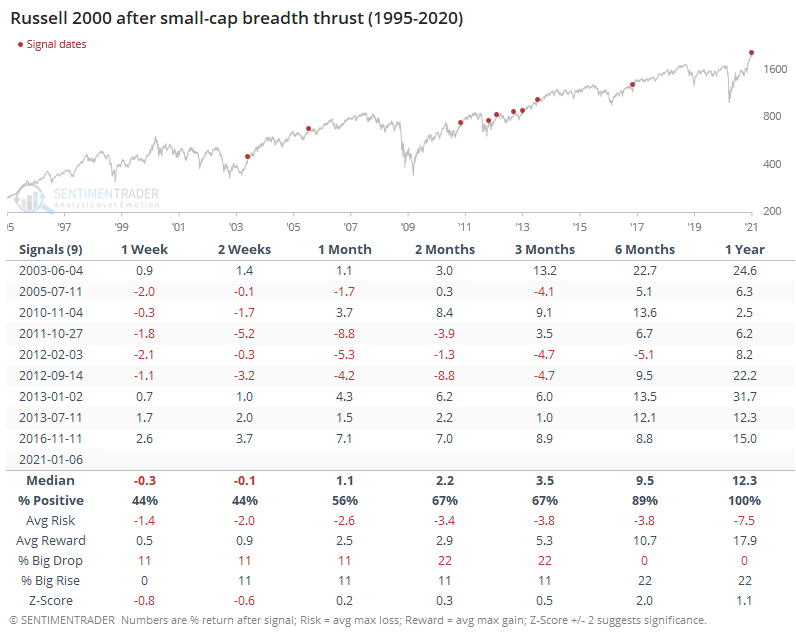
It was an even better sign for the S&P 500, with no losses 6-12 months later.
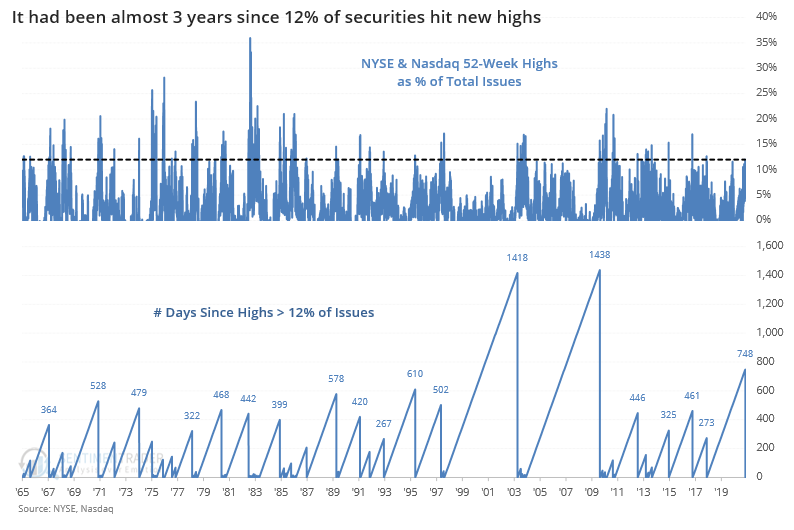
Because small-cap stocks have such an outsized influence on the broader breadth figures, the jump in new highs among those stocks pushed an average of more than 12% of all securities on the NYSE and Nasdaq exchanges to a 52-week high. That ended the 3rd-longest streak since 1965 with fewer than that many new highs.
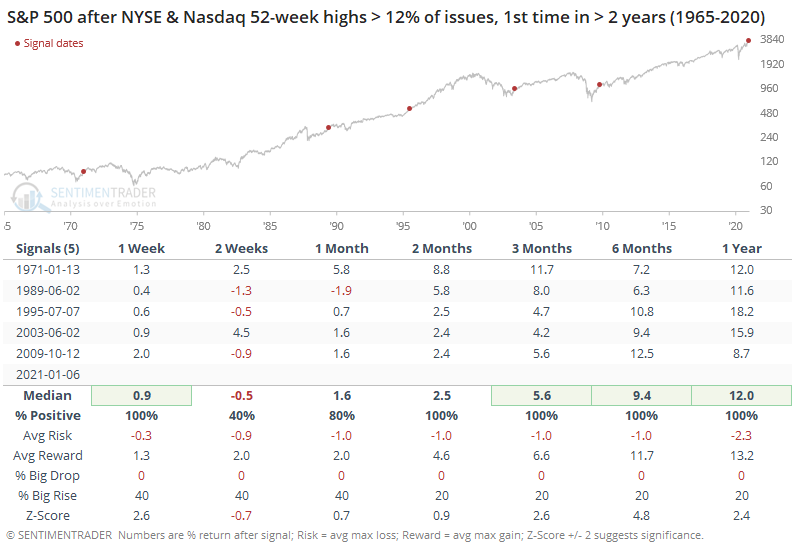
After the few other times these streaks ended after at least 2 years, stocks rallied every time after a temporary breather a few times during the next couple of weeks. These surges marked dramatic endings to major bear markets.
In a note yesterday, Dean looked at every time since the early 1960s when more than 15% of stocks within the S&P 500 hit a new high, and more than half of those highs were set by cyclical/value sectors like Financials, Industrials, and Materials.
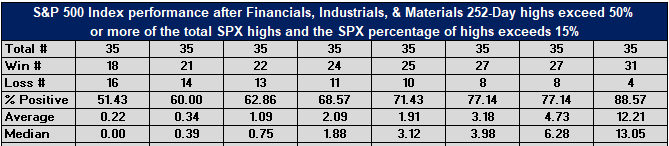
There were 35 signals, and over the next year 31 of those showed a positive return. Shorter-term returns were decent, but it's in the medium- to long-term that these types of signals have had the most positive influence.
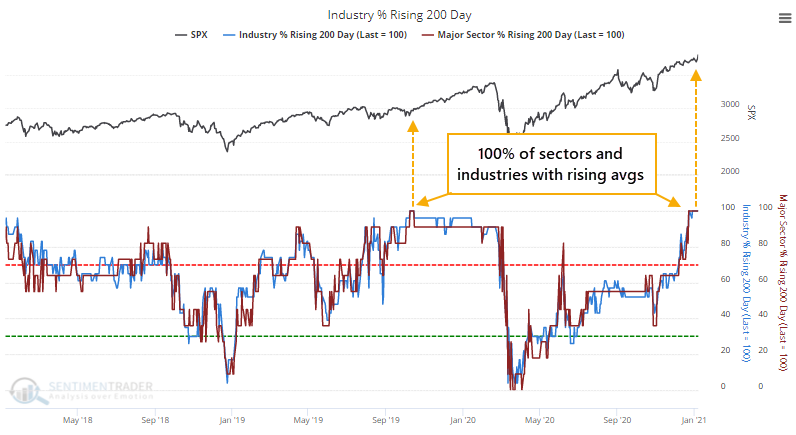
And on a long-term basis, we're seeing remarkable strength. Every major sector and industry (and country) now has a rising 200-day moving average. The only other time in the past 3 years that we've seen this was in early October 2019.
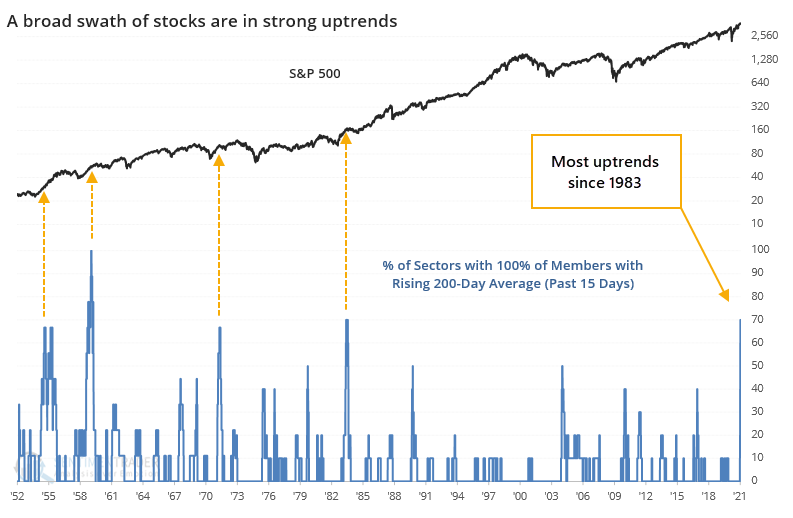
The sectors are rising because the stocks within those sectors are rising, and it's not been primarily driven by only a handful of issues. Dean points out that as of Thursday, within the past 3 weeks, 7 out of 10 sectors have had 100% of their member stocks with rising 200-day moving averages. That's the strongest showing since 1983.
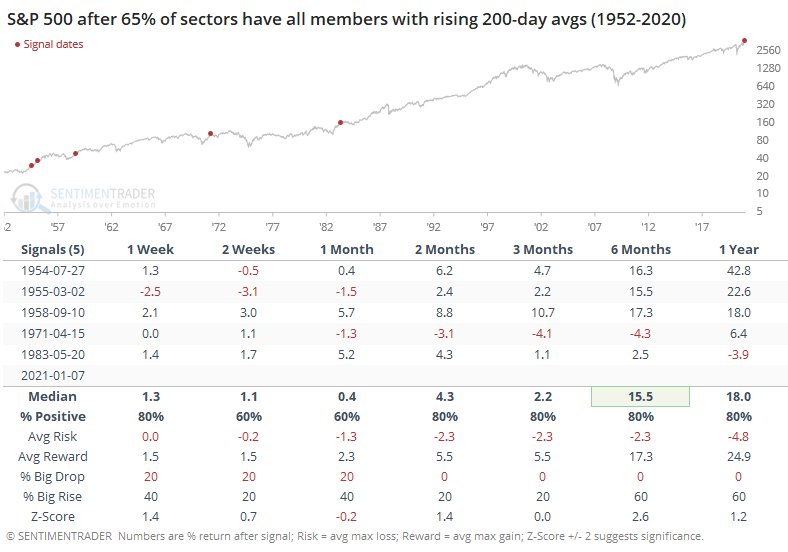
When the market has seen this kind of widespread uptrends before, it meant limited losses for the S&P 500 in the months ahead. Gains also tended to be limited, but again the longer-term time frames showed extremely positive risk/reward ratios.
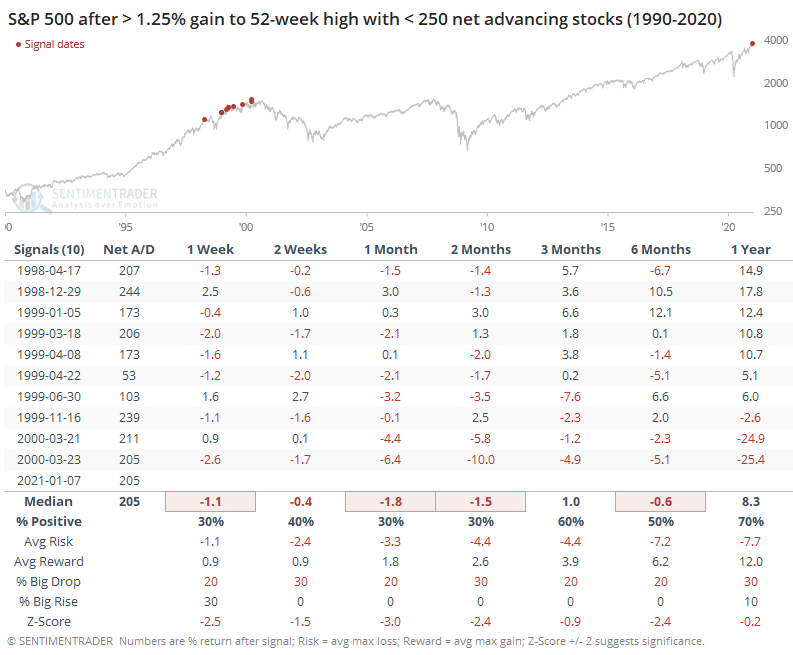
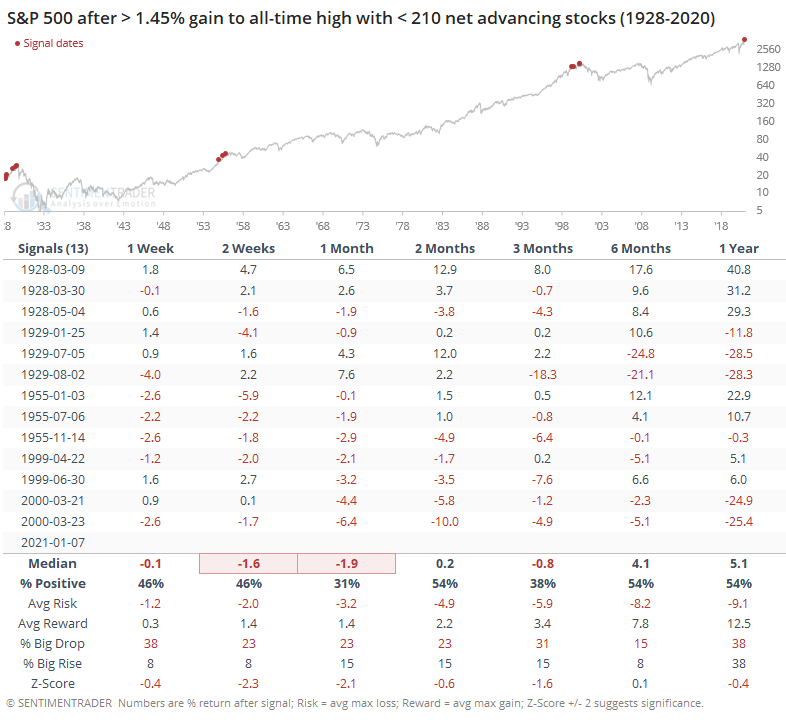
The thing we need to watch out for with momentum is odd readings, days when the indexes might rise but underlying breadth is curiously weak. That happened early last year, it happened in August, and it started happening periodically again in the latter half of December. Even on Thursday, the S&P 500 rose more than 1.25% to an all-time high, yet only a net 205 stocks within the index advanced.
It's hard to square this with the strong readings noted above, but it's likely due to investors rushing into some of the stocks that have recently done the best (pushing them to new highs) while avoiding relatively weaker ones. The last time we saw this was in 2000.
Breath readings get sketchier the further back we go, but if we expand our time frame back to 1928, using more stringent criteria, we can see how odd Thursday's reading truly was.
So...what are we supposed to put the most weight on - the tremendous surge in small-cap stocks and breakout in 52-week highs, which has preceded further gains essentially every time it's ever occurred, or the odd readings that have popped up showing some deterioration under the surface?
When we have put the most weight on breadth thrusts in the past, it has tended to work out. By looking at the breadth and force of participation underlying the major indexes, we have often gotten signals that aren't always readily apparent, and almost without fail, the market has followed through on them. On a longer-term 6-12 month basis, it's extremely hard to bet against these things.
On a multi-week to multi-month basis, it's more of a crapshoot. Even displays of extremely strong underlying momentum have seen stocks often take a breather over that time frame, though losses tended to be minimal. We've seen signs of historic speculation since early December, and nobody with any experience can look at Tesla or bitcoin without seeing bubbly behavior. The difference with what we're seeing now versus 2000 or 2007 is that underlying participation is so broad and intensive.
Whether that's thanks to Messrs. Powell, Biden or Stimmy doesn't really matter. The only thing that matters is that there's a lot of money and it keeps finding its way into stocks. If we continue to see weird days like Thursday, with curiously weak advancing stocks underlying the indexes, then it will add to the short- to medium-term concerns, but for the most part, breadth has been "thrusty" enough to suggest those concerns aren't yet major or long-term.