
Using Social Sentiment Percent indicators as a trading signal for SPY
For a the last month, we've provided two new social sentiment indicators for our premium users (see the announcement of these indicators here).
As we've previously written, these social sentiment indicators are derived int he following manner:
Social Sentiment is sentiment derived from performing automated natural language processing on messages collected from Twitter. Messages that mention a symbol (SPY for example) are collected and analyzed and given a rating of 'bullish', 'bearish' or 'neutral' (some messages are also categorized as 'spam'). From these messages, the percentage of bullish messages and bearish messages are then calculated (based on the total number of messages).
Over the weekend, I ran a few backtests to see how well (or poorly) these signals worked as a trading signal. I ran these tests using the SPY ETF Social Percent Bearish and Social Percent Bullish indicators.
Trading Strategy - Using Social Percent as a trading signal
For the SPY ETF, I used the Social Percent Bullish and Social Percent Bearish indicators and took any extremes provided by these indicators as contrarian indicators.
To keep it simple, each trading strategy uses an 'all-in/all-out' approach and each considered as separate strategies with no insight from the other (for now).
A summary of the results of the strategies:
| SPY Social Percent Bearish | SPY Social Percent Bullish | |
|---|---|---|
| Annual Return | 12.57% | 5.31% |
| Max Drawdown | 7.78% | 13.10% |
| Number of Trades | 15 | 13 |
| % Profitable | 88% | 54% |
Social Percent Bearish
This strategy uses the following rules:
- A buy signal is given when the SPY Social Percent Bearish indicator closes above 0.3. A buy order is placed at the open the day after a signal is generated.
- A sell signal is given when the SPY Social Percent Bearish indicator closes below 0.2. A sell order is placed at the open the day after a signal is generated.
- Commission is a percentage based on the size of the traded shares
- Rather than use a set number of shares, this strategy uses all of the available cash to purchase shares.
- Starting account size is $100K with no margin
- Trading dates are: Dec 1 2011 to Jan 27 2017 (all available dates for our social sentiment indicator).
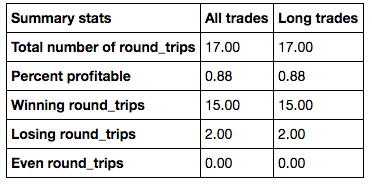
This contrarian trading strategy delivers an average annual return of 12.57% per year with 15 trades over the course of just over 5 years. This strategy delivers 88% profitable trades and the average length of a trade is 61 days with the median duration of trade being 43 days. Maximum drawdown was 7.78%.
Trading and performance statistics are provided below. Performance statistics provide backtest-data (in-sample) and out-of-sample data statistics.
[caption id="attachment_1134" align="aligncenter" width="372"] Table 1: SPY Social Percent Bearish Summary Statistics[/caption]
[caption id="attachment_1135" align="aligncenter" width="393"]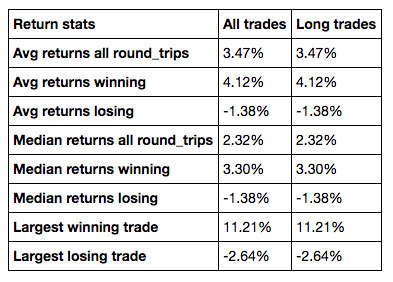 Table 2: SPY Social Percent Bearish Return Statistics[/caption]
[caption id="attachment_1136" align="aligncenter" width="429"]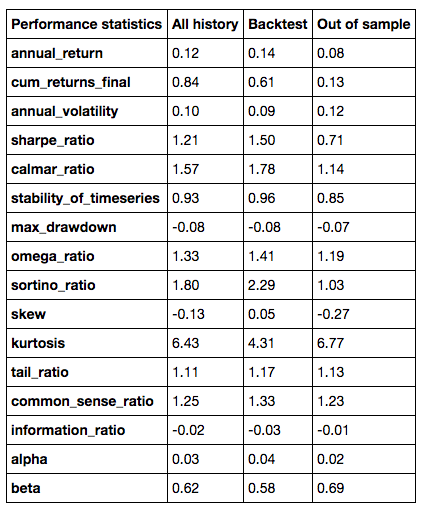 Table 3: SPY Social Percent Bearish Performance Statistics[/caption]
[caption id="attachment_1137" align="aligncenter" width="667"]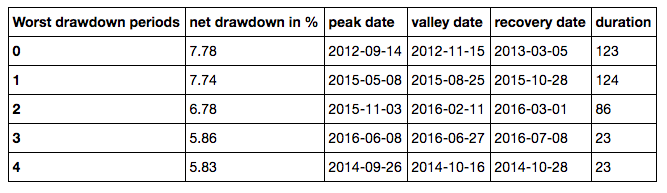 Table 4: SPY Social Percent Bearish Drawdown[/caption]
[caption id="attachment_1144" align="aligncenter" width="650"]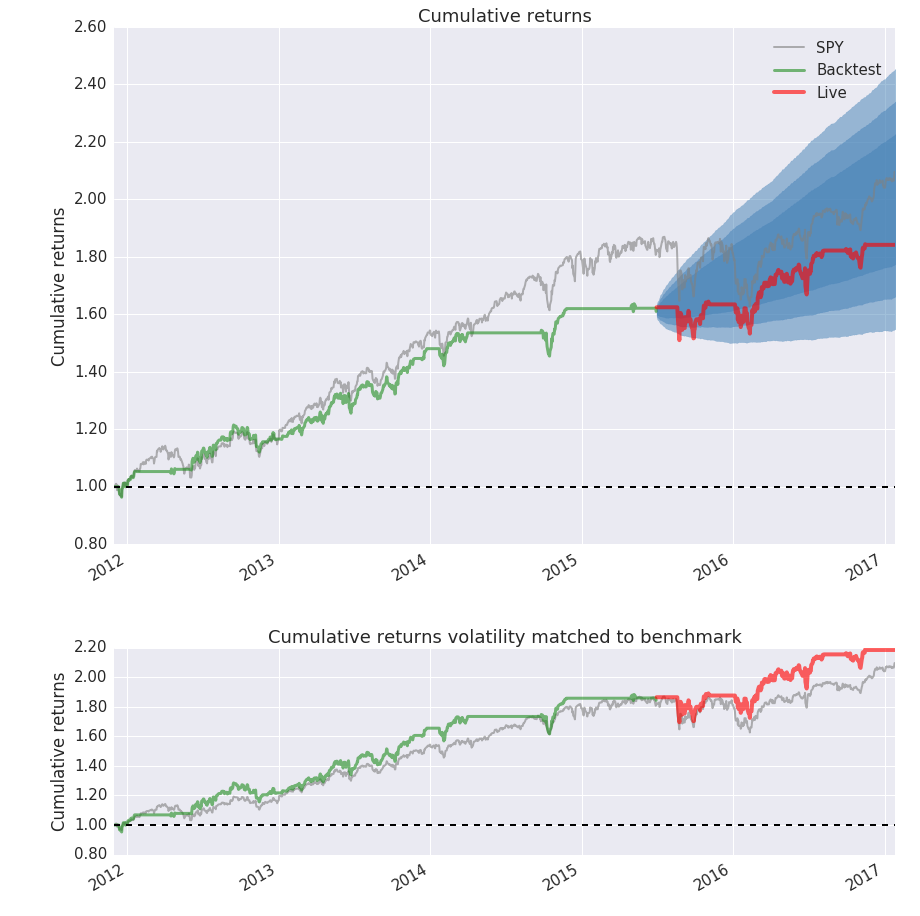 Figure 1: SPY Social Percent Bearish Performance Chart[/caption]
Social Percent Bullish
This strategy uses the following rules:
- A buy signal is given when the SPY Social Percent Bullish indicator closes above 0.3. A buy order is placed at the open the day after a signal is generated.
- A sell signal is given when the SPY Social Percent Bullish indicator closes below 0.2. A sell order is placed at the open the day after a signal is generated.
- Commission is a percentage based on the size of the traded shares
- Rather than use a set number of shares, this strategy uses all of the available cash to purchase shares.
- Starting account size is $100K with no margin
- Trading dates are: Dec 1 2011 to Jan 27 2017 (all available dates for our social sentiment indicator).
This contrarian trading strategy delivers an average annual return of 5.31% per year with 13 trades over the course 5 years and 1 month. This strategy delivers 54% profitable trades and the average length of a trade is 86 days with the median duration of trade being 39 days. Maximum drawdown was 13.10%.
Trading and performance statistics are provided below. Performance statistics provide backtest-data (in-sample) and out-of-sample data statistics.
[caption id="attachment_1139" align="aligncenter" width="367"]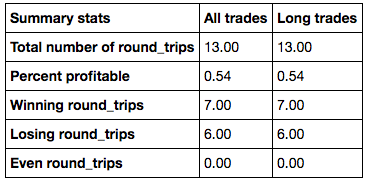 Table 5: SPY Social Percent Bullish Summary Statistics[/caption]
[caption id="attachment_1140" align="aligncenter" width="392"]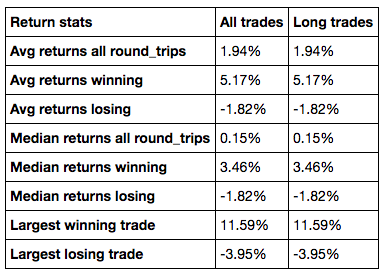 Table 6: SPY Social Percent Bullish Return Statistics[/caption]
[caption id="attachment_1141" align="aligncenter" width="427"]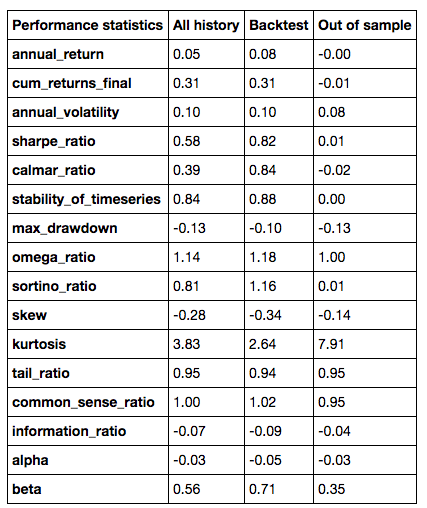 Table 7: SPY Social Percent Bullish Performance Statistics[/caption]
[caption id="attachment_1142" align="aligncenter" width="656"]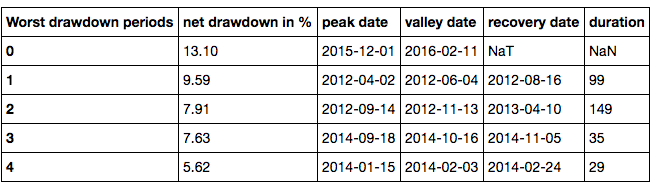 Table 8: SPY Social Percent Bullish Drawdown Statistics[/caption]
[caption id="attachment_1145" align="aligncenter" width="650"]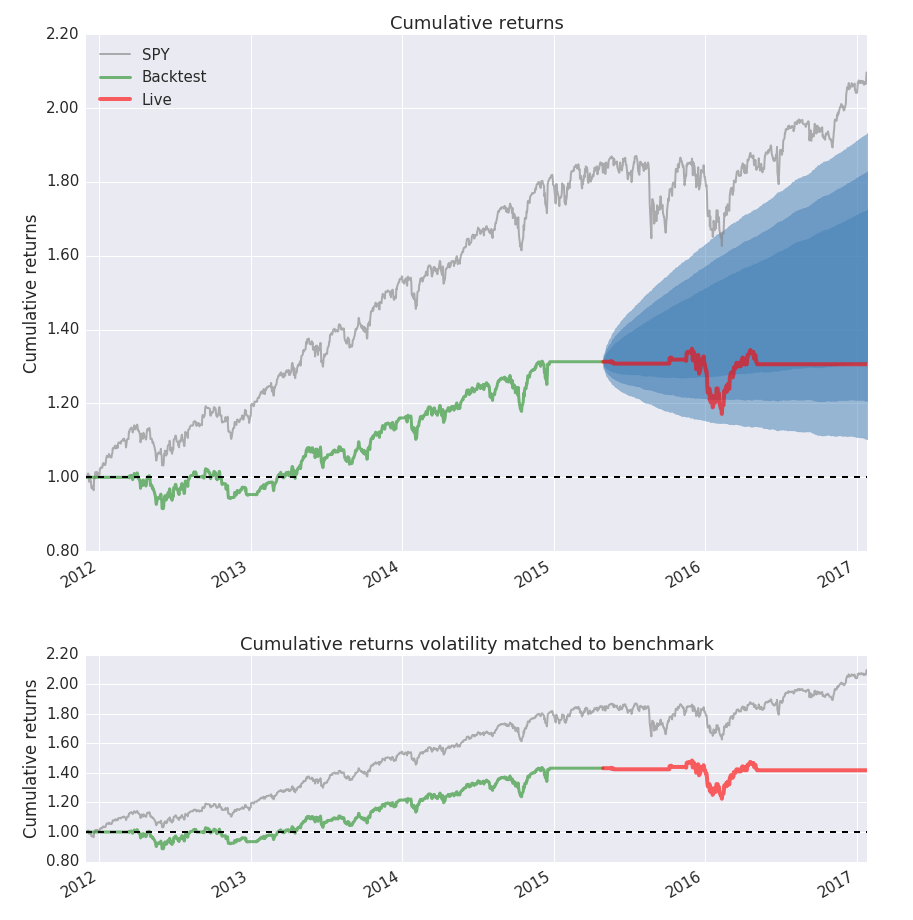 Figure 2: SPY Social Percent Bullish Performance Charts[/caption]