Products
SentimenTrader Trading Tools
‍
Backtest Engine
My Trading Toolkit
Correlation Analysis
Seasonality
Indicators & Data API
‍
Proprietary Indicators & Charts
Market Data API
Strategies & Scanner
‍
50+ Trading Strategies
Smart Stock Scanner
Research Reports
‍
Research Solutions
Reports Library
Free Resources
Simple Backtest Calculator
Simple Seasonality Calculator
The Kelly Criterion Calculator
Sentiment Geo Map
Public Research Reports
Pricing
Company
About
In the News
Testimonials
Client Success Stories
Contact
Log inLoginSign up
< BACK TO ALL REPORTS

Volatility flip

Jason Goepfert
2020-04-03
Implied volatility in the Nasdaq 100 has been lower than for the S&P 500 for three straight weeks. This is highly unusual, since big tech stocks tend to be more volatile than the broader market. Over these weeks, there has been a record spread between the VXN and the VIX.

It's a volatile market, and not just in the typical ways.

Traders usually price in bigger moves in higher-beta stocks, because by their very nature they move up and down more than the broader market. But an interesting thing has been happening over the past few weeks. As noted by the Wall Street Journal, options traders are pricing in smaller moves in the tech-laden Nasdaq 100 (NDX) than for the S&P 500 (SPX).

Volatility in the NDX has historically been higher than the SPX, both because there are fewer stocks in the index and the big tech firms that make up the NDX just tend to move around a lot more due to the nature of their businesses. But because some of these firms have benefited from the stay-at-home orders, tech stocks have held up relatively well, and traders have been pricing in smaller moves.

As a result, implied volatility for the Nasdaq 100, the VXN, has been below that for the S&P 500, the VIX, for the past 3 weeks. This is highly unusual.

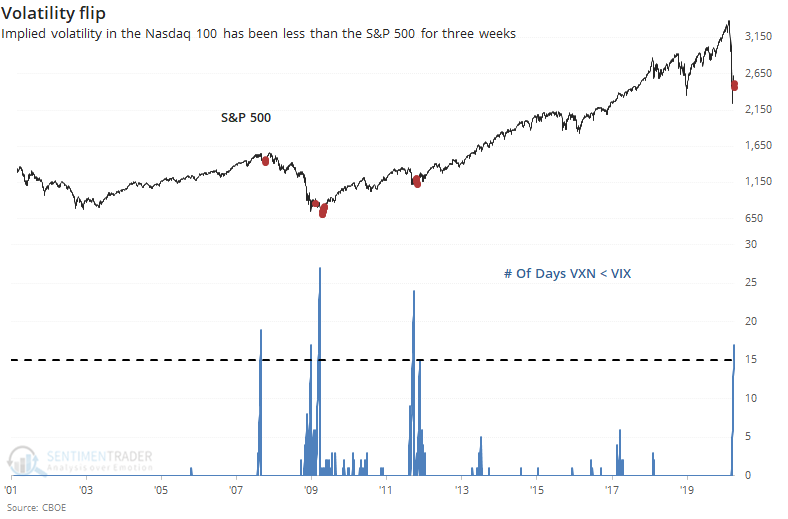
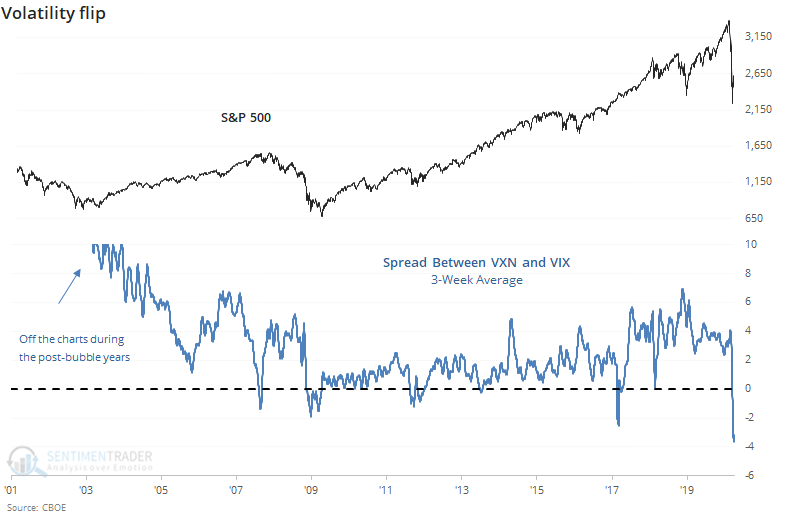
The spread between them is at a record.

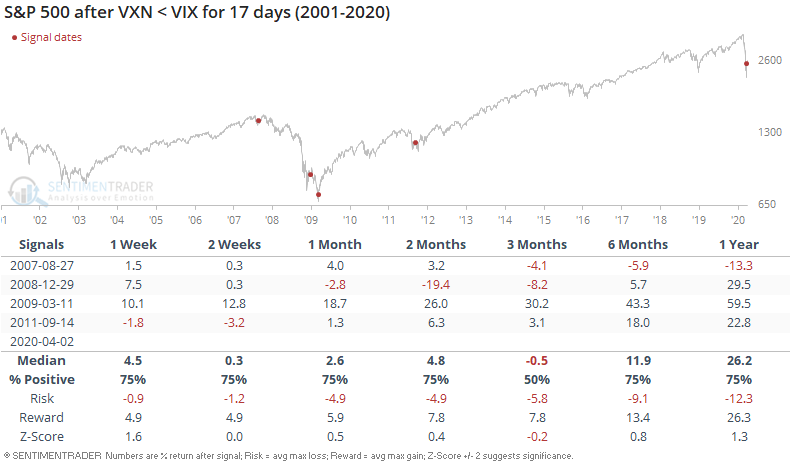
By the time the spread between the two implied volatility gauges had been negative for this many days, the S&P rebounded quickly three times (then failed twice) and sold off quickly once then rallied strongly.

The Nasdaq 100 fared better.

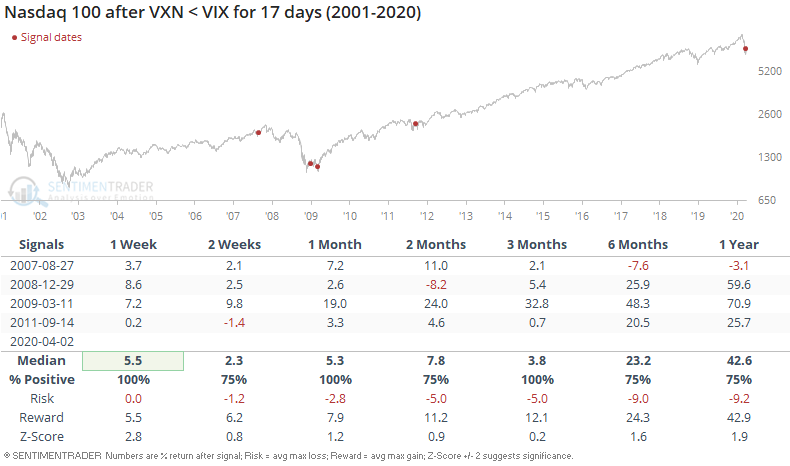
Even though the ratio of the Nasdaq 100 to S&P 500 has gone parabolic, these implied volatility flips tended to lead to even more out-performance in the NDX vs SPX.

This should be a good sign for stocks in general, and tech in particular.

Sorry, you don't have access to this report

Upgrade your subscription plan to get access
Go to Dasboard
PRODUCTS
SentimenTrader
Trading Tools
Indicators & Data API
‍
Strategies & Scanner
‍
Research Reports
FREE
RESOUrCES
Simple Backtest
Calculator
Simple Seasonality
Calculator
The Kelly Criterion
Calculator
Sentiment Geo Map
‍
Public Research Reports
‍
Pricing
Bundle pricing
‍
Announcements
‍
FAQ
COMPANY
‍
About
‍
In the News
‍
Testimonials
‍
Client Success Stories
CONTACT
‍
General Inquiries
‍
Media Inquiries
‍
Financial Professionals Inquiries
‍
© 2025 Sundial Capital Research Inc. All rights reserved.
Setsail Marketing
TermsPrivacyAffiliate Program
Risk Disclosure: Futures and forex trading contains substantial risk and is not for every investor. An investor could potentially lose all or more than the initial investment. Risk capital is money that can be lost without jeopardizing ones’ financial security or life style. Only risk capital should be used for trading and only those with sufficient risk capital should consider trading. Past performance is not necessarily indicative of future results.

Hypothetical Performance Disclosure: Hypothetical performance results have many inherent limitations, some of which are described below. No representation is being made that any account will or is likely to achieve profits or losses similar to those shown; in fact, there are frequently sharp differences between hypothetical performance results and the actual results subsequently achieved by any particular trading program. One of the limitations of hypothetical performance results is that they are generally prepared with the benefit of hindsight. In addition, hypothetical trading does not involve financial risk, and no hypothetical trading record can completely account for the impact of financial risk of actual trading. for example, the ability to withstand losses or to adhere to a particular trading program in spite of trading losses are material points which can also adversely affect actual trading results. There are numerous other factors related to the markets in general or to the implementation of any specific trading program which cannot be fully accounted for in the preparation of hypothetical performance results and all which can adversely affect trading results.

Testimonial Disclosure: Testimonials appearing on this website may not be representative of other clients or customers and is not a guarantee of future performance or success.