
Volatility is slowly easing

Volatility in March has been high, which is not news to anyone. In some of the studies we looked at, like the percentage gaps at the open of trading, volatility has never been higher.
When thinking about volatility, most people gravitate toward the VIX "fear gauge." It's a handy measure for sure, but only goes back to 1990, or 1986 if we use the old calculation.
In the past, we've looked at a simulated VIX indicator that uses several different models to recreate what the VIX might have done if it existed at the time. Over the past couple of decades, the model has a 90% correlation to the VIX itself, so it's done a good job. Any model will have a hard time with outliers like the Black Monday crash in 1987 and this was no exception.
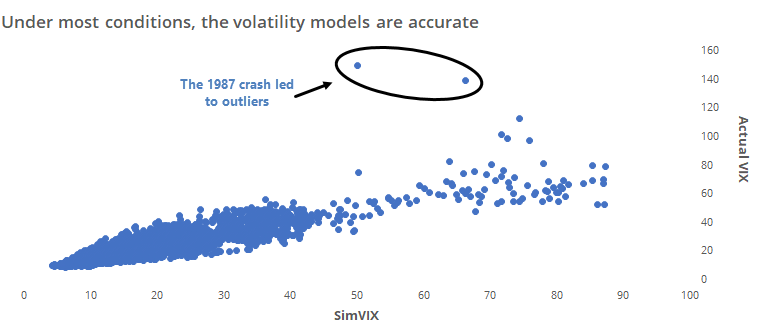
Any model is imperfect, but they at least give us some idea of what things might have looked like if the options-based creation had more history. For those who enjoy twisting their minds around arcane academic papers, here you go.
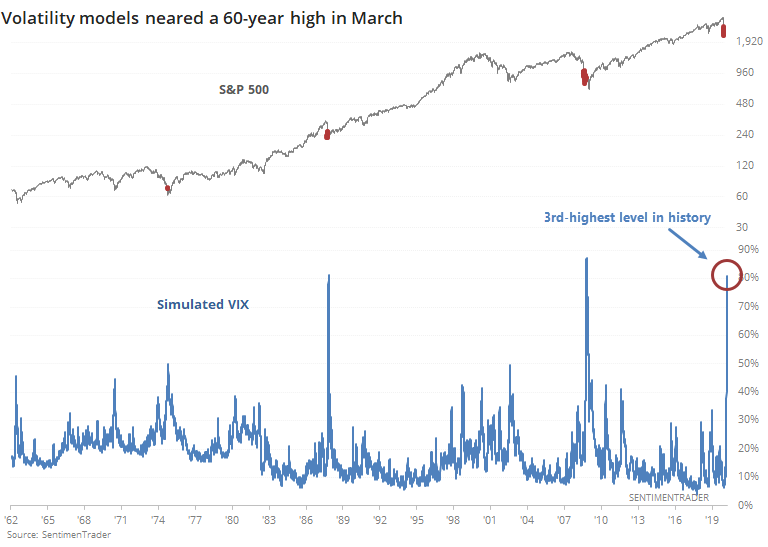
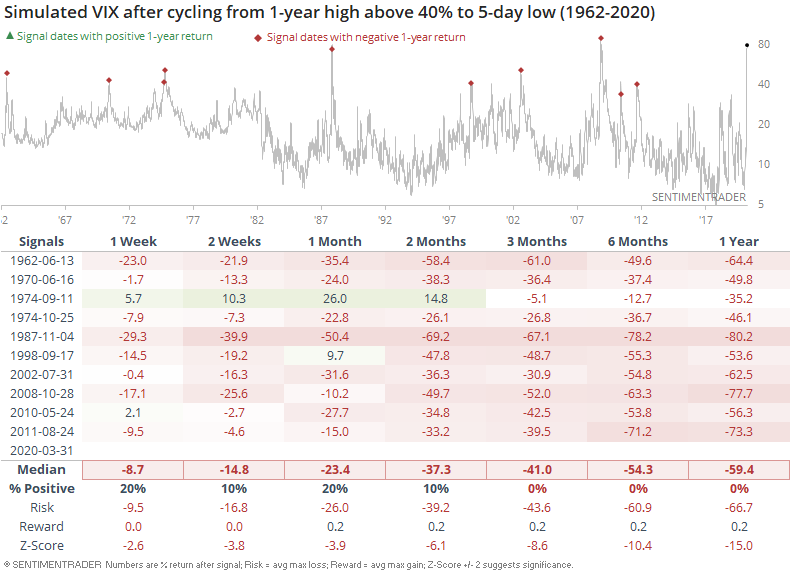
This simulated VIX (SimVIX) just peaked above 80%, which was barely eclipsed by a few days in 1987 and 2008.
The key term there might be "peaked." The SimVIX has gone from its highest level in years to a 5-day low as of Tuesday.
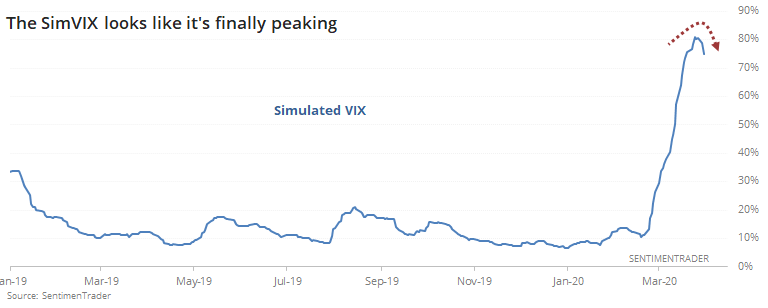
A 5-day low might seem insignificant, but when this indicator turns from an extreme, it has tended to keep going longer-term.
For stocks, this typically meant a lot of shorter-term swings, usually to the downside, while hammering out important low points.
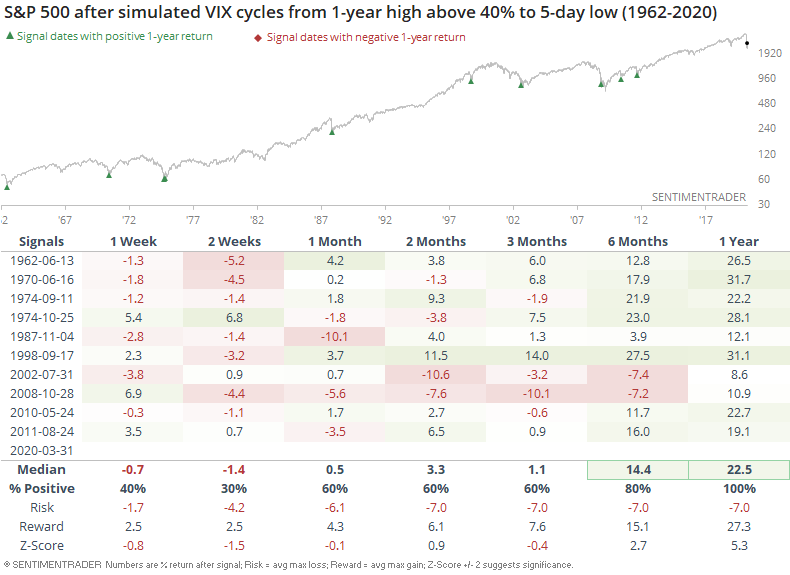
The next couple of weeks in the S&P were painful a few times, and in 2002 and 2008, it lasted even longer. But those lower lows didn't last long, and over the next 6-12 months, it was almost all upside.
For volatility itself, it's not a big surprise that these moves rarely led to even higher volatility going forward. Only once, in 1974, did it do an about-face and exceed its prior high.
The past few weeks have seen all kinds of "never seen before" developments, but as far as we can rely on historical behavior, this easing of volatility after such a severe spike should be more good news.