Products
SentimenTrader Trading Tools
‍
Backtest Engine
My Trading Toolkit
Correlation Analysis
Seasonality
Indicators & Data API
‍
Proprietary Indicators & Charts
Market Data API
Strategies & Scanner
‍
50+ Trading Strategies
Smart Stock Scanner
Research Reports
‍
Research Solutions
Reports Library
Free Resources
Simple Backtest Calculator
Simple Seasonality Calculator
The Kelly Criterion Calculator
Sentiment Geo Map
Public Research Reports
Pricing
Company
About
In the News
Testimonials
Client Success Stories
Contact
Log inLoginSign up
< BACK TO ALL REPORTS

Wall Street is taking the other side of individuals' pessimism

Jason Goepfert
2021-12-28
As we head into year-end and Wall Street strategists update their year-ahead price targets, they expect the S&P 500 to continue to rally. At this time of year, when the index is near a high and strategists expect it to continue to rally, it usually does.

Key points:

  • Wall Street strategists expect the S&P 500 to gain about 5% over the next year
  • Nearing year-end, this kind of discount has tended to lead to higher prices for the index

Strategists have modest (but positive) expectations for the S&P 500

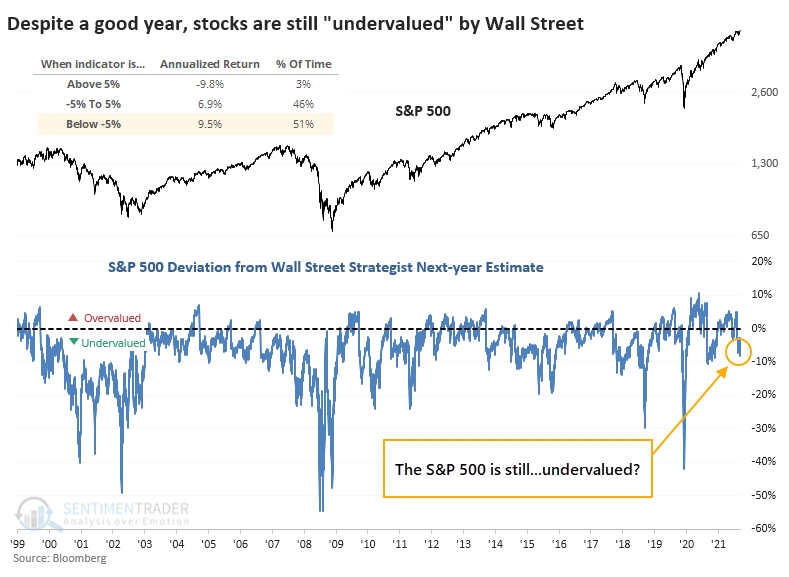
We saw on Monday that individual investors are pessimistic. Wall Street isn't - analysts are busy upgrading price targets, and strategists expect the S&P 500 to add to its gains in the new year. Strategists' average price target for the S&P 500 over the next year is nearly 5% higher than where the S&P was on Monday, suggesting the index is undervalued. LOL.

There are a whole host of caveats with this, including that Bloomberg only sporadically surveys Wall Street, so this could change quickly, but their estimates would likely be increased, not decreased.

Based on current figures, when the S&P is more than 4.5% below strategists' year-ahead estimated price, the index returned an annualized +9.5%, versus a wretched -9.8% when the index was at least 4.5% above strategists' estimate.

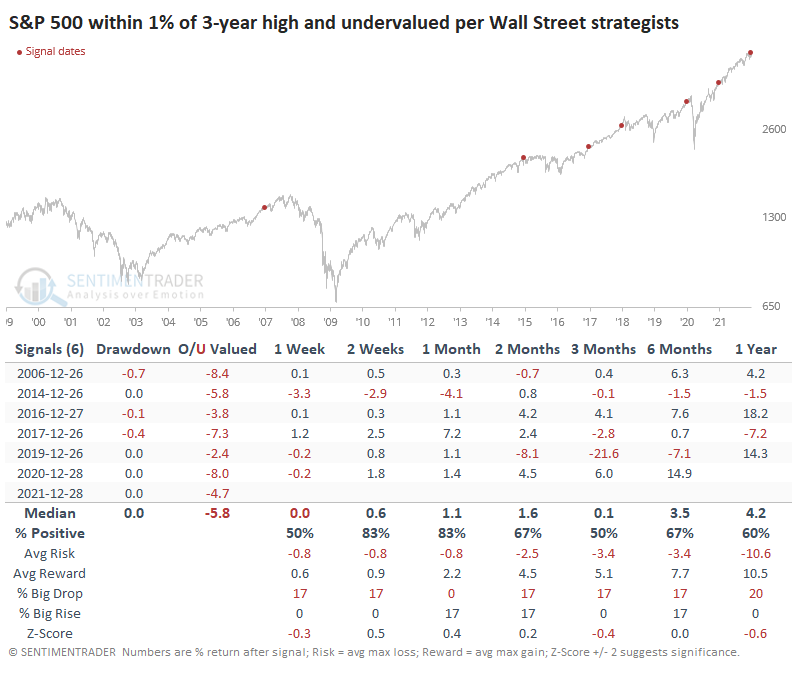
Looking at all years when there were 3 trading days left in the year, and the S&P was within 1% of a multi-year high, this is one of a handful that shows the S&P was still undervalued. And that was mostly a good sign for forward returns, especially in the first couple weeks of the new year. The only loser, in early 2015, reversed its losses in February.

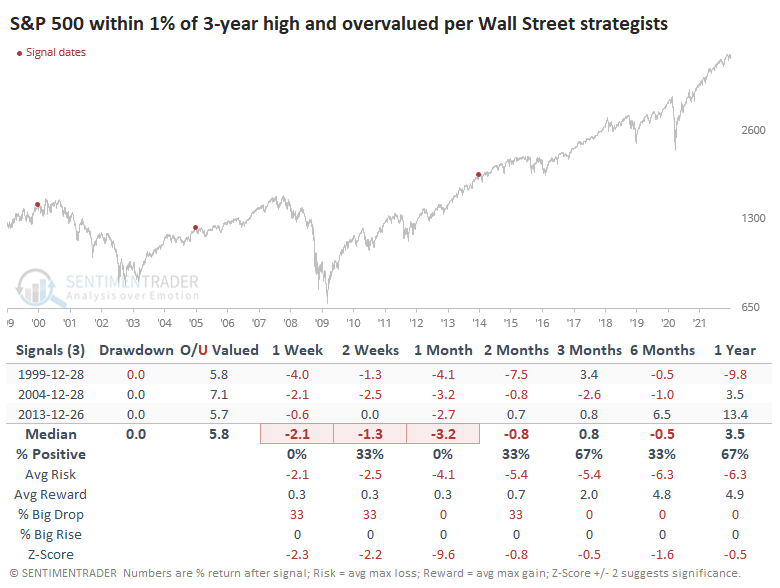
There were only 3 years when the S&P was within 1% of a high, and strategists thought the index was overvalued. All preceded declines.

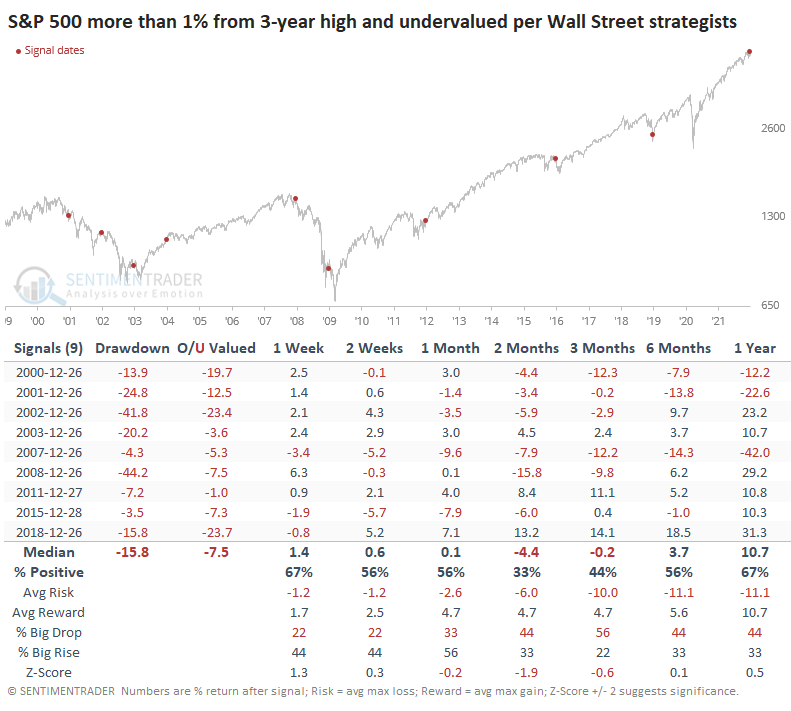
When the S&P was further from a high (mostly bear market environments), forward returns were significantly worse even if strategists thought the index was undervalued.

What the research tells us...

Wall Street analysts and strategists are considered among the smartest of smart money. That isn't always the case, but when it comes to strategists, the S&P 500 does tend to revert toward their price targets over time. Granted, they have a 9% return as a baseline and rarely stray too far. When the S&P gets too far above or below their estimates, the index tends to snap back. The idea that it's currently about 5% below strategists' estimates suggests it has more room to rally.

Sorry, you don't have access to this report

Upgrade your subscription plan to get access
Go to Dasboard
PRODUCTS
SentimenTrader
Trading Tools
Indicators & Data API
‍
Strategies & Scanner
‍
Research Reports
FREE
RESOUrCES
Simple Backtest
Calculator
Simple Seasonality
Calculator
The Kelly Criterion
Calculator
Sentiment Geo Map
‍
Public Research Reports
‍
Pricing
Bundle pricing
‍
Announcements
‍
FAQ
COMPANY
‍
About
‍
In the News
‍
Testimonials
‍
Client Success Stories
CONTACT
‍
General Inquiries
‍
Media Inquiries
‍
Financial Professionals Inquiries
‍
© 2025 Sundial Capital Research Inc. All rights reserved.
Setsail Marketing
TermsPrivacyAffiliate Program
Risk Disclosure: Futures and forex trading contains substantial risk and is not for every investor. An investor could potentially lose all or more than the initial investment. Risk capital is money that can be lost without jeopardizing ones’ financial security or life style. Only risk capital should be used for trading and only those with sufficient risk capital should consider trading. Past performance is not necessarily indicative of future results.

Hypothetical Performance Disclosure: Hypothetical performance results have many inherent limitations, some of which are described below. No representation is being made that any account will or is likely to achieve profits or losses similar to those shown; in fact, there are frequently sharp differences between hypothetical performance results and the actual results subsequently achieved by any particular trading program. One of the limitations of hypothetical performance results is that they are generally prepared with the benefit of hindsight. In addition, hypothetical trading does not involve financial risk, and no hypothetical trading record can completely account for the impact of financial risk of actual trading. for example, the ability to withstand losses or to adhere to a particular trading program in spite of trading losses are material points which can also adversely affect actual trading results. There are numerous other factors related to the markets in general or to the implementation of any specific trading program which cannot be fully accounted for in the preparation of hypothetical performance results and all which can adversely affect trading results.

Testimonial Disclosure: Testimonials appearing on this website may not be representative of other clients or customers and is not a guarantee of future performance or success.