
Watch Aussie Dollar for Important Clue Regarding Commodities

If there is one thing you can say about commodities as an asset class, they are not dull. Consider the movements in the Goldman Sachs Commodity Index (GSCI):
- From Jan 2007 through Jun 2008 = +92%
- From Jun 2008 through Apr 2020 = (-87%)
- From Apr 2020 through Jul 2021 = +96%
And in August so far, the index has declined as much as -9%.
This propensity for large price movements creates the opportunity for large gains. It also creates the risk of large losses. For this reason, it is essential to know where to look when trying to ride the trend.
As it turns out, one of the best places to look is "Down Under."
THE AUSTRALIAN DOLLAR ("The Aussie")
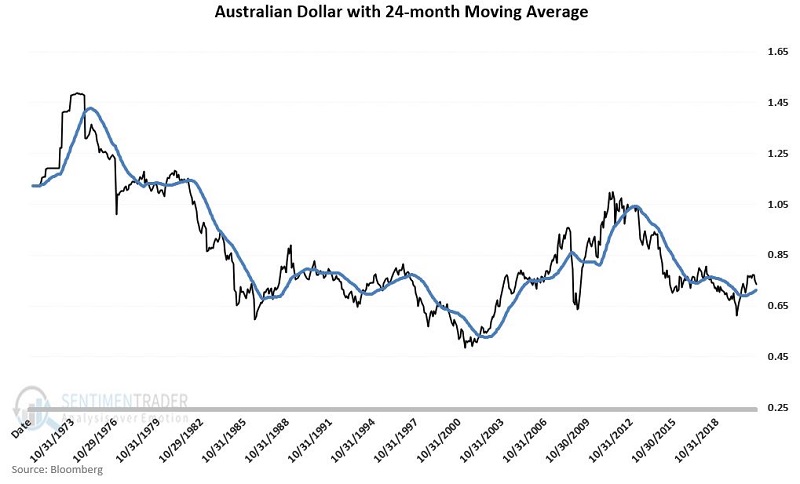
The chart below displays the monthly closing price of the Australian Dollar ("The Aussie") versus its own 24-month moving average.
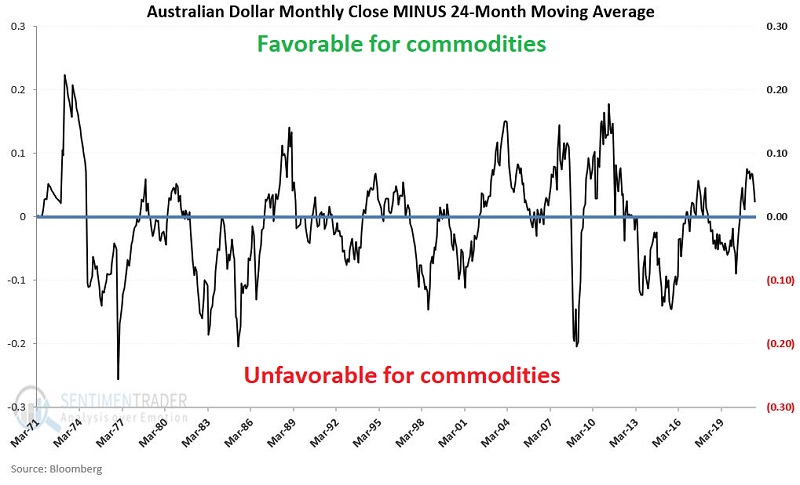
The next chart displays the difference between the two lines in the chart above. Note that we designate:
- Positive readings as "Favorable for Commodities"
- Negative readings as "Unfavorable for Commodities"
GOLDMAN SACHS COMMODITY INDEX ("GSCI")
So why these labels? To answer that question, we will use monthly total return data for the Goldman Sachs Commodity Index ("GSCI") as a proxy for commodities as an asset class.
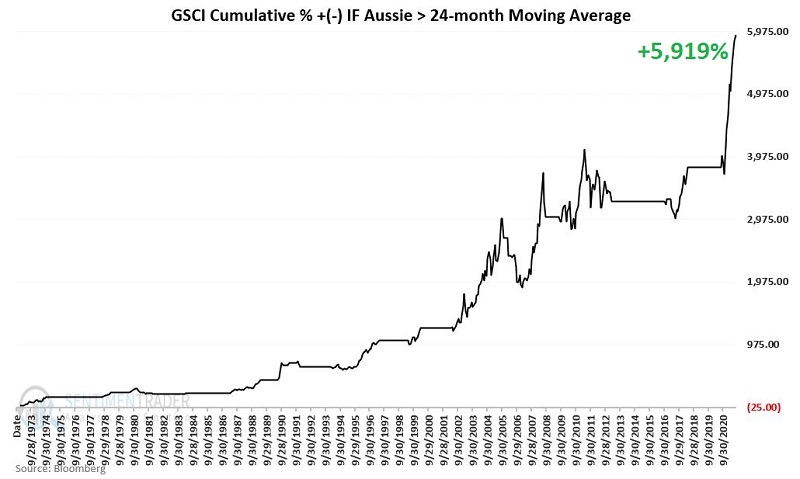
The chart below displays the cumulative growth for the GSCI:
- ONLY during the months when the AUSSIE closed the previous month ABOVE its 24-month moving average
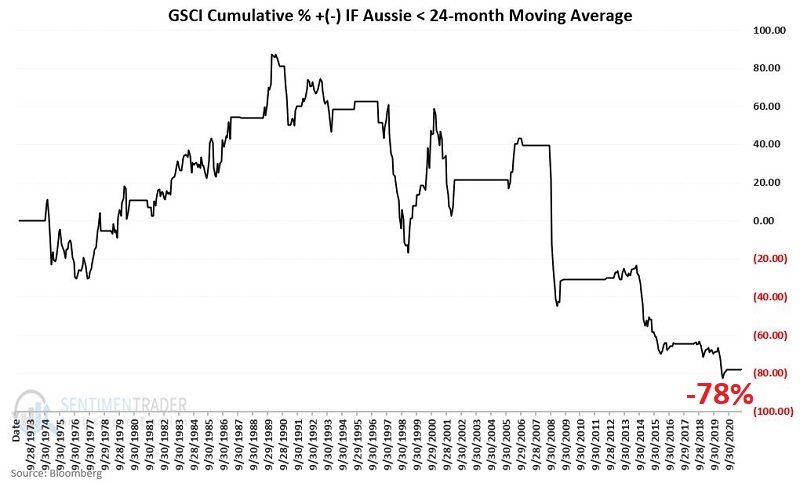
The chart below displays the cumulative growth for the GSCI:
- ONLY during the months when the AUSSIE closed the previous month BELOW its 24-month moving average
PUTTING PERFORMANCE INTO PERSPECTIVE
From January 1973 through July 2021, the GSCI:
- Gained +5,919% when the Aussie was above its 24-month moving average
- Lost -78% when the Aussie was below its 24-month moving average
At the moment, the Aussie is threatening to close the month of August below its 24-month moving average. If it does, this indicator will flip:
- From "Favorable for commodities"
- To "Unfavorable for commodities"
- For the first time since the end of April 2020
Should this happen, does that mean that commodities are doomed to decline? Not at all.
As you can see in the charts above, there are times when commodities lose ground despite the Aussie being above its 24-month moving average and when commodities gain ground when the Aussie is below its 24-month moving average.
So, remember, we are talking "long term perspective" here and NOT "precision market timing." The real question is, "when does it make sense to commit capital to commodities."
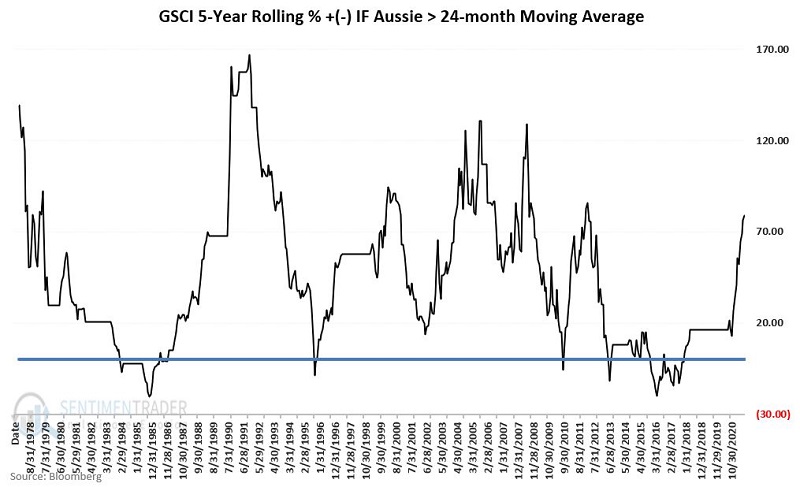
The chart below displays the rolling 5-year return for GSCI when the Aussie was above its 24-month moving average.
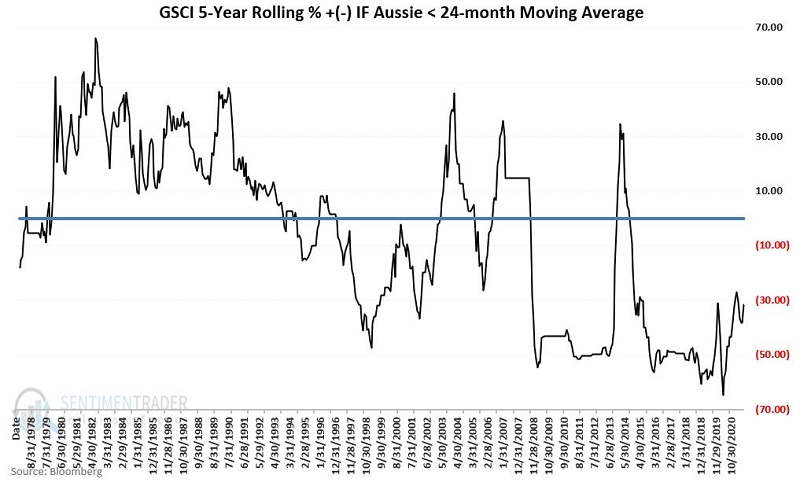
The chart below displays the rolling 5-year return for GSCI when the Aussie was below its 24-month moving average.
For the record:
- The cumulative 5-year return for holding the GSCI ONLY when the Aussie was above its 24-month average showed a gain 88% of the time
- The cumulative 5-year return for holding the GSCI ONLY when the Aussie was below its 24-month average showed a gain 47% of the time
KEEPING TRACK
A simple way to keep track is to monitor the following ETFs:
- Ticker FXA (Invesco CurrencyShares Australian Dollar Trust), which attempts to track Aussie dollar futures
- Ticker GSG (iShares S&P GSCI Commodity-Indexed Trust) which attempts to track the Goldman Sachs Commodity Index
In the chart below (courtesy of AIQ TradingExpert), we see these two tickers.
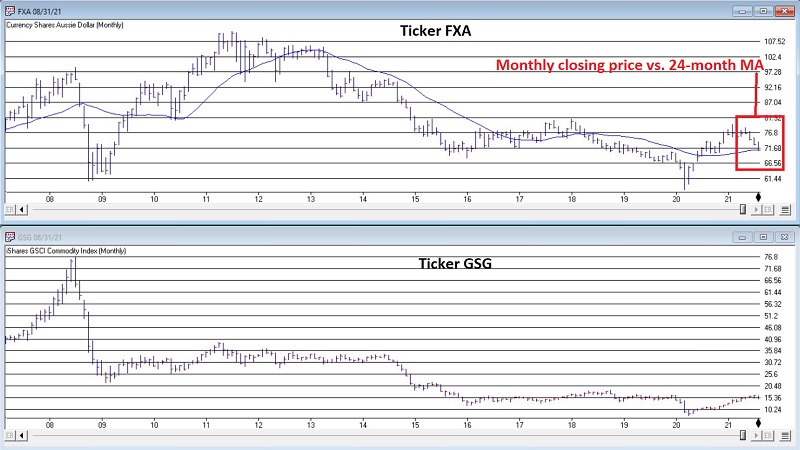
Two things to note are:
- The high degree of correlation between the two
- The fact that FXA is flirting with its 24-month simple moving average
If you are looking for a clue as to whether commodities will rebound and extend their gains of the past year or not, the Australian Dollar may offer a valuable clue.