
We haven't seen extremes like this in 15 years

Overboard on options
Ever since options speculation reached a euphoric spasm in late August through early September, we've been closely watching this behavior.
It ebbed a bit in September as many of the call options lost all their value. It has been returning in recent weeks and the holiday-shortened upside bias led to more of the same.
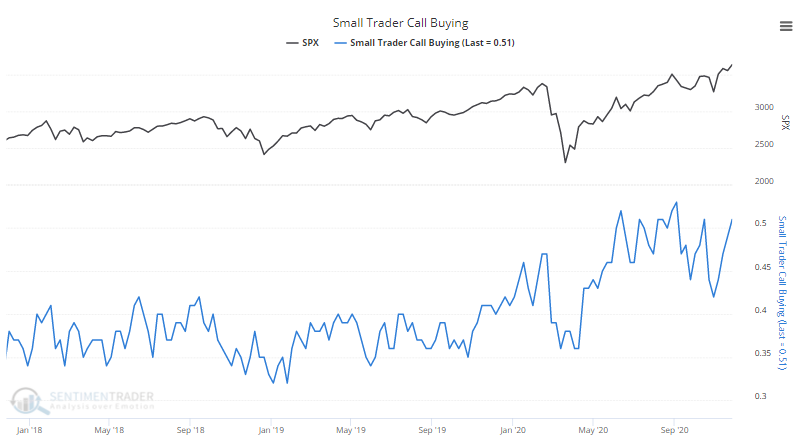
The smallest of traders spent more than 50% of their volume last week buying speculative call options. That has been exceeded by only a few weeks in recent months (and hadn't been exceeded by any week since the year 2000).
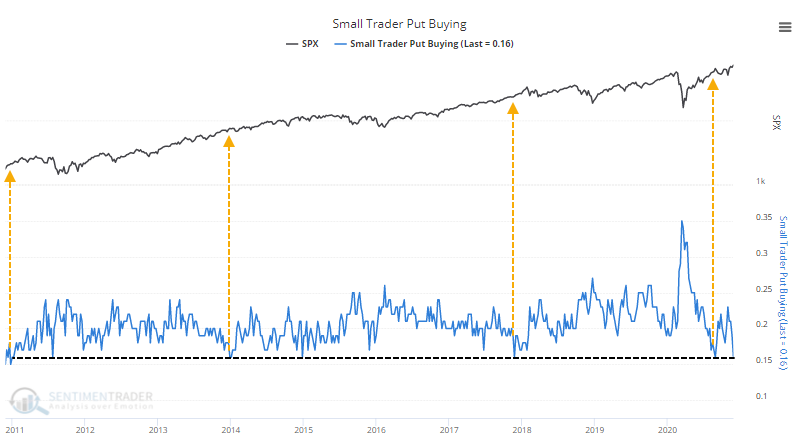
A change from recent weeks is that they also pulled back heavily on buying protective put options. Put buying made up only 16% of the volume among these traders, among the lowest in a decade.
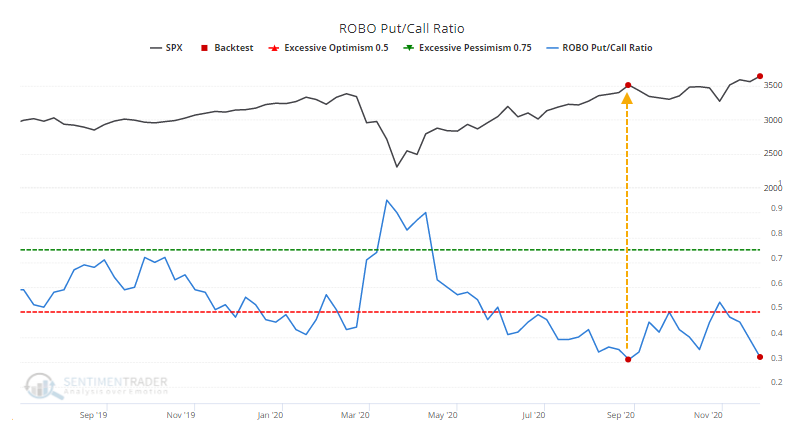
All of this activity means that the ROBO Put/Call Ratio is showing that small traders bought to open more than twice as many calls as puts, a rarely-seen level of speculative fervor.
Only late August can compare.
Prior to that, only many of the weeks in the year 2000, then again a single week in 2004 have matched this level of confidence.
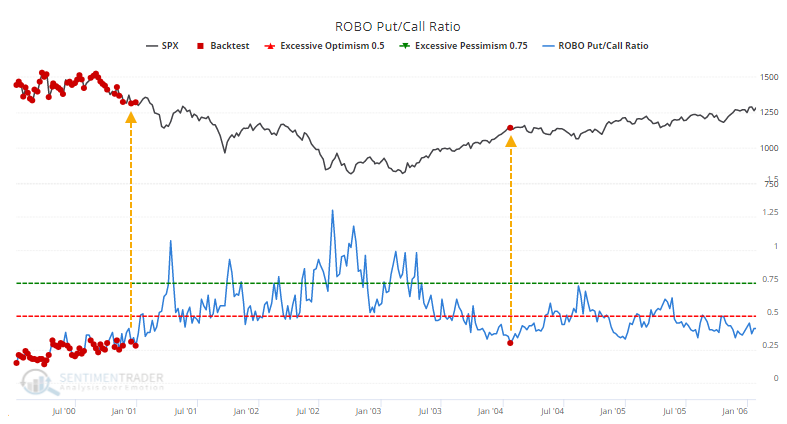
Because traders bought so many calls and were willing to pay up for them, the Small Trader Put/Call Premium ratio plunged to one of the lowest levels on record. The Backtest Engine shows poor returns after similarly low readings.
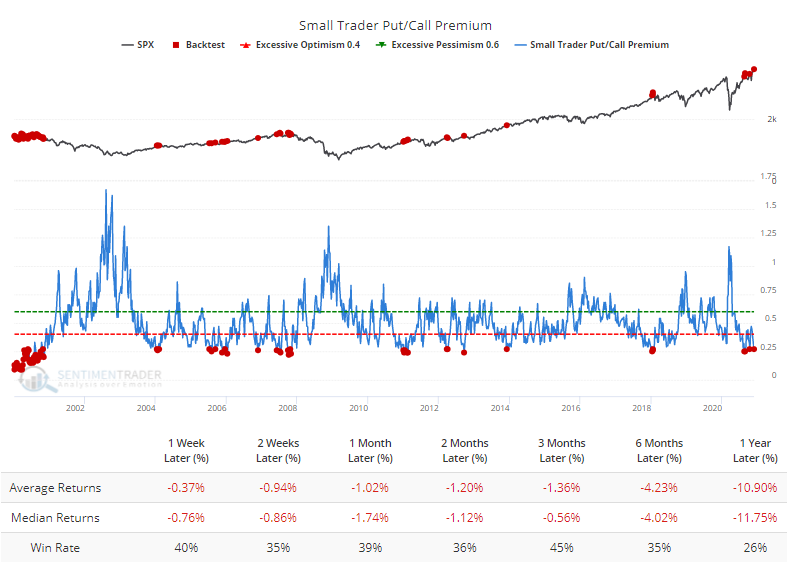
Remarkably, out of 75 weeks that showed this low of a ratio, 74 of them saw a negative return in the S&P 500 at some point in the weeks and months ahead. Only a reading in early January 2011 witnessed the S&P rise uninterrupted going forward, and even that was just barely.
It's not just the smallest of traders feeling their speculative juices, either. The largest of traders, those trading 50 contracts or more, also joined the party.
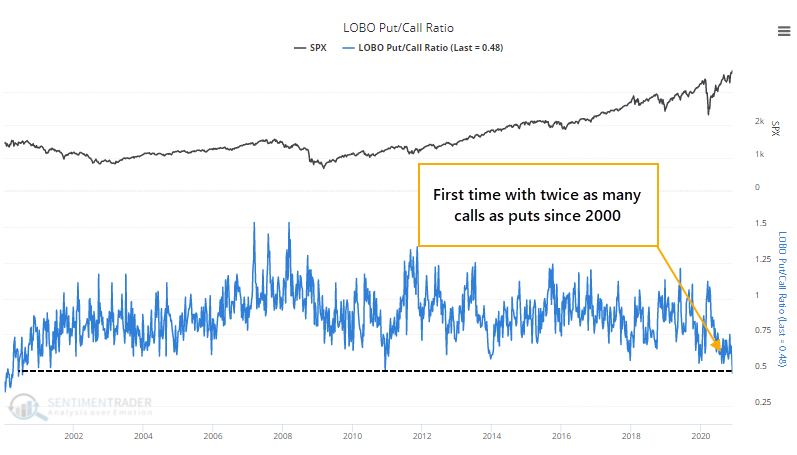
Last week, they bought twice as many call options as put options - the first time since 2000 they've done so.
The most extremes in 15 years
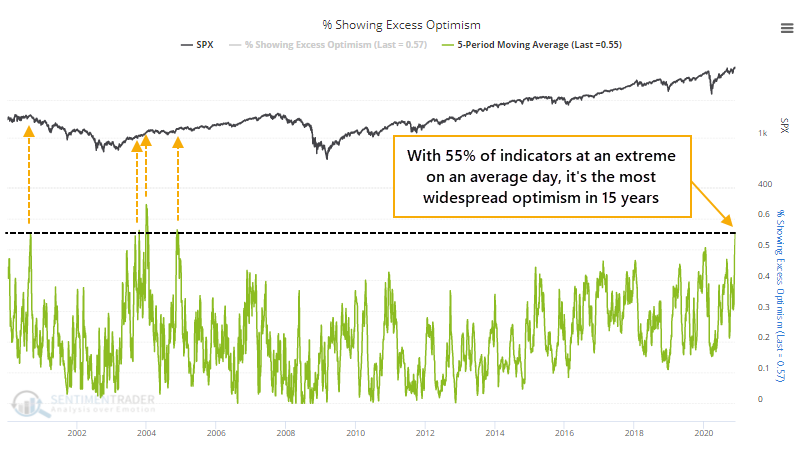
Options activity is but one of the many extremes that our indicators are showing. So many, in fact, that an average of more than 55% of the core indicators have been in extreme territory over the past week, the most in 15 years.
One of them is our proxy for the Fear & Greed model published by CNN. For the first time in months, it's in truly extreme territory.
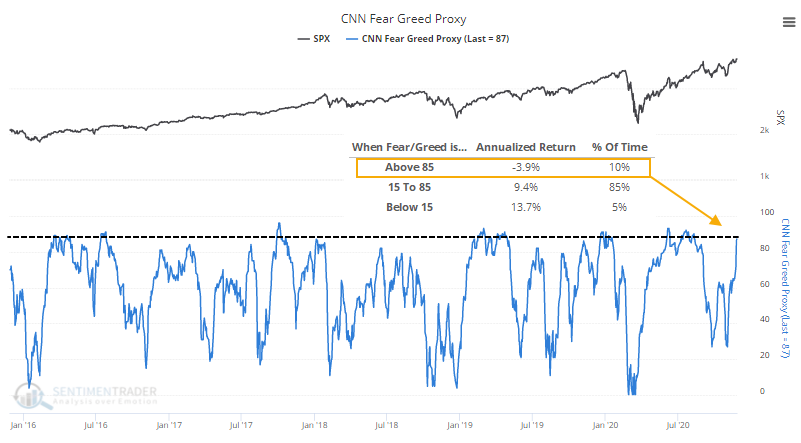
When it's been above 85, the S&P 500 has returned an annualized -3.9%.
Momentum, seasonality, and perky small-caps
Always when we're dealing with extreme sentiment, we also have to consider momentum. When optimism abounds, it is often precipitated by positive momentum, and vice-versa. That's why we spend almost as much time looking at the health and quality of participation under the surface as we do measuring sentiment. Nothing can cause a sentiment extreme to fail quite like momentum.
And we've been seeing very healthy participation and momentum, as outlined multiple times in recent weeks. There has been a series of thrusts and breakouts, with some of the best underlying breadth readings we've seen in years. Decades, even. That was not the case in August.
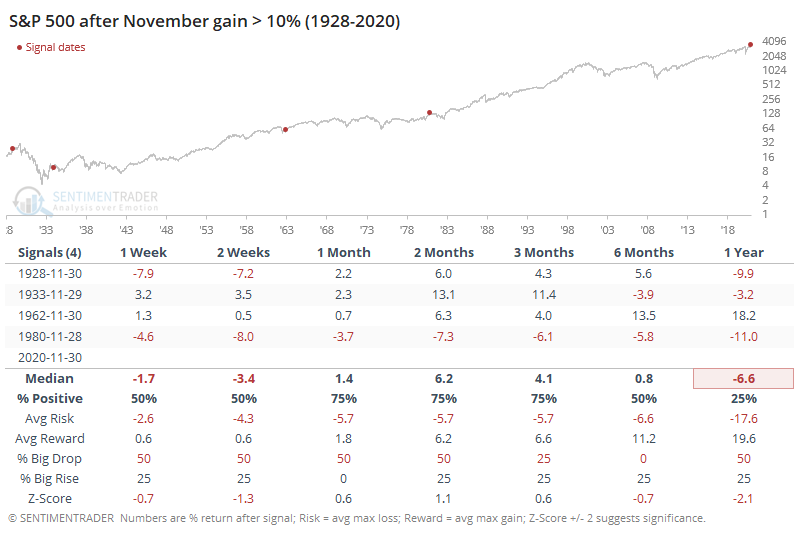
We're also in the midst of what has traditionally been a positive time of year. This will be one of the few times in history when the S&P 500 gained more than 10% during November.
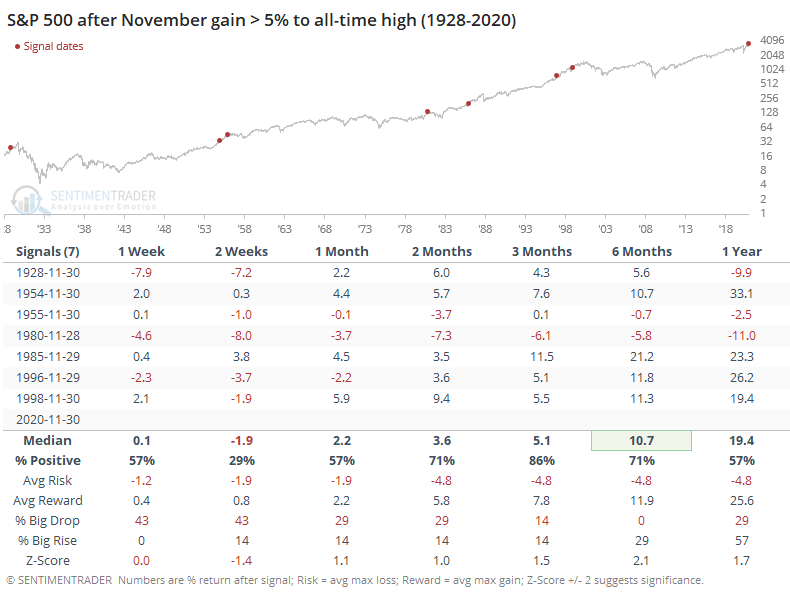
Even 5% gains during this month have been rare, at least when the S&P was trading at a record high monthly close at the time. It didn't prevent losses in the weeks ahead, but they did tend to be relatively contained.
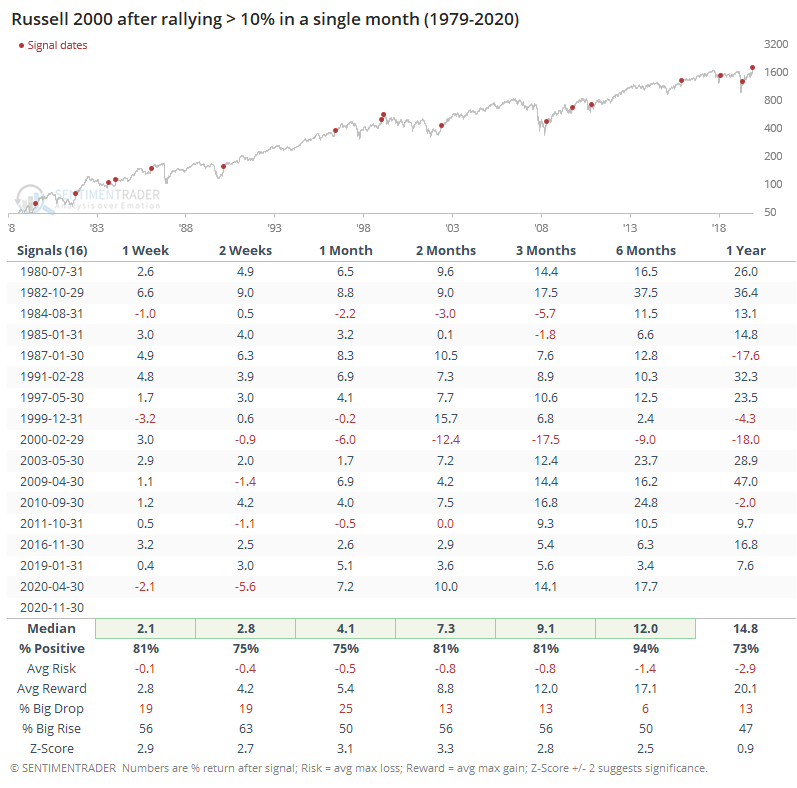
It wasn't just the large-caps in the S&P 500 that have been rallying, of course. The impressive breadth figures throughout much of November reflected broad participation, which means smaller-cap stocks. The Russell 2000 is on track for its best month ever, but even rallies half as large have preceded further gains almost without exception.
In some respects, big months for small-caps have been even more positive for the S&P 500.
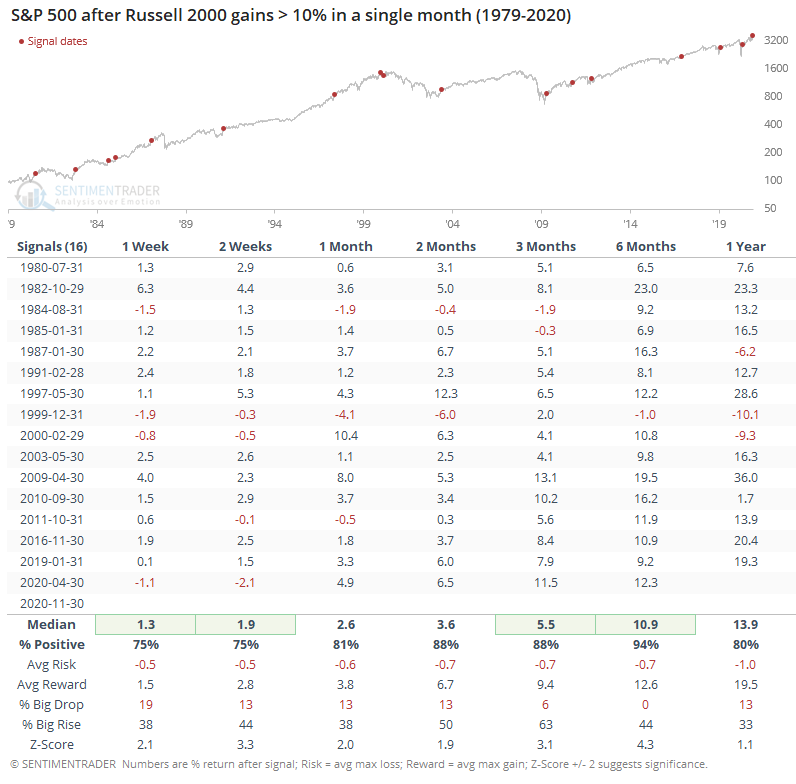
When the Russell jumped 10% or more in a single month, over the next 6 months, the S&P suffered only a single (small) loss, and the risk/reward skew was tilted heavily to the upside, as was the probability of a big rise versus big drop (see here for definitions).
Volatility drip
The consistent rally, coupled with what is usually lower volume and volatility during the holiday season, has caused traders to price in lower daily moves over the next 30 days. The VIX finally closed below 21, which we pointed out on Twitter would end the 3rd-longest streak since 1990.
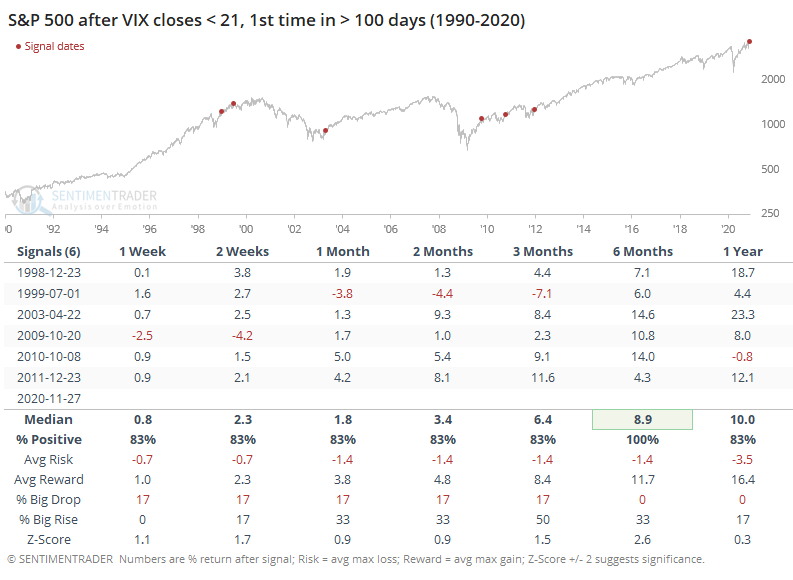
Other times the VIX ended a streak above 21 that lasted more than 100 sessions, the S&P 500 continued to rally over the next 6 months.
Piecing it together
In years past, we used to be able to see a true sentiment extreme and be reasonably confident that it would soon be reflected in forward stock returns. When investors became too pessimistic, then buy; when too optimistic, then sell. In recent years, that has become much less consistent. Sometimes, an extreme will help trigger a counter-move in the market almost immediately, other times it will take months. It's never been 100% reliable, but more and more, prices have continued to move for weeks or even months before reacting.
I don't really care about the reason, since it's all conjecture and nobody really knows anyway. Maybe it's the trend toward passive funds, or Federal Reserve intervention, or a new cadre of investors. Who knows, it is what it is. Considering recent history, it has usually been a mistake to sell just because sentiment is overly optimistic, which it clearly is. A reasonable, and simple, trigger to become more defensive in the face of sentiment like this watching for indexes to fall below their 20-day moving averages. When that happens, following a sentiment extreme, then we've typically entered a much more choppy environment. Given the momentum and breadth we've seen, however, the probability that a move like that will lead to a large and sustained breakdown seems remote for now.