
Wednesday Color - ETF Asset Drop, P/C Ratio, Fidelity Sectors, Warning Signs, Bond Bulls, Debt Contraction, Mexico

Here's what's piquing my interest so far today.
Leaking Assets
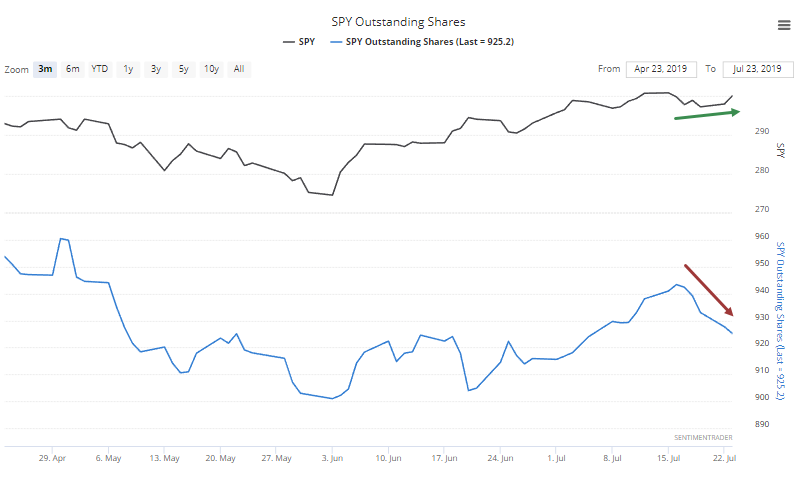
The major indexes (excepting the Russell 2000) have risen toward fresh highs over the past week, but ETF traders don't seem to care. Assets in SPY, DIA, and QQQ have all declined over the past 5 sessions.
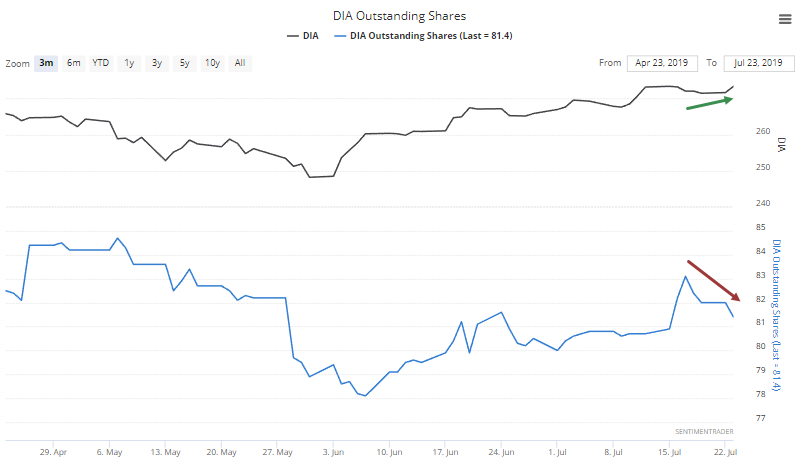
Shares outstanding in all 3 funds have dropped by at least 0.9% over the past week. There is an automatic assumption that this is a good thing, since it shows apathy toward the market. It's not quite that easy.
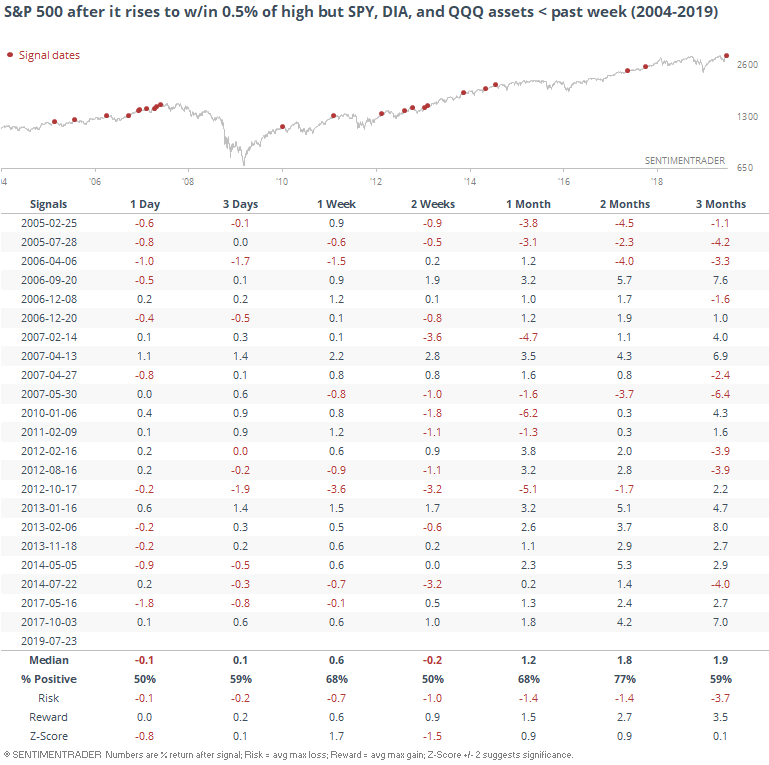
We can see just how mixed the S&P's returns were going forward under similar conditions. ETF traders were pulling shares ahead of several large declines (they're smart money!) and also before several large rallies (they're dumb money!). There wasn't a consistent message in these flows.
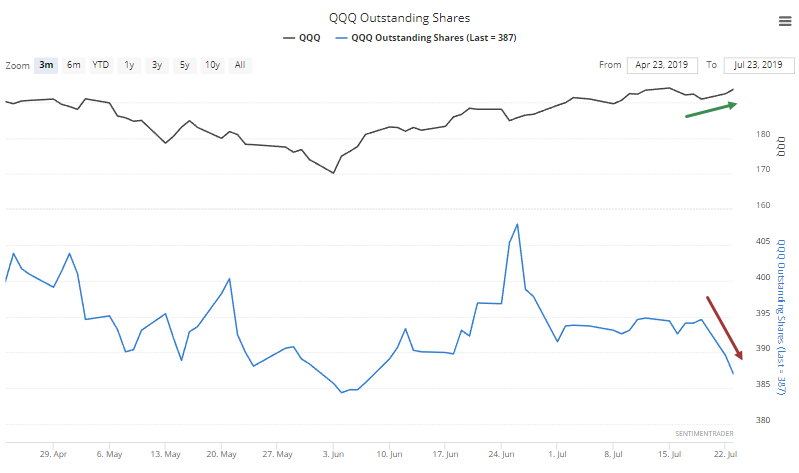
For QQQ, it has been particularly steep. The fund has rallied more than 4% over the past 20 days while shares outstanding have plunged more than 4%, all while it's within spitting distance of a new high.
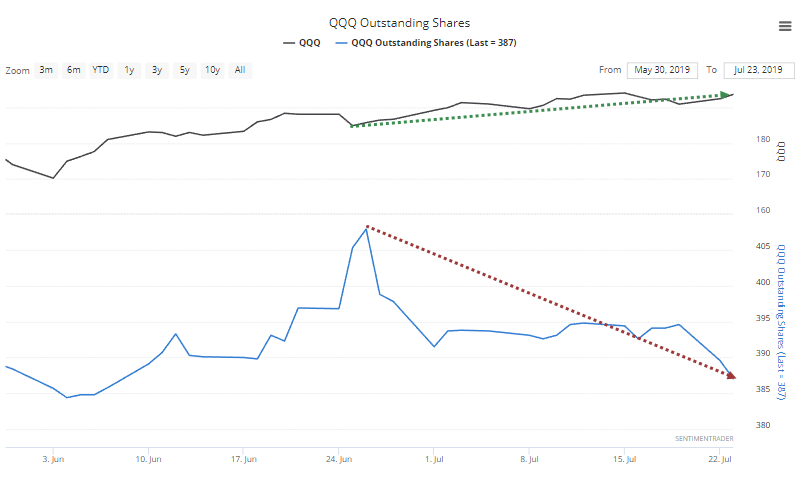
That hasn't necessarily been a good thing.
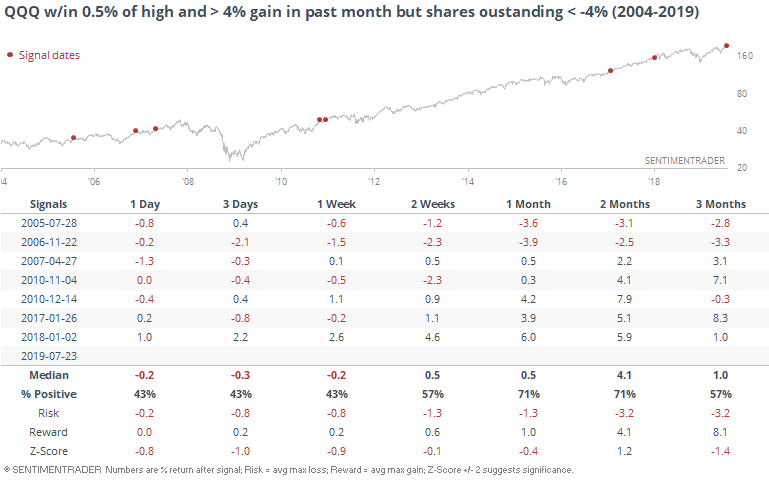
It can be useful at times to watch for extremes in where the ETF winds blow, but testing is important, because at times it is counter-intuitive. Like now, when it's not necessarily a positive that the funds are losing assets even as the indexes rise.
Like, Totally NOT Trading Puts
The Total Put/Call Ratio plunged on Tuesday as put trading dried up, and it moved to one of the lowest levels of the past year. Over the past decade, though it's not that abnormally low. Future returns were a bit weak in the short-term but fine long-term because of the bull market.
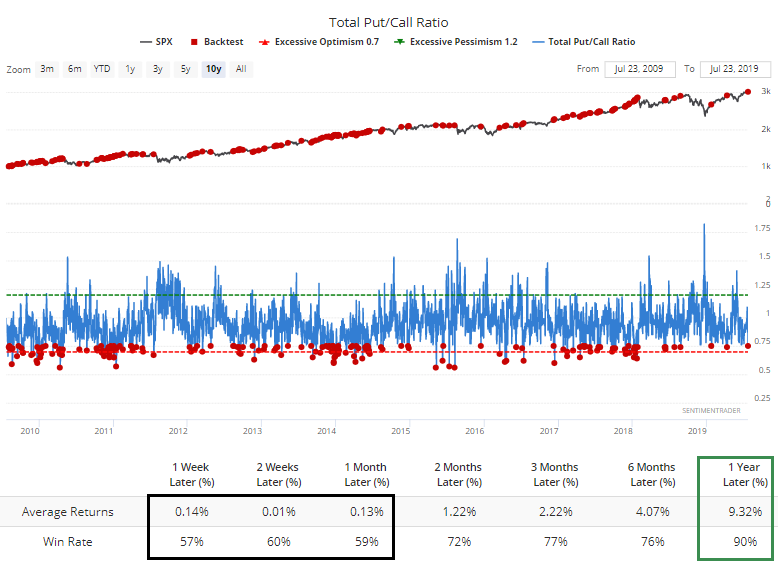
The ratio that looks at trading in equities only didn't drop much, meaning that much of the call volume (and lack of put volume) occurred in indexes. And indeed, the index-only put/call ratio was very low. But that hasn't meant anything consistently. These ratios can be useful, but typically only when they hit an extreme over a sustained period of at least 5-10 days, and right now they're not.
One Of These Things Is Not Like The Others
We've seen several times over the past week or so how there have been more and more signs of a split market. Some stocks are doing well, enough to push the major indexes close to record highs, but under the surface there is more turmoil than usual. Quite a bit more.
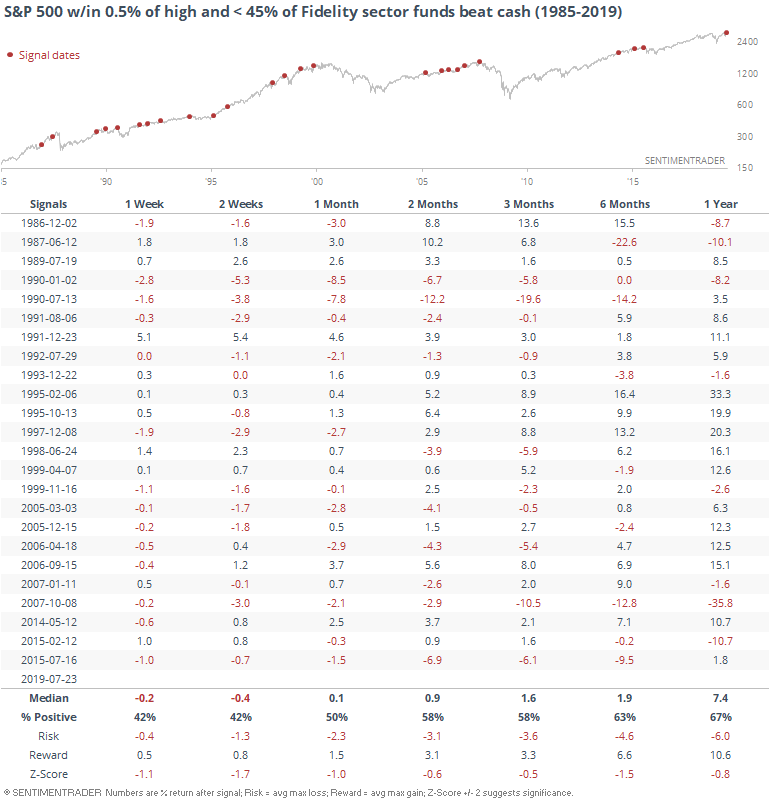
We're seeing that as well in the percentage of sector funds that Fidelity manages that are beating the return on cash. Despite a good market over the past month, fewer sector funds have beat cash, and now fewer than 45% of them are, down from 70% of them a month ago.
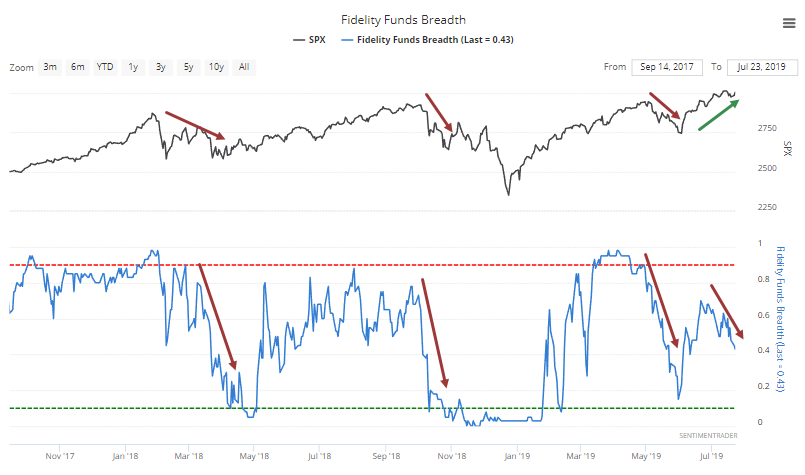
That has led to some short-term weakness and worse-than-random returns across all time frames.
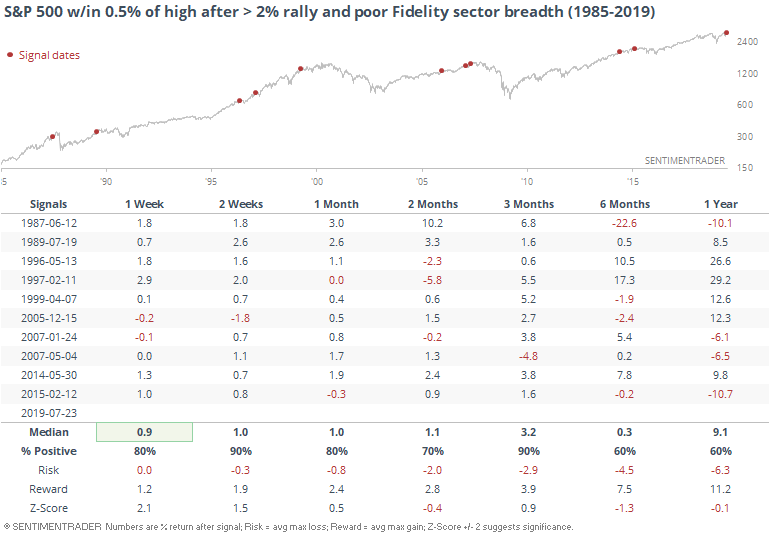
The thing about our current situation, though, is that it's even more extreme. Not only has the S&P rallied to within 0.5% of a high, it has jumped more than 2% over the past 20 days. And not only have few Fidelity funds beat cash, they've increasingly underperformed. When we add those filters, the sample size drops.
Curiously, returns also improve, but with a major caveat.
The numbers are important, and help with objectivity, but there is also use in just looking at a chart and using common sense. When we do that, it's apparent that most of these divergences led to something nasty. The only exception - the only times when the sector funds performed so poorly relative to the market and stocks continued to rise uninterrupted - was in 1996-97.
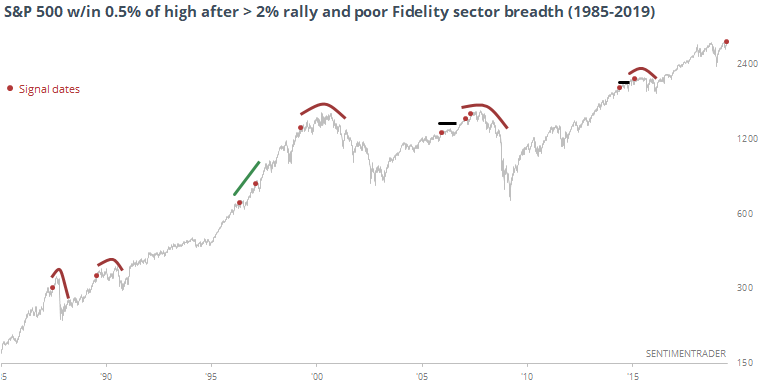
There isn't enough here to consider it an imminent warning, but combined with other signs, it is worrisome.
Flashing Yellow
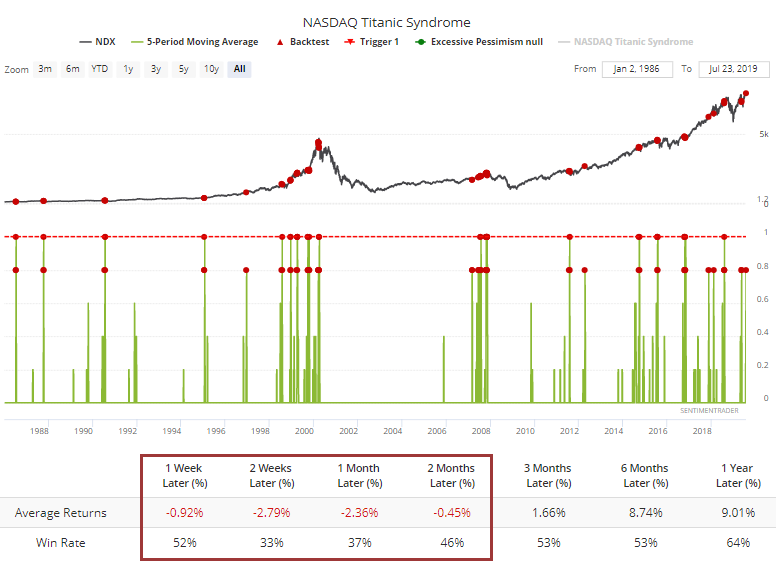
Probably the biggest warning sign we've seen has been the Hindenburg Omen, which has been a consistent bugger for stocks. A related but less stringent warning is the Titanic Syndrome, which simply looks for times when a broad market average hits a fresh high, followed quickly by more securities hitting a 52-week low than 52-week high on the exchange.
That's been happening on the Nasdaq.
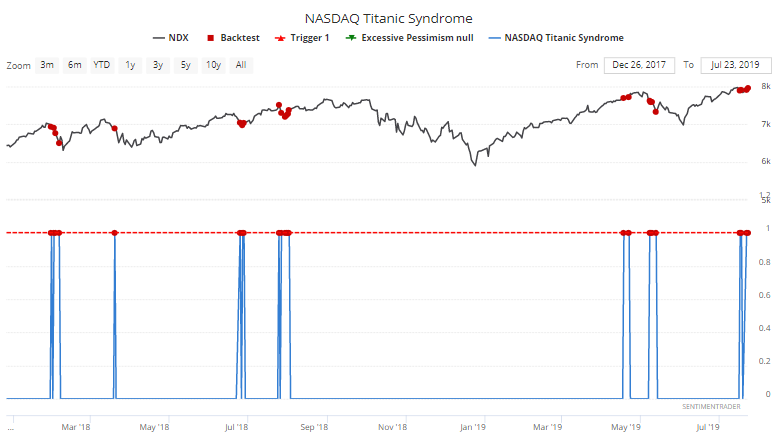
Single-day readings are a warning, and clusters are an outright imminent worry. Over the past 5 sessions, the Titanic has flashed 4 times on the Nasdaq. According to the Backtest Engine, this has led to some pretty weak markets for tech's biggest stocks.
At Least There's Bonds
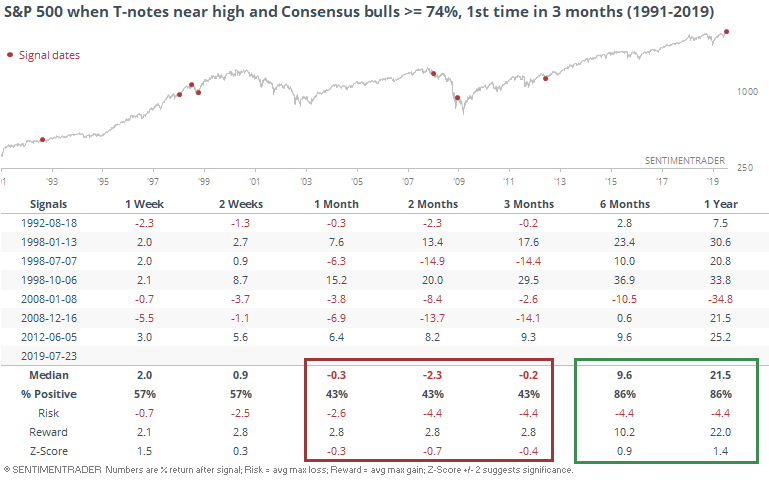
There is not universal opinion that bonds are heading higher (and yields lower) but there are certainly pockets of optimism. As noted by Bianco Research, the Consensus survey of futures traders is showing one of the highest sentiment levels in years.
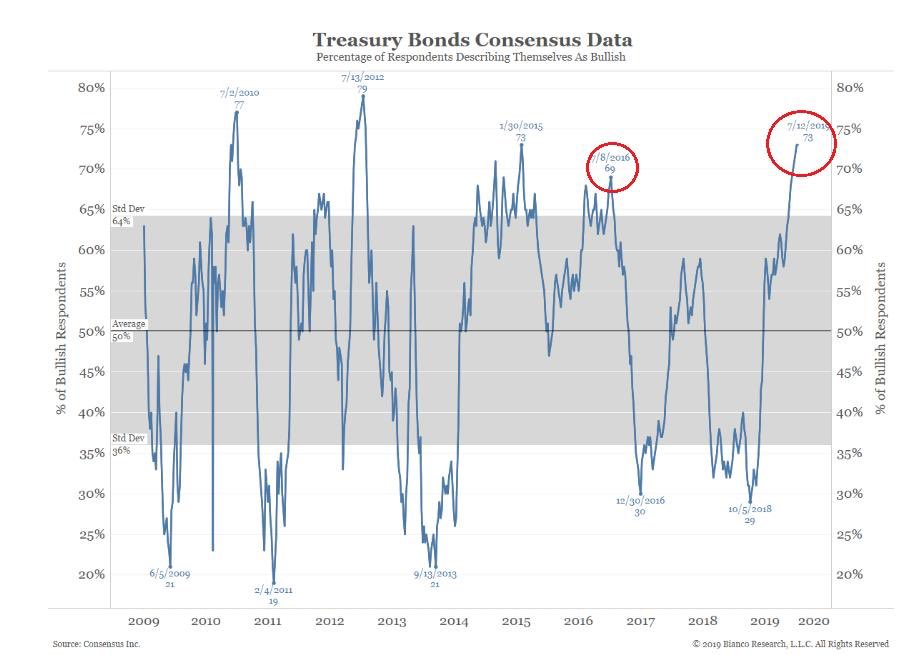
It's been tough for bonds to sustain gains over the short- to medium-term with such extended optimism.
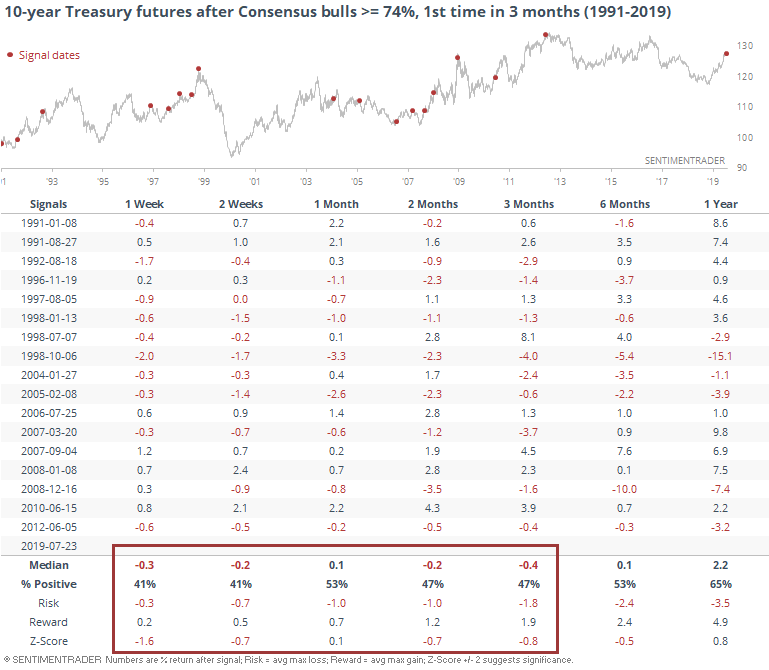
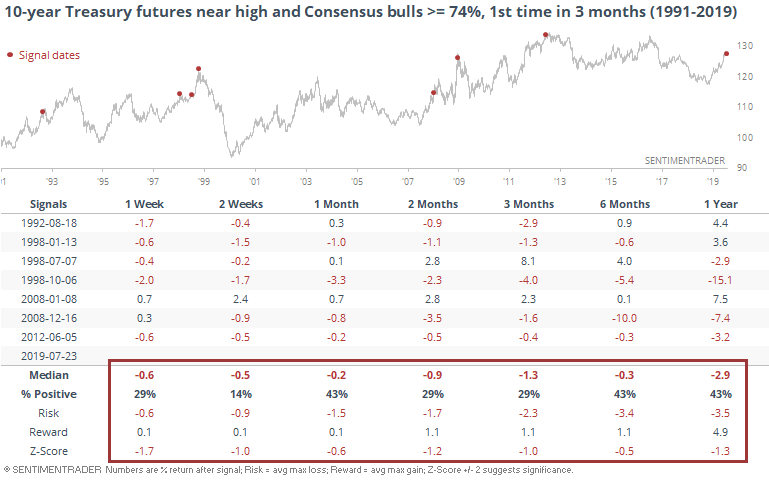
Especially when bonds were trading at or near a multi-year high at the time.
For what it's worth, that wasn't an immediate buy signal for stocks, though the S&P 500 did show good longer-term returns.
Cash, Please
Stocks are rising, but investors don't seem to be willing to borrow against their shares. There is a broad positive correlation between the performance of stocks and the rise and fall in margin debt. Part of that is by definition, part of it is self-reinforcement, and a part of it is purely sentiment related.
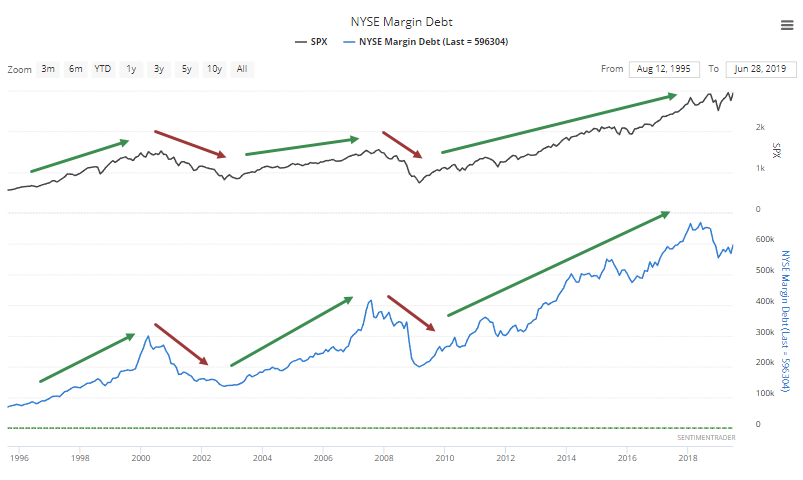
That's what makes the past year so odd. The S&P has rallied nearly double digits while margin debt has declined by almost the opposite amount. The last time this happened was way back in 1991.
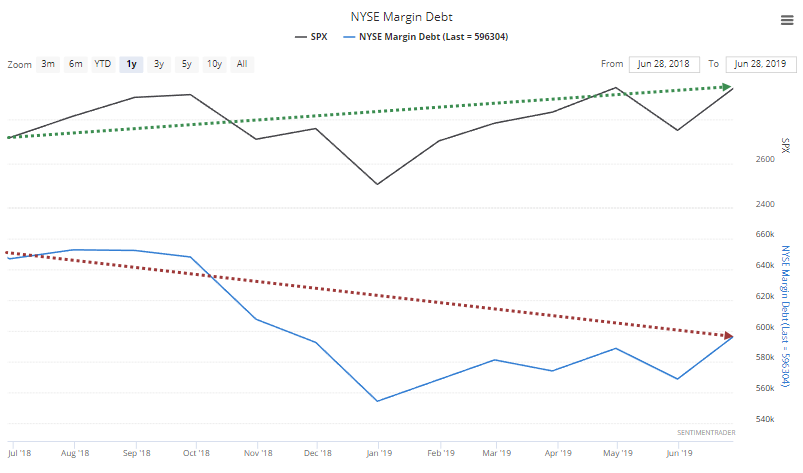
Like the fund flows, there is a tendency to be a knee-jerk contrarian and automatically assume this is a good sign, showing that investors are apathetic. But, again, it's not that easy.
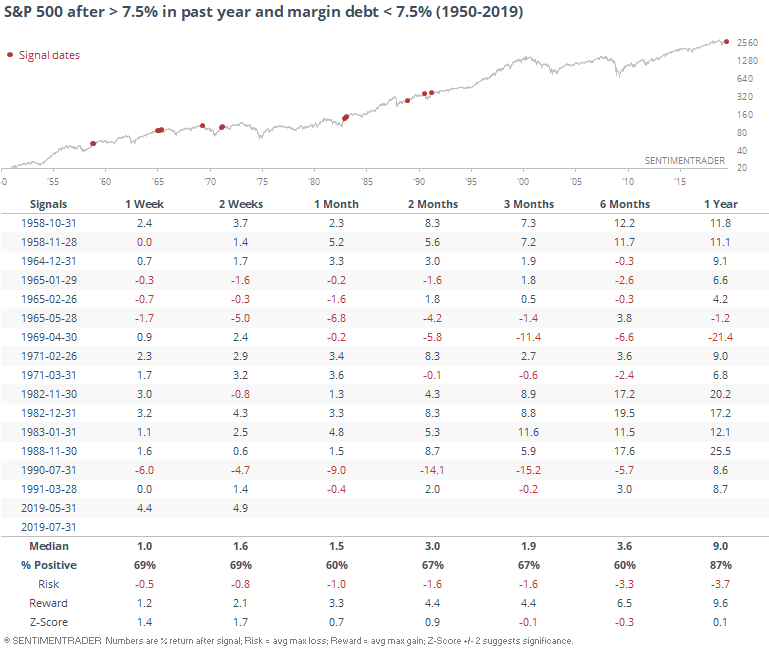
To look at the market's forward returns, we pushed the dates forward by a month, since there is a one-month lag in the data. When we do that, we can see that these displays of apathy were not always a good sign. The S&P 500 suffered major declines following a few of them, and its overall average returns were about in line with random.
The best signals with margin debt tend to be when looking at long-term trends, and big swings over several months. When it diverges from the price action, it hasn't been much of a signal. Don't fall for the easy argument that the lack of growth in debt is necessarily a bullish sign.
Sector Breadth
Among sectors and indexes, it's a tale of two markets (kind of). Every basic material stock is trading above their 50-day moving average, while few Mexican stocks can say the same.
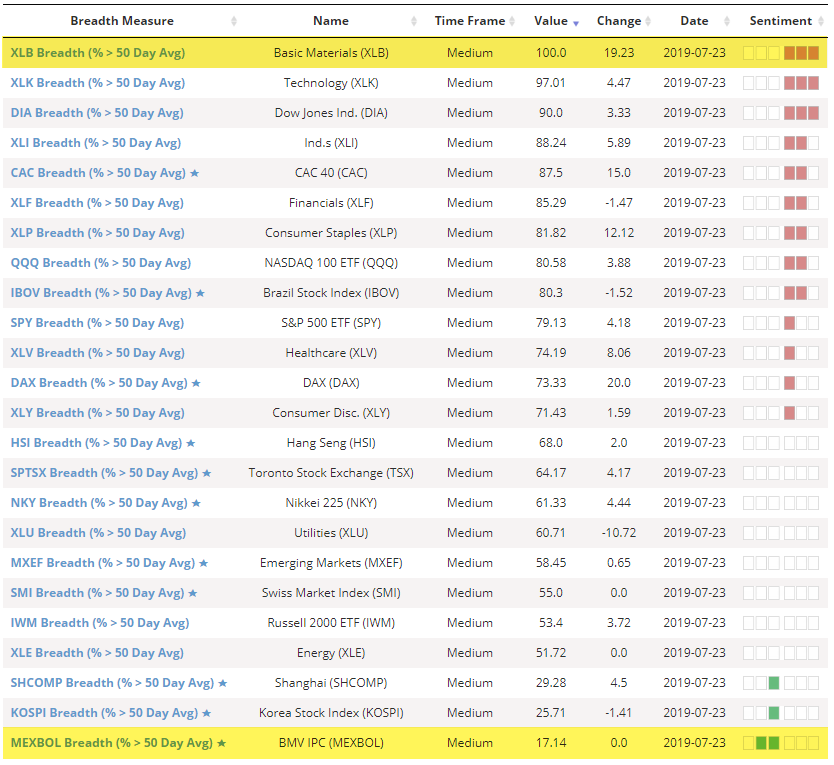
For XLB, there is a touch of "too much, too fast" as the fund typically declined following days when every stock was trading above average.

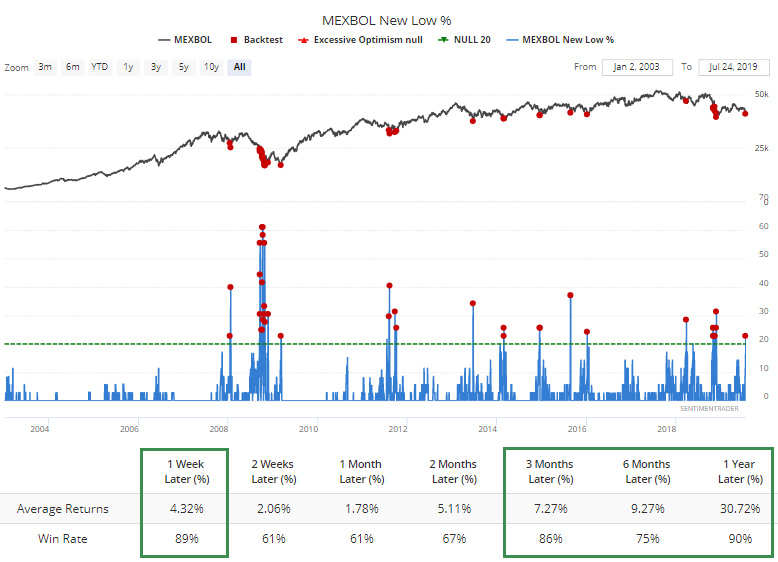
In the Mexbol index of Mexican stocks, we've been watching over the past week for a final plunge that would generate true historic extremes. It's been inching its way there but *not quite* to levels that suggest, "yep, this is probably it."
By Tuesday, nearly 23% of the stocks had sunk to a new 52-week low.
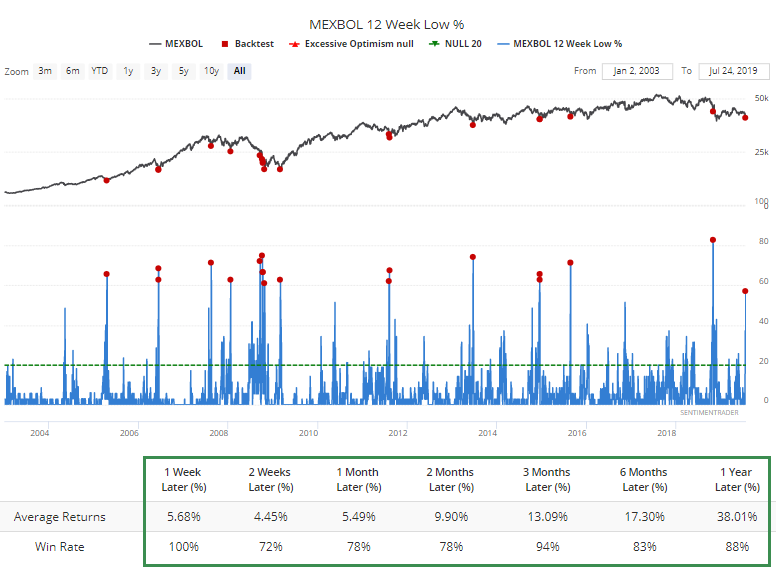
And almost 60% of them have fallen to at least a multi-month low.
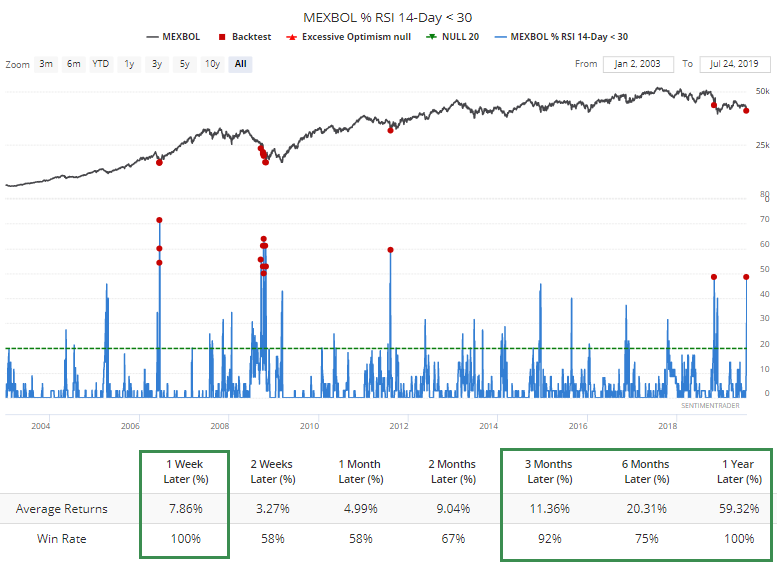
Almost half of them have dropped enough to become oversold. This is compelling.
Almost 60% of them have dropped so sharply that they're trading below their lower Bollinger Band.
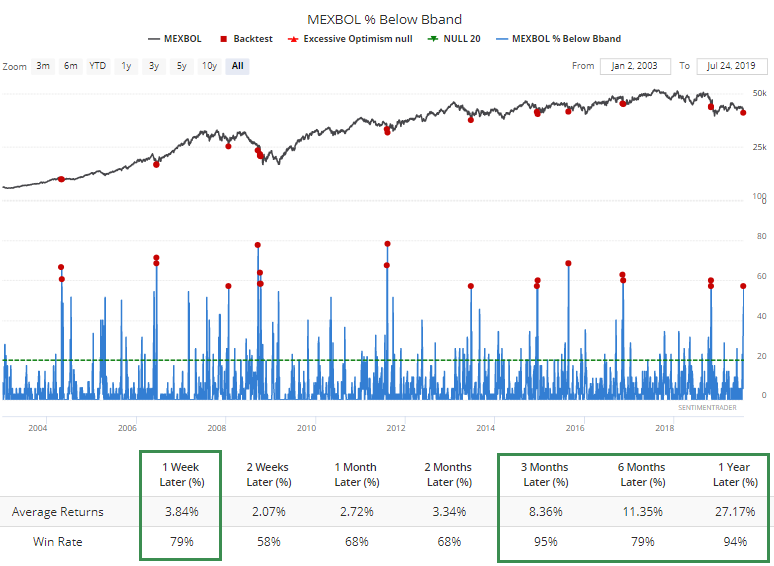
Most of the indicators for that market are *almost* at hard-to-dispute puke-type thresholds. Maybe it's splitting hairs, but when looking at a market in free-fall, it's typically better to be late than early, unless there is a true historic extreme. Whether that's the case right now is arguable, but quickly getting interesting.
NOTE: In the next couple of weeks, we plan on adding similar breadth measures for a few more sectors, including biotech, semiconductors, and gold miners.