Wednesday Color - Stocks Down + Bonds Up, MACD Sell, Energy Lows, Gold RSI

Here's what's piquing my interest as stocks gyrate ahead of what is likely to be an exodus of traders from their screens over the next couple of sessions.
Stocks Down, Bonds Up
August has been a bad month for stocks and wonderful one for bonds, leading to one of the widest divergences between them in years. Heading into the last few sessions of the month, the S&P 500's total return is -3.5% while that for bonds is +2.5%.
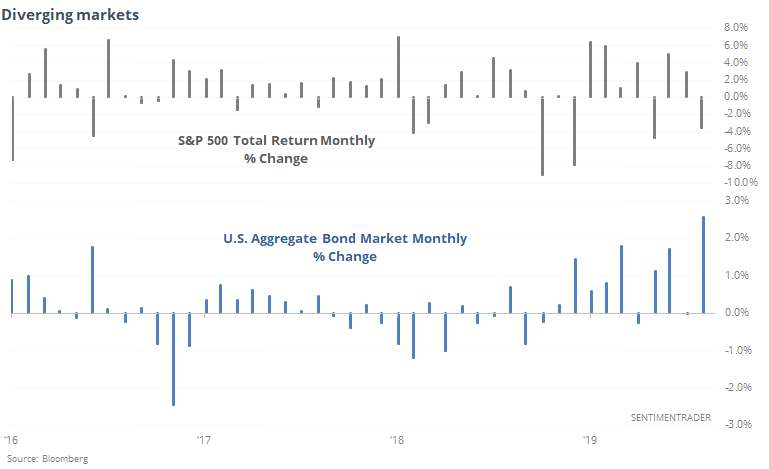
This always sends the rumor mills in motion about pension funds et al needing to rebalance their portfolios before month-end. Theoretically, this should mean that money will flow into stocks and out of bonds so that massive funds' asset allocation mix isn't totally out of whack.
It hasn't really worked out that way. Below, we can see every time since 1990 when the 20-day total return on the S&P was less than -1% but for bonds was more than +1% heading into the last 3 days of the month. We can also see what impact that had on those last few sessions.
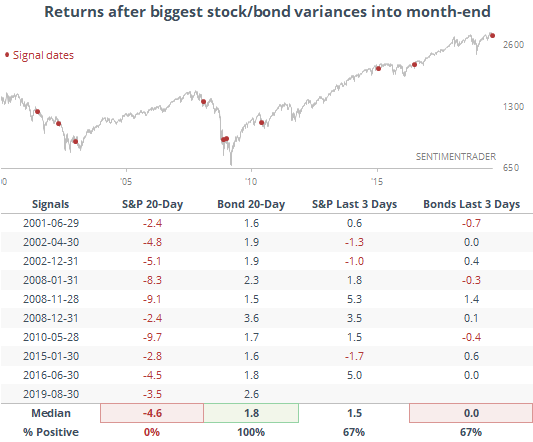
The S&P did rally into month-end 6 of the 9 times, but so did bonds. The S&P's average return of 1.5% was impressive for only a 3-day period, but each of the losses were for more than -1%.
The months with the greatest disparity between the two were both in 2008, which isn't a shocker. In January and December of that year, stocks were down at least -2% and bonds up at least +2% into month-end. The S&P rallied strongly the last 3 sessions of the month both times, for what that's worth.
So, should we expect some mean-reversion due to portfolio rebalancing as we head into September. A case could be made but it's sketchy.
Negative Impulse
MacroCharts points out that a popular technical indicator for stocks has rolled over. This is especially bad because it has already shown a negative impulse, and its upward curl failed to hold. The MACD indicator for the S&P 500 has turned negative again.
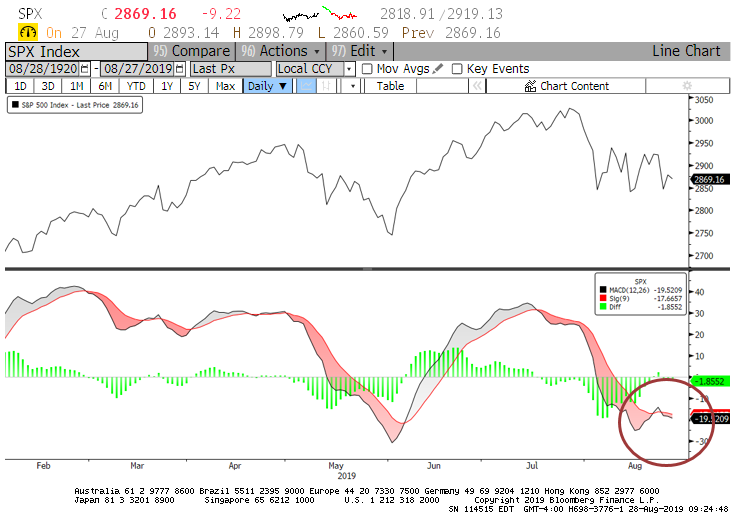
The indicator compares to moving averages to each other, so a negative value means that short-term momentum has fallen below longer-term momentum. After more than a month with negative momentum, it tried to turn positive last week and then failed by Friday.
There is no doubt it's a negative implication in the common interpretation of technical indicators. Historically, it had a mixed record, though.
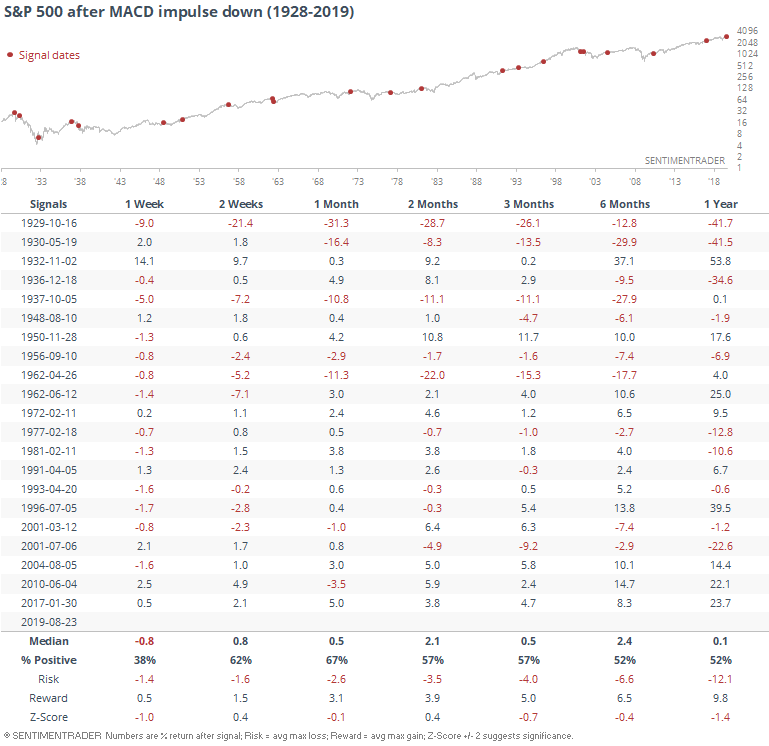
The table shows times the MACD was negative for at least a month, turned positive for at least a day, then turned negative again. During the next week, the S&P did show consistent negative returns, and high risk relative to reward, so that's a warning.
After that, it wasn't terrible, but did generally precede lower-than-average returns, and barely a 50-50 chance of being able to rally.
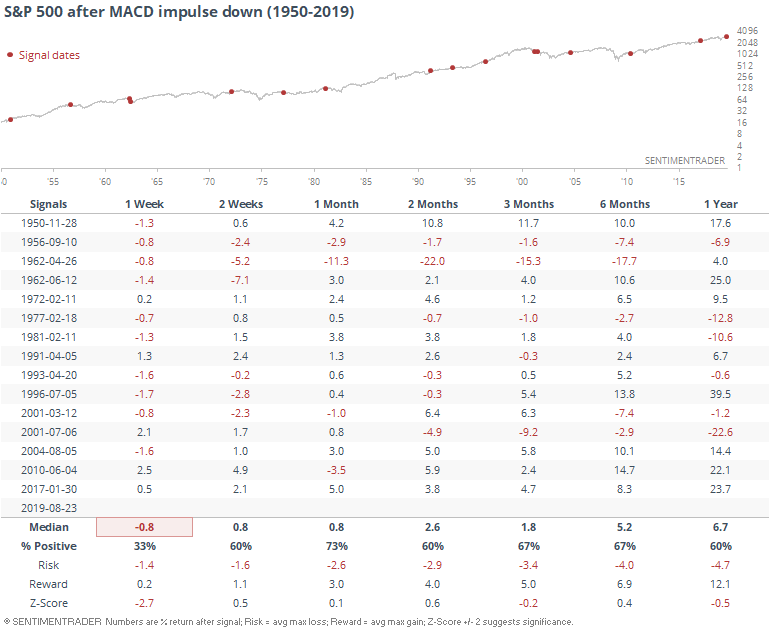
If we focus on modern markets, since 1950, short-term returns actually got worse, but the longer-term risk improved significantly.
Hedging
With the volatility seen in August, there is no shortage of signs that traders are getting nervous. We've gone over a bunch of them over the past couple of weeks - not enough to compare with major lows in recent years, but still high given the relatively minor drop so far in stocks.
ETF traders appear to be taking no chances. They've shoveled money into fund that are supposed to shield them from the volatility. So-called minimum volatility ETFs have seen a surge in assets this month, now rivaling the peaks in February 2016 and December 2018.
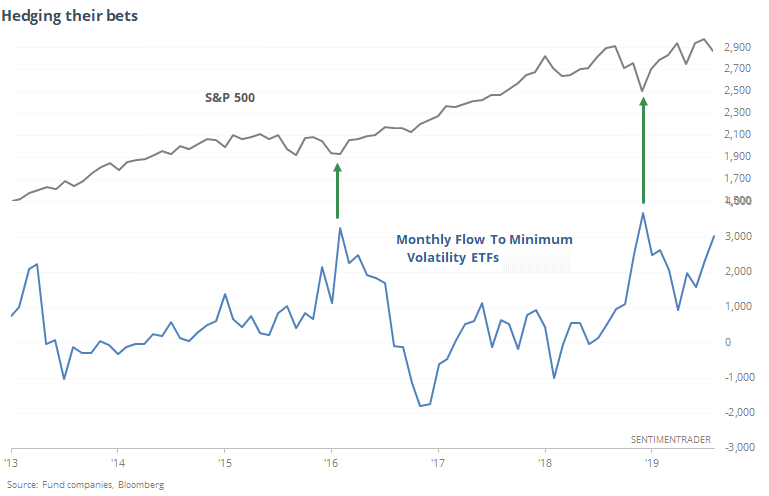
It's notable, but maybe not sufficient to overcome the lack of any sustained upside momentum whatsoever.
Sectors
Energy stocks can't generate any buying interest, and the lackluster performance has caused every one of them to trade below their medium-term 50-day moving averages for only the 3rd time in 3 years (last October and December were the others).
It hasn't been a reliable sign that the selling pressure is overdone, though.
There was an uptick in the number of energy stocks that hit a fresh 52-week low yesterday, but fewer than did so a couple of weeks ago. Maybe that's a positive divergence, but that's an iffy theory.
Most of the sustained lows over the years have come after more than 60% of the stocks hit a new low at the same time. If that's the case, we haven't yet seen the capitulation stage of this decline.
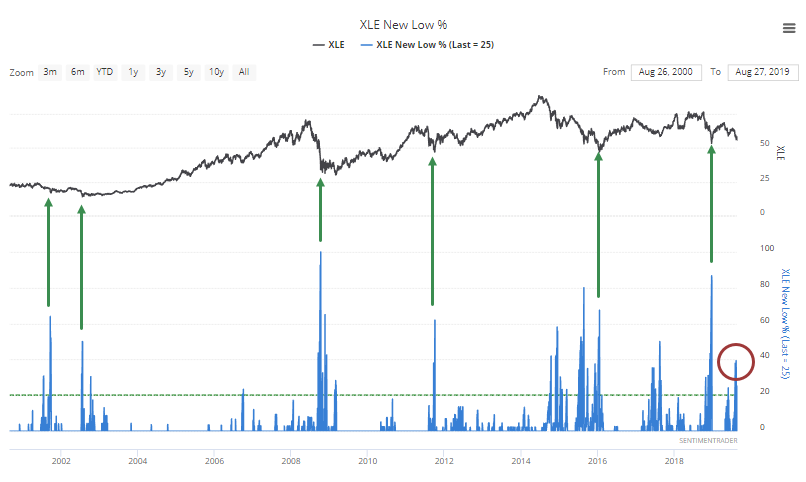
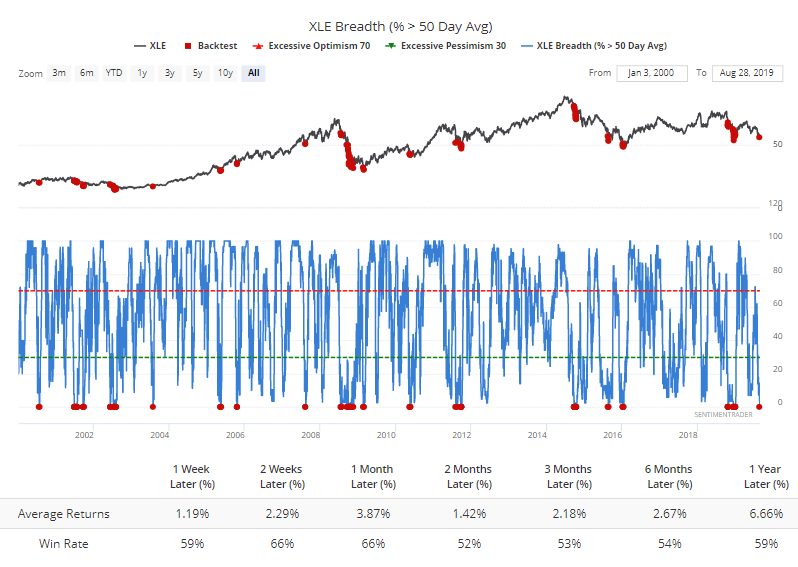
It should be getting close, though. Over the past month, an average day has seen nearly 15% of the stocks sitting at a 52-week low. That's creeping up on some of the most sustained bouts of selling pressure in almost 20 years.
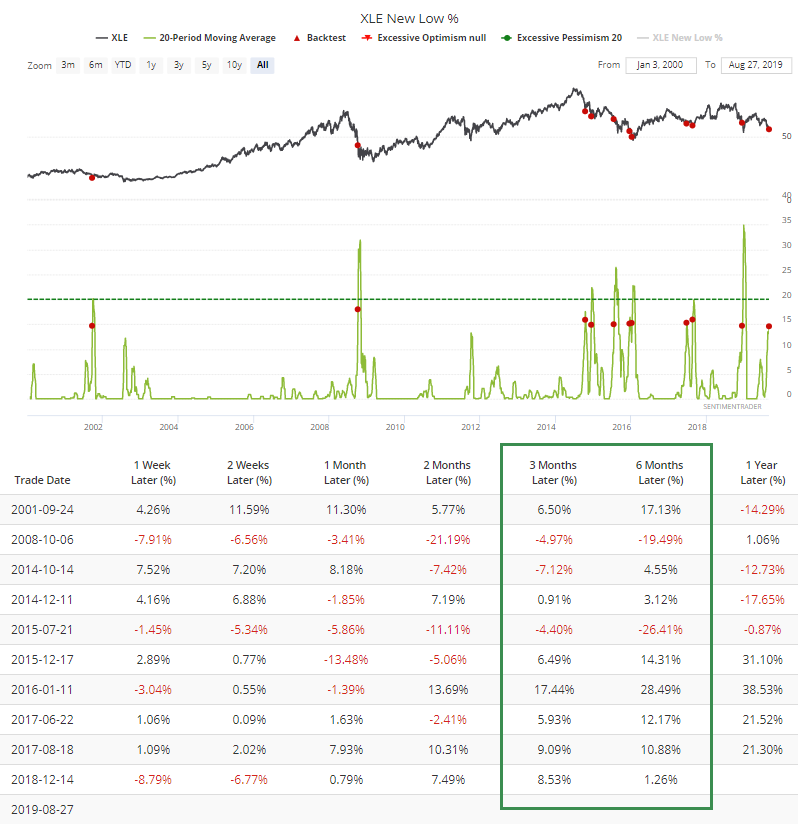
The other times this happened, XLE saw gains all but twice over the next six months, though those two losers were very large.
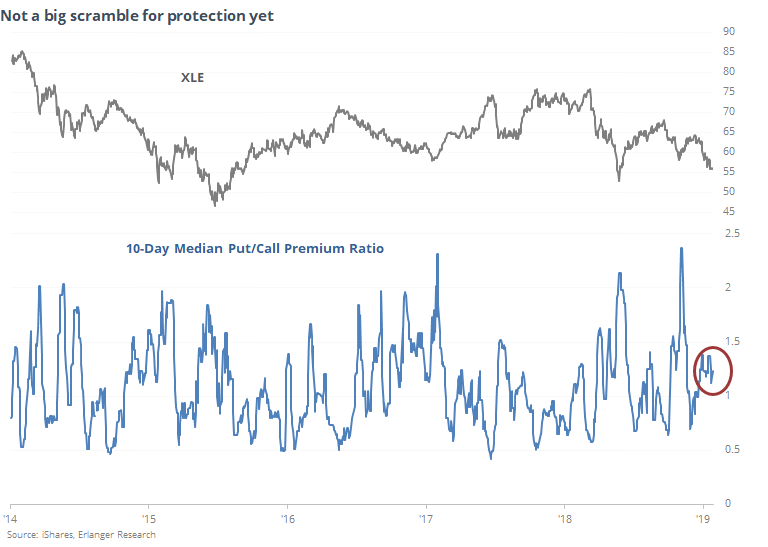
Shorter-term, most of the tradeable lows in recent years have come when premiums on put options were at least twice as large as those for calls on the XLE fund. That hasn't happened yet, suggesting that options traders aren't panicked.
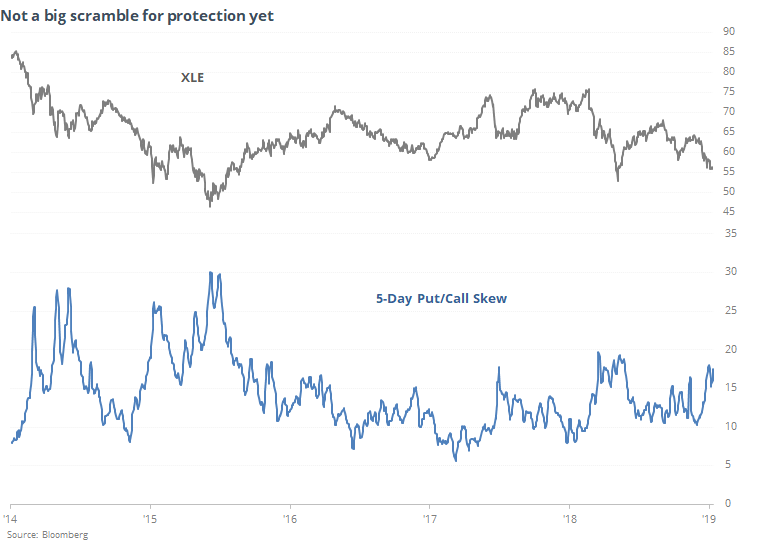
We can see that in the skew between puts and calls as well. It's high, but not extreme.
Golden
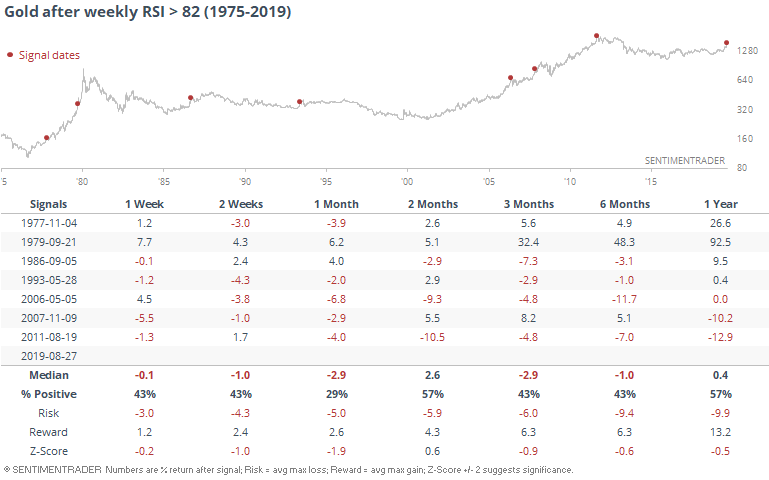
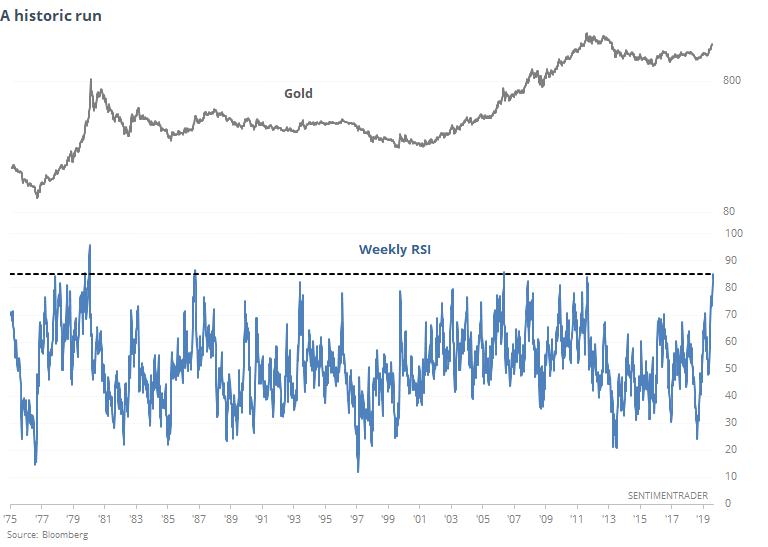
Troy pointed out how silver's run has typically been exhaustive by the time it reaches this level. CNBC notes that gold is throwing off some similar signs, with the weekly Relative Strength Index (RSI) notching one of its highest readings in history. It would have to hold around these levels for it to trigger by the end of the week, so if it backs off, the RSI will come down before it officially triggers.
If it does hold at this high of a reading, it has not been able to sustain its gains after the few other times it climbed this high.
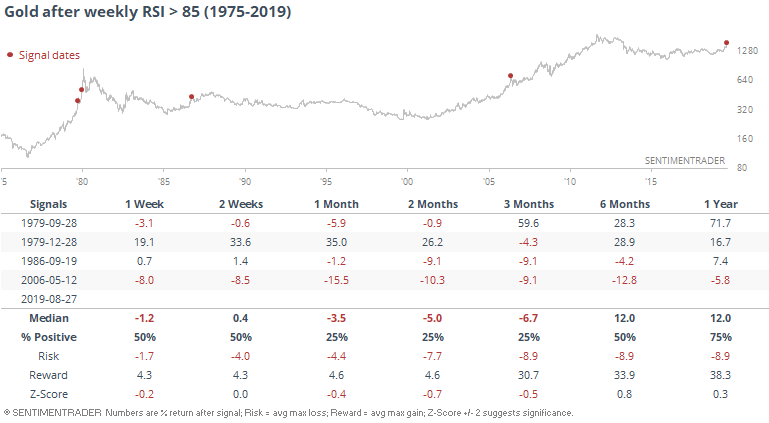
With a slightly lesser extreme, the sample size about doubled, but with the same outcomes. Only the signal in September 1979 managed to see sustained gains going forward.