
TradingEdge for Apr 1 - More signs of surging buying interest, potential trouble for the dollar

Key points:
- Buyers have triggered a breadth thrust in S&P 500 stocks over the past 10 days
- That has also triggered a thrust in the S&P's McClellan Oscillator with a nearly perfect record
- One missing piece is a significant thrust in new 52-week highs minus lows
- Rising gas prices have caused a split in consumer sentiment surveys
- Health Care is emerging from pessimism, during a seasonally positive time of year, with a dearth of insider selling
- Homebuilder trends aren't looking great
- The U.S. dollar is facing seasonal and sentiment headwinds while the yen is showing the opposite
- Bitcoin fear has morphed into greed
More thrust signals for stocks
Dean noted that a new signal from his composite thrust model registered an alert on Monday.
The breadth thrust system identifies when the 10-day sum of S&P 500 advancing issues exceeds the 10-day sum of S&P 500 declining issues by 2.02 to 1. He uses a reset condition to screen out repeats.
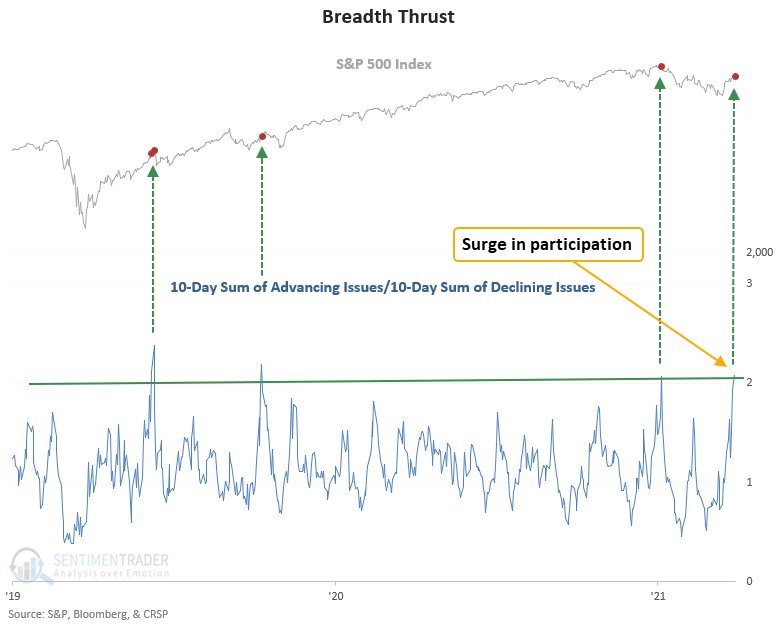
This signal has been triggered 57 other times over the past 90 years. Since 1942, the win rate in the 12-month time frame has been excellent, with 44 out of 48 winners. And the max drawdown was minimal, with a decline of 6.4%.
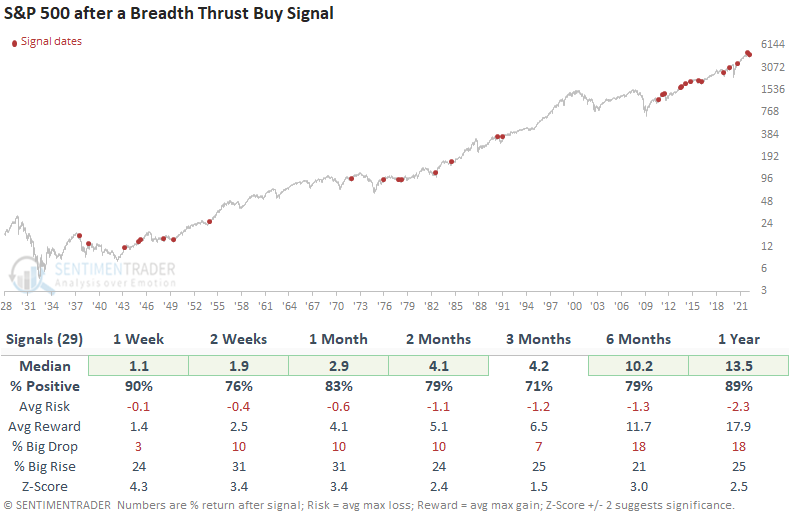
If we strip out the bear market and new high signals, the breadth thrust triggered 29 other times over the past 85 years during a correction. After the others, future returns, win rates, and risk/reward profiles were excellent across all time frames.
And more...
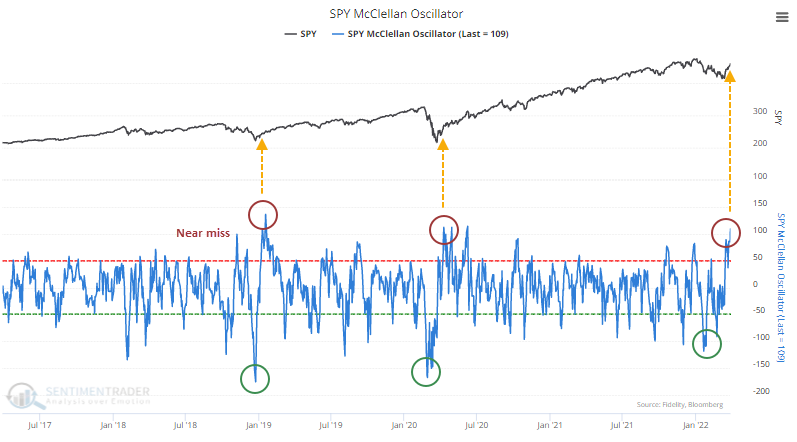
Momentum underlying the S&P 500 in surging, with the McClellan Oscillator for the S&P cycling from below -100 to above +100. The Oscillator is a spread between two exponential moving averages of the difference between daily advancing and declining stocks.
This is only the 3rd time the indicator has made such an extreme round trip over the past 5 years. The other two coincided with major bottoms.
Going back to 1950, there have been 22 similar signals, times when the Oscillator underwent an extreme cycle within 50 days. After the others, the S&P 500 had an almost unblemished record of gains during the following year, with 21 wins out of 22 signals.
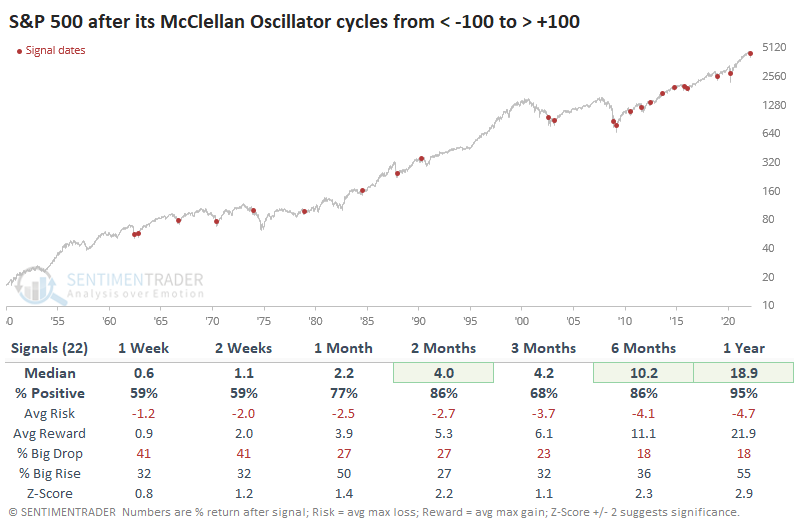
This cycle in momentum was an abject failure in 1974, and triggered right before a recession-worry decline in 1990. It also preceded some losses in 2002 and 2008, but those were during the final panic phases of protracted bear markets. Other than those, the risk of a substantial pullback of even -5% was remote at any point within the next several months.
Because of the surge in the Oscillator, the McClellan Summation Index for the S&P 500 has also recovered.
One missing piece - a surge in net new highs
One of the critical factors for a healthy market environment and improving sentiment in any sector or index is that the number of issues hitting a 52-week high should outnumber those falling to a 52-week low.
It has been a struggle to see that on the NYSE or Nasdaq exchanges. It's been even more of a struggle to see any kind of thrust. The NYSE Net High-Low % has been below 10% for more than 200 days. Since last May, there haven't been 10% more securities hitting 52-week highs than falling to 52-week lows.
A run of 200 sessions since the last surge above +10%is the longest since 2018 and ranks among the 20 longest streaks over the past 60 years.
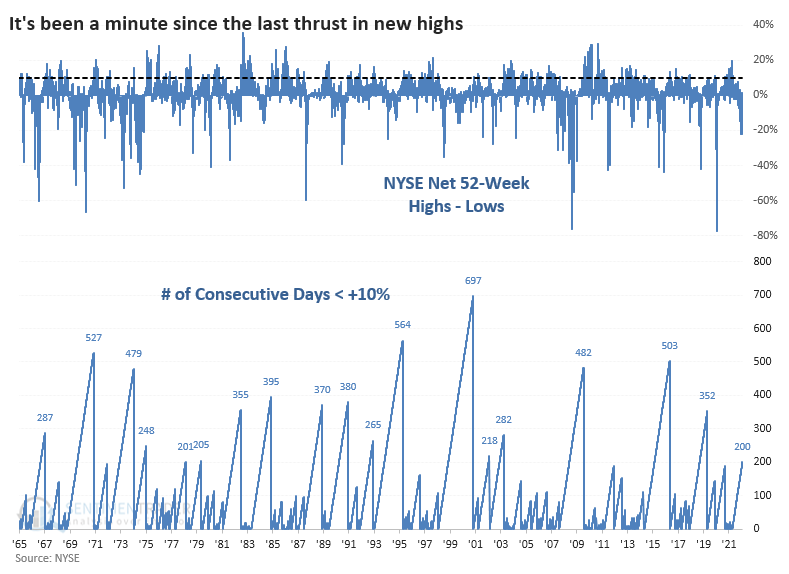
Long streaks without a net new high thrust tended to lead to mediocre returns, and it can be a worry since this is a hallmark of bear markets. For the Nasdaq exchange, it's been even more egregious. It's now been more than 200 sessions since the last surge above even +5%.
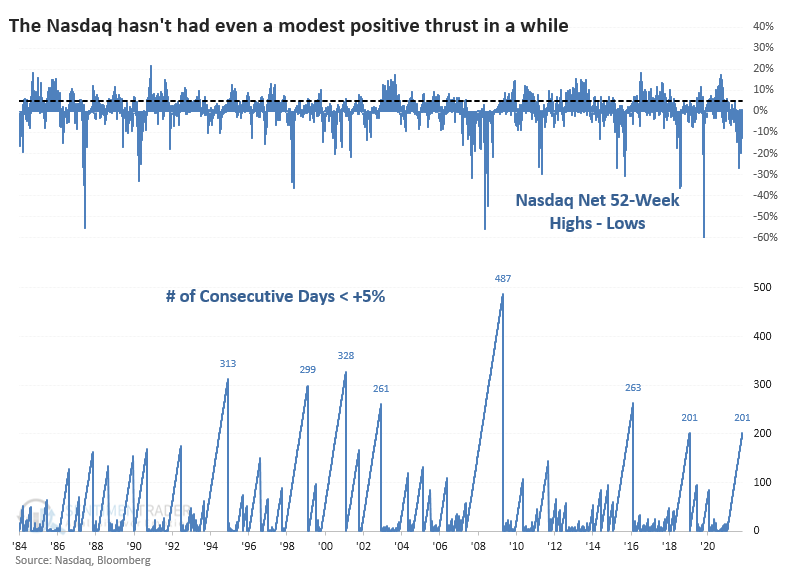
That's been much rarer, with only 7 other streaks this long in the past 40 years. This preceded even more of a binary outcome - either it preceded double-digit gains a year later or double-digit losses (in 2000 and 2008).
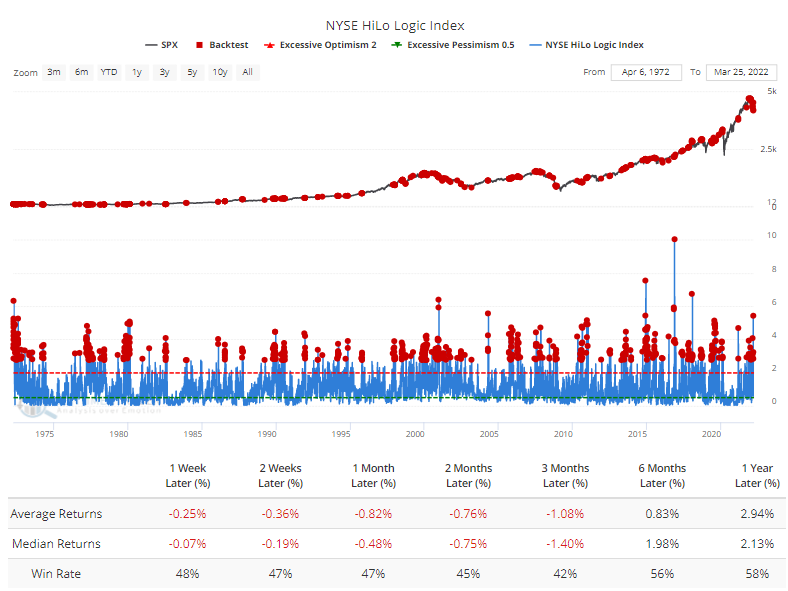
The battle between 52-week highs and lows hasn't led to a powerful thrust in either direction. But both the number of new highs and new lows has been relatively high, at more than 2.5% of all issues traded on the NYSE.
This split behavior means that the HiLo Logic Index is high. Bulls should want to see a very low level in this indicator. That means that either there has been an overwhelming surge in 52-week lows (which tends to be a bullish contrary indicator) or an overwhelming surge in 52-week highs (which tends to be a bullish sign of positive momentum).
The Backtest Engine shows that after any day with a reading above 2.75, the S&P's returns were poor up to 3 months later.
The behavior we've looked at over the past few weeks has been pretty clear that the risk/reward for stocks appeared to favor the upside over a time frame of several weeks to months. Strong follow-through last week was another good sign, and we haven't seen too much that argues against it. We need to be watchful for signs that this could be just a temporary rally within an unhealthy environment. What would change that probability is a sustained and more impressive surge among a broader array of securities - not just stocks but also high-yield bonds. So far, that's been lacking.
A split in consumer sentiment
The latest monthly surveys of consumer sentiment are out, and they're...not good. The Consumer Sentiment survey from the University of Michigan was particularly despondent, with the 11th-lowest reading since 1978. Other surveys aren't quite so drastic, including the Conference Board survey of Consumer Confidence.
The two surveys have some differences, most notably among the questions they ask. It typically boils down to gasoline - consumers in the U. of Michigan survey tend to be more influenced by high gas prices.
The spread between sentiment in the surveys just hit a record low. That (roughly) suggests that consumers have never been more pessimistic about their personal situation relative to the broader economy.
Among sectors and factors, the defensive Utilities and Health Care sectors showed the best annualized returns after extremely negative readings, while Industrials and Financials were among the worst performers.
Another good performer was commodities. The Bloomberg Commodity Index averaged +4.7% annualized following very low readings, while it sported a negative return when the spread was high.
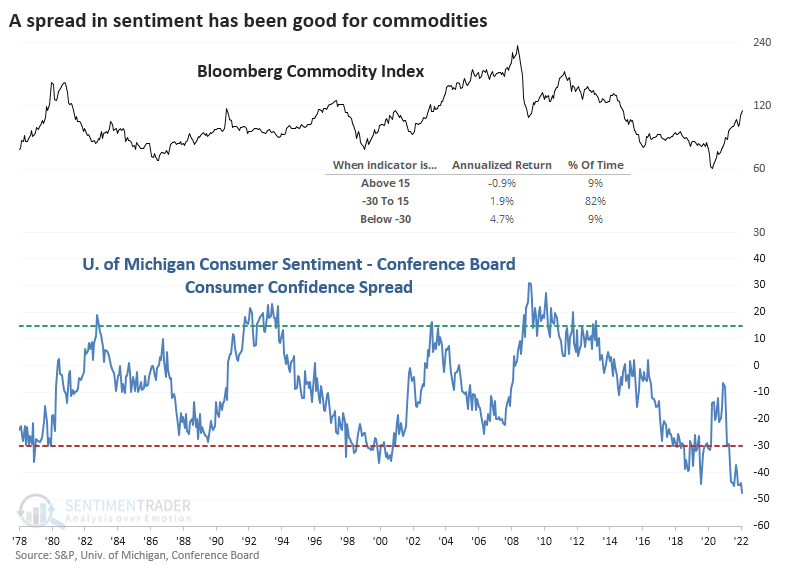
Oil is a big part of most commodity indexes, and it held up pretty well after extreme negative spreads.
Positive signs for Health Care
Jay showed that seasonality and sentiment are pointing higher for Health Care.
A favorable seasonal period extends from Trading Day of the Year (TDY) #56 through TDY #80. For 2022, this period extends from 3/23 through 4/27. We will use a health care sector daily data series for our next test that goes back to 1954.
The chart below displays the growth of $1 invested in the health care sector data series described above ONLY during this favorable period.
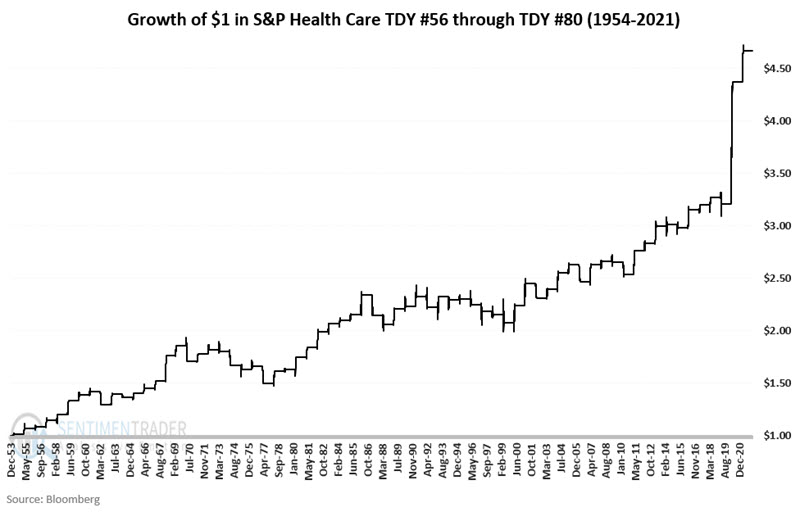
The sector rallied during this stretch during 47 out of 68 years, with a larger average and maximum gain during the winning years than average and maximum loss during the losing ones.
Using month-end closing price data, the chart below displays the growth of $1 invested in our health care sector data series ONLY during March through August every year starting in 1927.
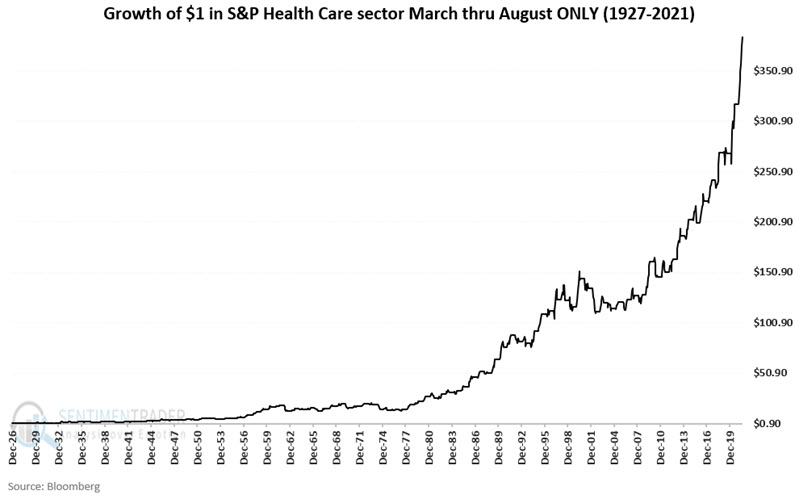
This window showed a gain in 68 out of 95 years, with the median gain more than twice as large as the median loss.
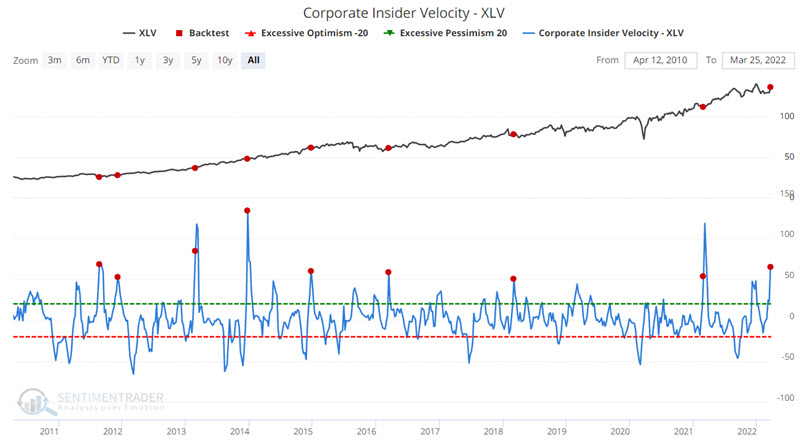
Jay also looked at the buying and selling of their stock by corporate insiders (executives and directors) of companies held by XLV. Selling pressure has dried up, with the fewest sales in more than 5 years.
The drying up of selling has dramatically affected the Corporate Insiders Velocity - XLV indicator. This indicator takes a 4-week rate of change for insider buys and subtracts a 4-week rate of change for insider sales. The more positive the difference, the more favorable the view among insiders, and the more positive the outlook for stocks in the sector.
The chart below highlights those times when the Buy/Sell Velocity for XLV crossed above 50. You can run this test in our Backtest Engine.
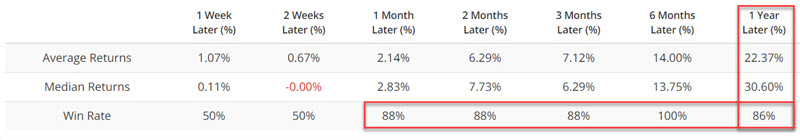
The results for the insider buying indicators look pretty favorable. Please note that our corporate insider buying and selling database only goes back to 2010. The 2010-2022 period has been biased to the upside for stocks, so results should be viewed in that context.
What's not looking great? Homebuilders
Conventional wisdom suggests that rising interest rates are bad for homebuilders, as higher mortgage rates reduce buying demand - and vice versa. Jay looked at returns in homebuilding stocks when their price trend was favorable vs. unfavorable and the trend in interest rates was favorable vs. unfavorable.
The chart below displays the hypothetical growth of $1 invested in our Homebuilders Index only when BOTH of the indicators closed the previous month with an unfavorable reading (i.e., Price < 7-month EMA AND interest rates ($TNX) > 7-month EMA).
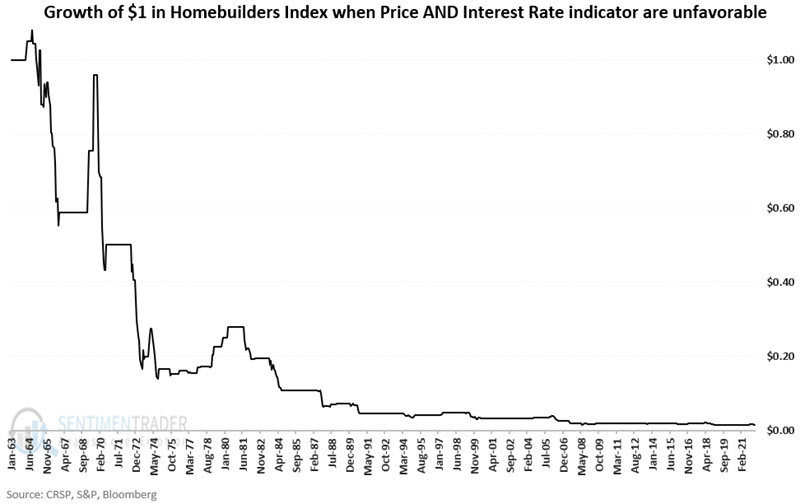
Holding homebuilders when both of the indicators detailed above are unfavorable would have resulted in a staggering loss of -98.7% heading into late March 2022. There have been periods when homebuilders rallied sharply under these circumstances - notably in 1969 and 1979-1980. But since 1980 the devastation has been fairly relentless when both indicators are deemed unfavorable for homebuilders.
Using the indicators above, let's look at the performance of XHB (SPDR S&P Homebuilders ETF) during favorable and unfavorable periods since this ETF started trading in 2006. This ETF holds a portfolio of homebuilder and homebuilding-related stocks and enjoys a correlation of roughly 94% with our homebuilder's index.
XHB gained +264% while either indicator was favorable and lost -55% while both indicators were unfavorable heading into late March 2022.
Dollar headwinds
Jay looked at seasonality and sentiment in the U.S. dollar, which is showing some headwinds.
The chart below displays the annual seasonal trend for the US Dollar. Note the large unfavorable period over much of the year - extending from Trading Day of the Year (TDY) #59 through TDY #203. For 2022, this period extends from 3/24 through 10/18.
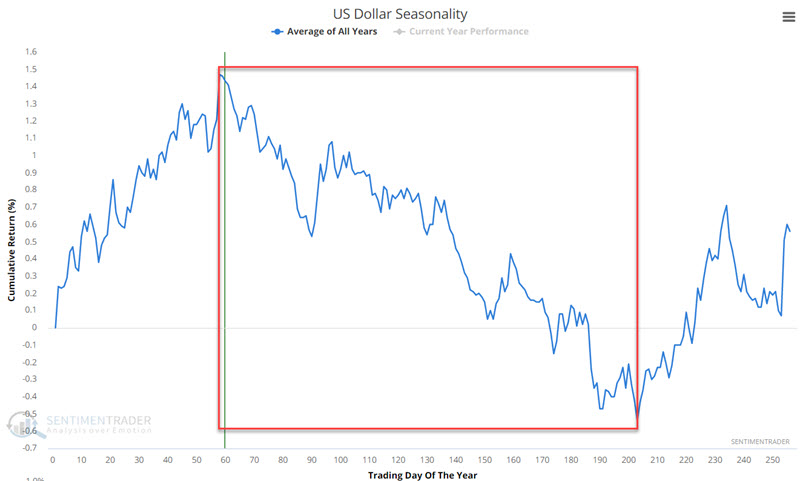
The chart below displays the growth of $1 invested in the US Dollar only during this unfavorable period every year starting in 1985. Note the negative skew.
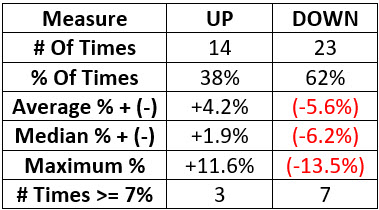
Optimism on the dollar has been high for an extended time, just as it enters this seasonally weak period.
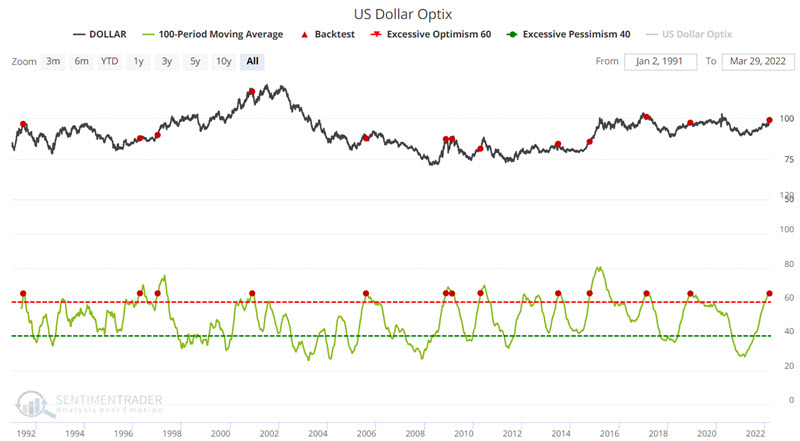
The chart below displays the action of the US Dollar in the top clip and the 100-day moving average of Dollar Optix in the bottom clip. The red dots highlight those times when the 100-day average for Dollar Optix crossed above 65. This represents an extended period of high optimism regarding the dollar, which is now in effect. The buck has struggled after similar bouts of optimism.
The yen on the other hand...
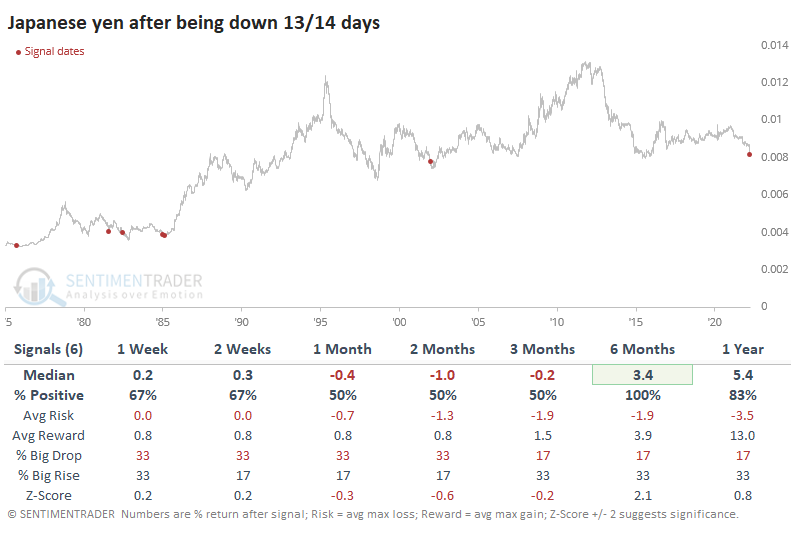
The yen just can't catch a break. Heading into the end of last week, it sunk versus the U.S. dollar on 13 out of 14 sessions. That kind of losing streak has rarely been matched.
The others generally occurred around significant lows but not imminent ones. The yen bounced around for the next 2-3 months but 6 months later was higher each time. Granted, the sample size is tiny.
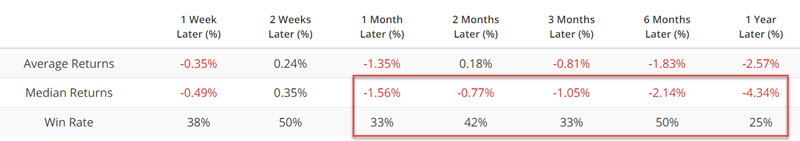
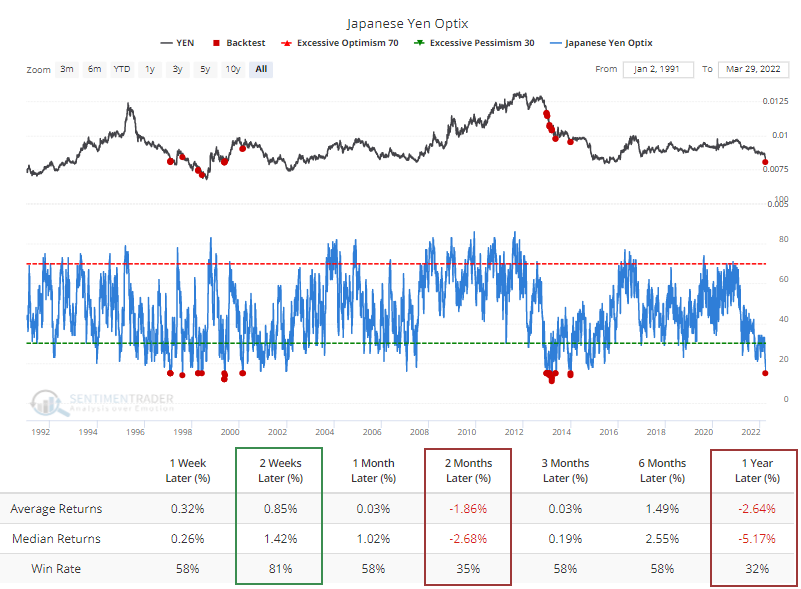
The losses have clearly weighed on sentiment. The Optimism Index for the yen has dropped to the lowest level in nearly a decade.
The Backtest Engine shows that a reading of 15 or below leads to quick snapbacks, but most were unsustainable. Only structural bear markets have generated this kind of despair. During structural bull markets, the Optimism Index didn't drop below 20, or if it did, it quickly brought in buyers.
Part of the Optimism Index calculation includes hedgers' positions in the yen. Hedgers take the opposite side of speculators' positions, so a large net long among hedgers means that speculators are heavily short. Which they are; more than 40% of open interest. The problem is that major bottoms in the yen didn't hit bottom when hedgers were heavily long. It bottomed when hedgers started to reverse those positions and went net short, which they are still far from doing.
The yen is about to exit its worst seasonal time of the year and enter the best. While much more exaggerated, it has roughly followed its typical pattern.
Currency markets tend to be the least reliable for medium-term mean-reversion tactics. The concepts of overbought/oversold or optimism/pessimism can work in very short time frames and very long ones. The multi-month time frames that are the sweet spot for extremes in most other markets aren't very effective in currencies. The yen is a perfect example. While some factors are lining up for a potential rally, it's hard to have a lot of confidence in it. After a historical bout of persistent selling, the currency is entering its best time of the year with extreme pessimism. In most markets, that would be good enough for a speculative bet at least, but risk is high.
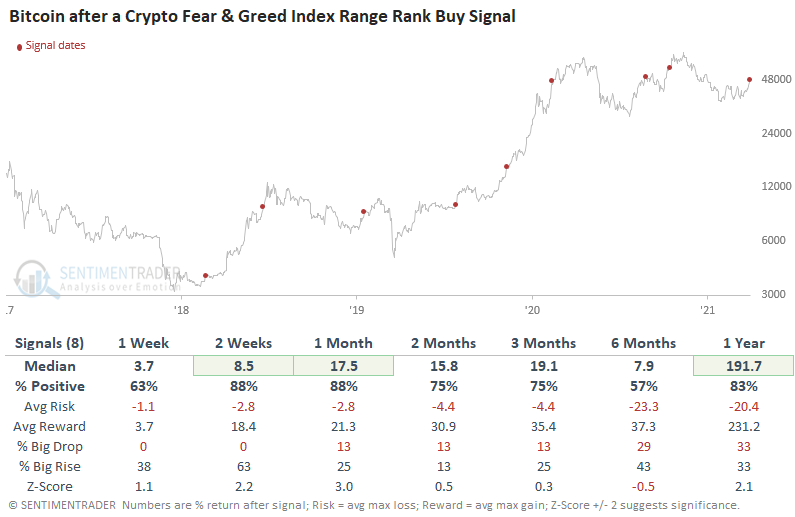
Bitcoin Fear has morphed into Greed
The Crypto Fear and Greed Index reversed higher relative to its recent range, triggering a new buy signal for Bitcoin.
Dean showed that this model, created by Alternative.me, calculates a weighted sentiment measure for bitcoin then ranks the fear and greed index range over a multi-month lookback. It looks for times when sentiment reversed from extreme Fear to extreme Greed while underlying momentum is postiive.
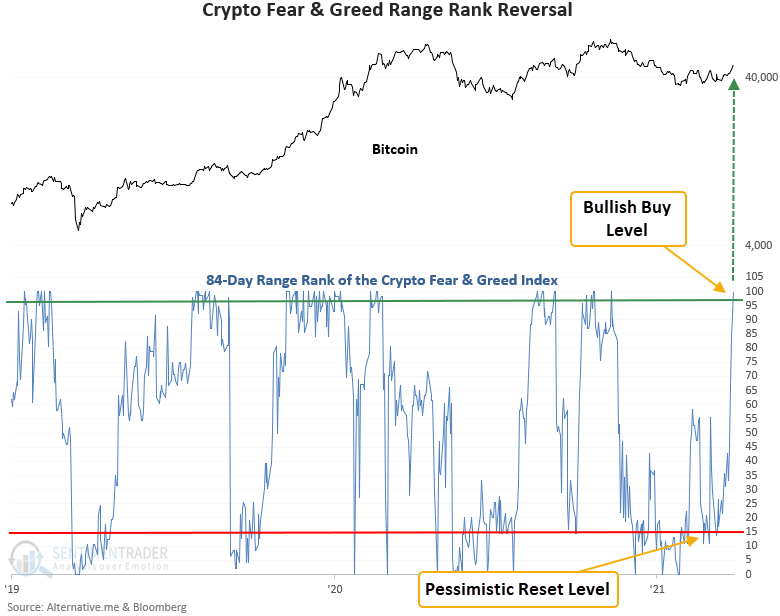
This signal was triggered 8 other times over the past 3 years. After the others, Bitcoin's future returns, win rates, and risk/reward profiles were solid in the near term, especially in the 1-month time frame. The signal showed a positive return at some point in the first month in all 8 instances.
About the Weekly Wrap...
The goal of the Weekly Wrap is to summarize our recent research. Some of it includes premium content (underlined links), but we're highlighting the key focus of the research for all. Sometimes there is a lot to digest, with this summary meant to highlight the highest conviction ideas we discussed. Tags will show any symbols and time frames related to the research.