
TradingEdge for Apr 8 - Bond thrusts, positive tech developments, a couple of worries

Key points:
- Breadth thrusts have expanded from indexes to entire exchanges to the high-yield bond market
- Investment-grade bonds have also seen a notable shift in sentiment
- The Nasdaq 100 enjoyed an outside up month in March
- That helped power a significant retracement in the Nasdaq Composite
- Several other factors are pointing up for tech stocks, like insider buying and high correlations
- Election Cycle seasonality shows a bullish tilt for April
- One worry - new orders are well below prices paid
- Another worry - the market environment is struggling to become healthy
- Transportation stocks have plunged, as have homebuilders, while Staples have shown relative strength
Thrusts expand to junk bonds
We've looked at breadth thrusts a lot in recent weeks, including surges in the McClellan Oscillator for the S&P 500 and the entire Nasdaq exchange.
It's not just in stocks; it's also happening in the high-yield bond market, an important development. As we saw in the S&P 500 and Nasdaq, the McClellan Oscillator for the high-yield bond market has surged.
The Backtest Engine shows that since the inception of the data, there have been 29 days when the Oscillator reached this high of a level. The iShares iBoxx High-Yield Corporate Bond Fund (HYG) showed consistently weak short-term returns as buyers took a breath. But by 2 months later, the momentum reasserted itself, and returns were exceptional in the months following.
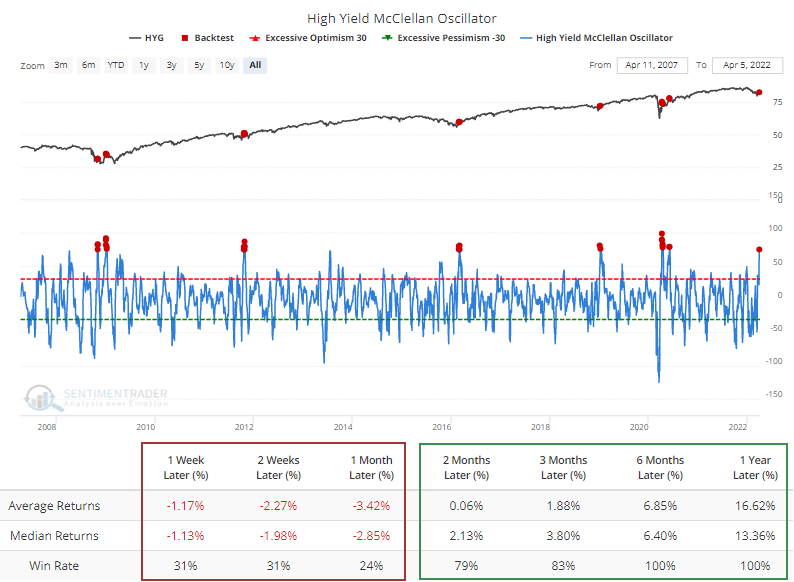
The high-yield bond market has a high correlation to the stock market. If we substitute the S&P 500 for HYG in the backtest, we can see similar behavior in that index. The S&P struggled in the short-term but showed impressive medium to long-term returns.
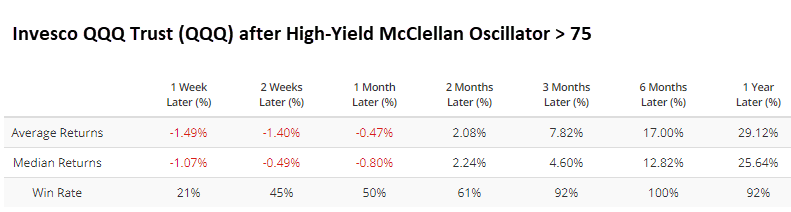
According to Bloomberg calculations on a list of popular ETFs and indexes, the most positive 3-month correlations to HYG are mostly higher-beta stock funds. Funds with a correlation higher than +0.65 include popular ones like QQQ, IBB, and EEM. Using the Backtest Engine to test surges in the high-yield Oscillator against the QQQ Nasdaq 100 tech fund, returns were very weak short-term but exceptional from 3-months and beyond.
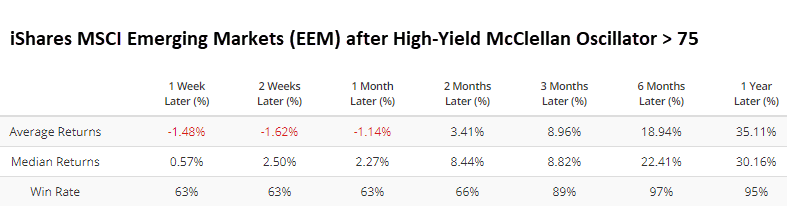
Emerging markets also had a high positive correlation. While EEM didn't suffer as much short-term, medium- and long-term returns were fantastic.
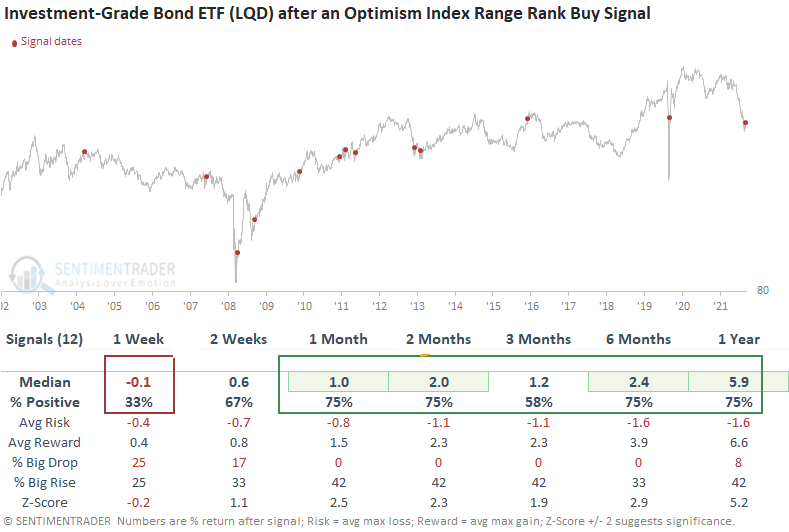
Investment-grade bond sentiment is recovering
Dean noted that a trading model that uses the Optimism Index to pinpoint when sentiment reverses from a period of pessimism issued a buy signal for the investment-grade bond ETF (LQD) on April 1st.
The model uses a short moving average of the Optimism Index and looks at its current value relative to its range over the past 4 months. Sentiment has to reverse from a low to a high level, and then momentum in the underlying market needs to turn positive.
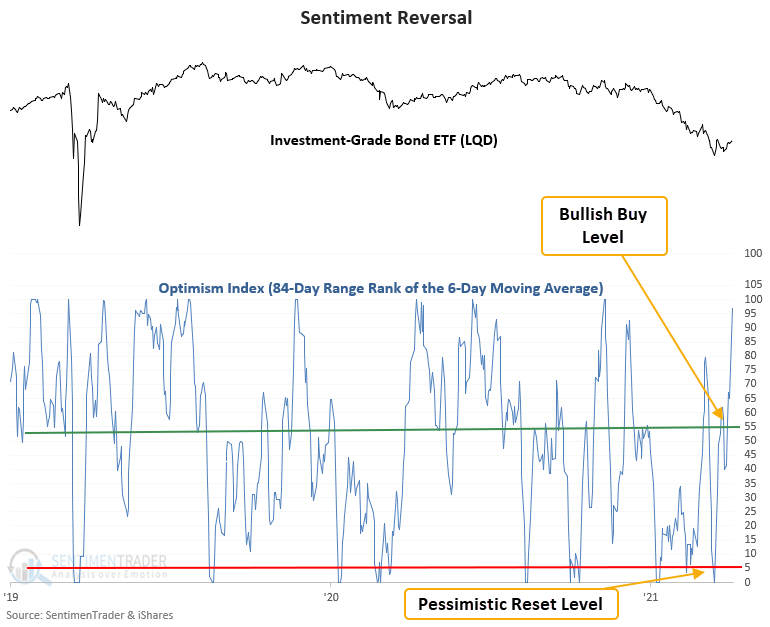
The trading model generated 12 other signals over the previous 18 years. After the others, the LQD ETF's future returns, win rates, and risk/reward profiles were solid across medium and long-term time frames. The LQD ETF is a relatively new instrument so the sample size is small.
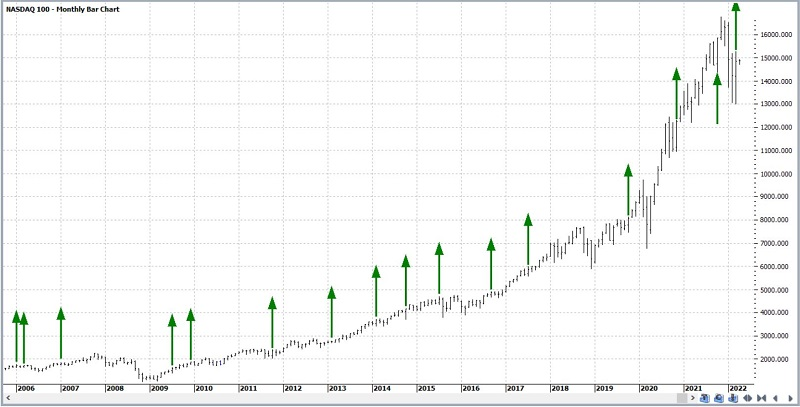
Tech stocks had a very good month
Jay looked at the Nasdaq 100's outside up month.
Momentum is a huge factor in the stock market. When it gets going in one direction, momentum can propel the market higher or lower for months at a time. An "outside up month" involves a higher high and lower low than the month before with a higher close.
The chart below is courtesy of ProfitSource and displays the Outside Up Months for the Nasdaq 100 Index since 2009.
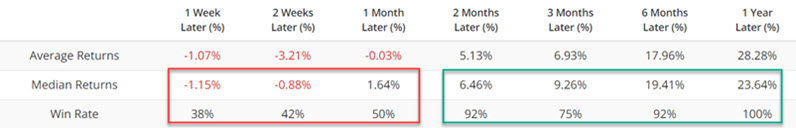
In the table below, the first line of data displays the percentage of times the Nasdaq 100 Index advanced in price 24-months following one of these months. The second line of data shows the percentage of times the Nasdaq 100 Index advanced, looking at ALL months since November 1990, and the third line of data displays the difference between the two.
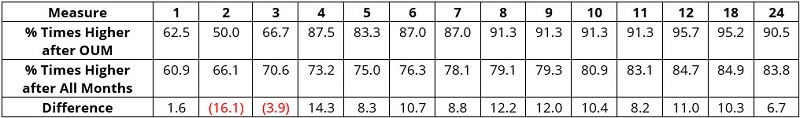
Interestingly, the NDX was higher less often 2 and 3 months after an outside up month than for all months. All periods beyond three months saw the Nasdaq 100 gain ground a very high percentage of time (86% or more) and significantly more often than for all months.
Does this mean the index is "a sure thing" to stage another rip-roaring advance in the months ahead? Not at all. The market rallied two months after October 2021 but sold off hard during January and February 2022 before bouncing in March.
The bottom line is that an outside up month is not an "automatic" buy signal or a standalone model. It is one more piece of evidence for investors to weigh.
The good month allowed for a significant retracement
During bear markets, there typically is not a strong impulse among buyers, and stocks have a hard time retracing much of their decline. That is most certainly what did NOT happen in April/May 2020, and it's not what's happening right now.
Only 15 days from its latest 52-week low, the Nasdaq Composite has already retraced 56% of its decline. That's almost exactly the same retracement the Nasdaq clawed back in the first 15 days of the rally in 2020.
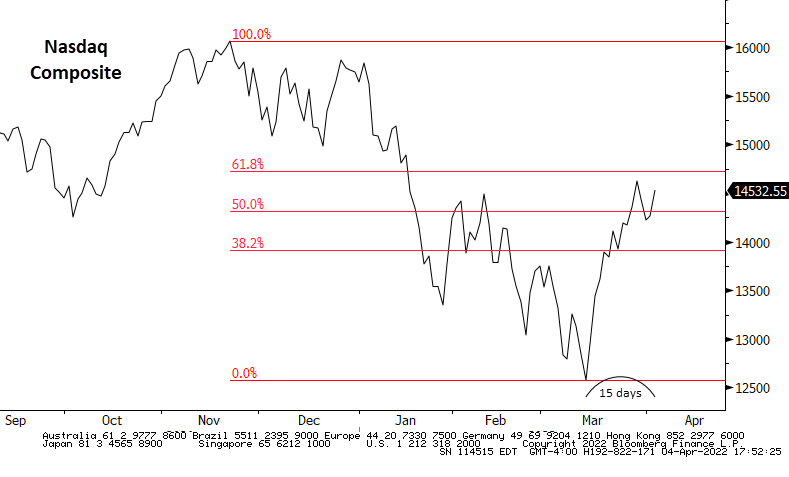
As we saw 2 years ago, swift and significant retracements of declines between an index's latest 52-week high and low have a strong tendency to occur at meaningful troughs.
The table below shows retracements of 25% or greater in the 15 days following a 52-week low. There were a couple of fakeouts, with 1-year losses in 1973 and 2008. But over the next 2 months, there was only a single loss, and the risk/reward was massively skewed to the upside.
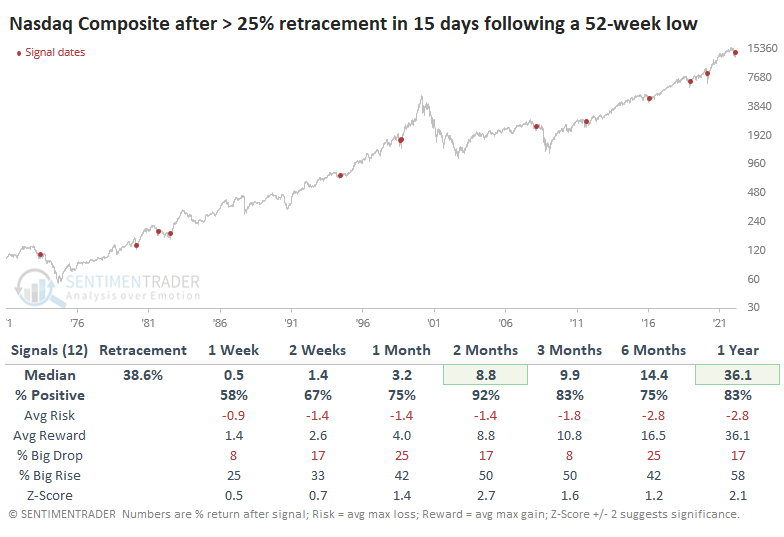
Contrast that to rallies that retraced less than 25% of their decline in the first 15 days. This was twice as common, and most of these ended up failing, leading to losses and lower lows. Bear markets tend to see weak buying pressure that falters quickly.
More potential positives for tech
Jay outlined a handful of other positive factors for technology stocks.
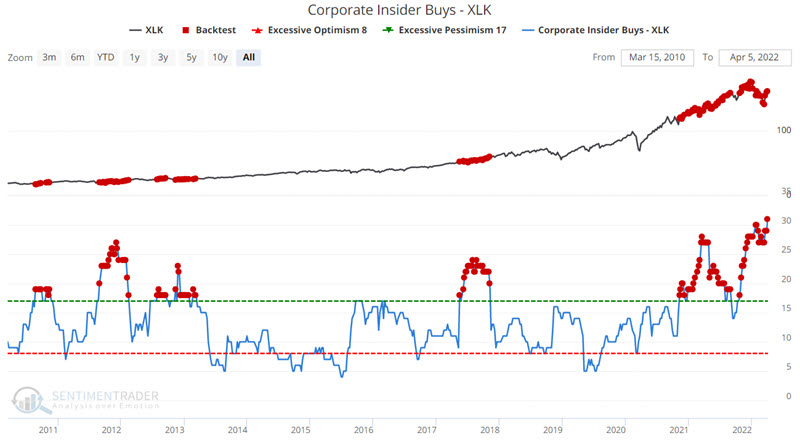
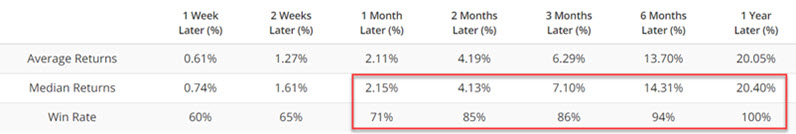
The chart below displays the level of open-market share buying done by corporate insiders among the constituent companies in the S&P 500 Technology Sector. As you can see, corporate insiders have been on a major buying spree for most of the past 17 months. Once this reached at least 17 different insiders, the tech sector tended to do very well in the months ahead.
During times of panic, investors tend to buy or sell "everything" together, no matter their individual merits, so correlation rises. The higher it goes, the more we're seeing group-think, which tends to happen at times of extreme pessimism, and is thus usually a positive for stocks going forward. The chart below highlights those times when this indicator crossed above 0.70, which it just did.
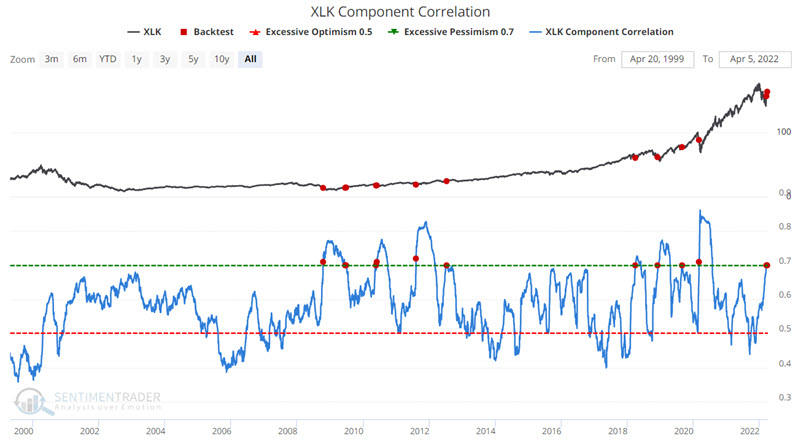
Periods of high correlation tend to happen in volatile conditions, and short-term returns in XLK were poor. But over the next 2 months and beyond, tech stocks showed excellent returns.
Midterm election seasonality should be a (brief) tailwind
Jay took an in-depth look at a seasonal bias surrounding election years.
The Election Cycle is 12 months per year for four separate years - Post-Election, Mid-Term, Pre-Election, and Election. The theory is that the stock market performs better during certain months within this 48-month cycle than during other months.
The 18 months containing the word "Stocks" implies that we want to be in the stock market during these months ("favorable" months). Months without "Stocks" should not be considered outright bearish, although long-term results during these months have been quite unfavorable.
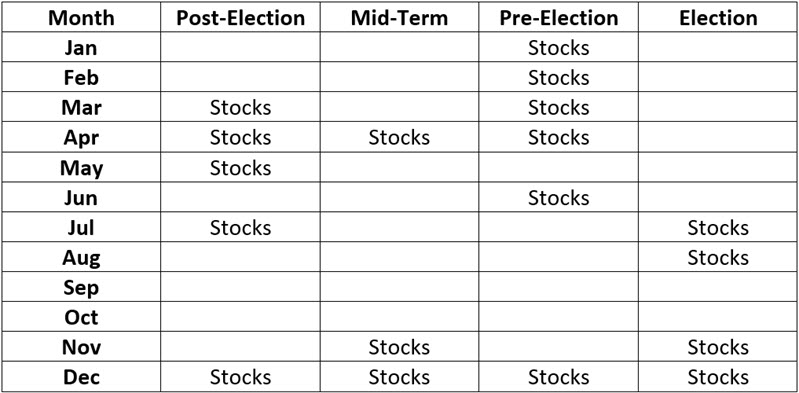
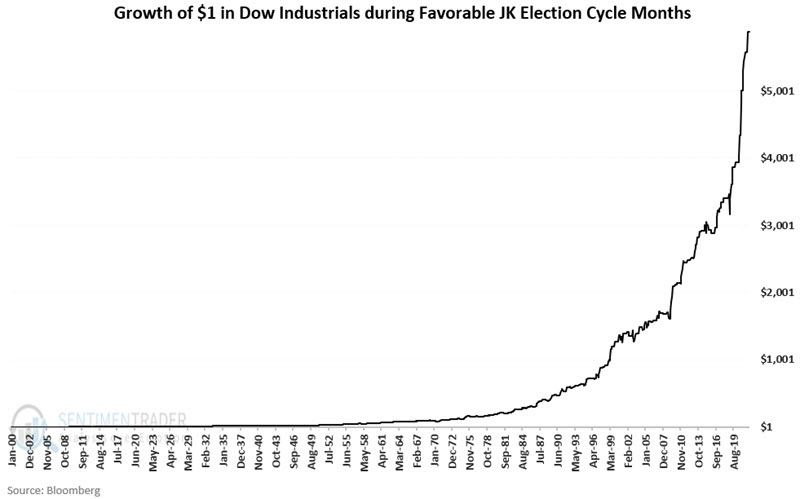
Note that April of 2022 is listed as a "favorable" month. The chart below displays the cumulative growth of $1 invested in the Dow since 1900 only during the months labeled "Stocks" in the table above.
The chart below displays the cumulative growth of $1 invested in the Dow since 1900 only during the months NOT labeled "Stocks" in the table above.
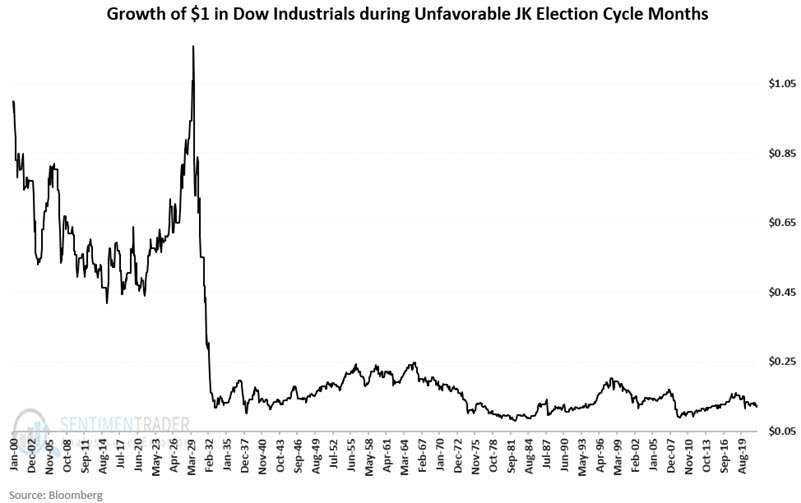
From December 1899 through March 2022, the Dow Jones Industrial Average gained +587,733% during "favorable" months; it lost -84.8% during "unfavorable" months.
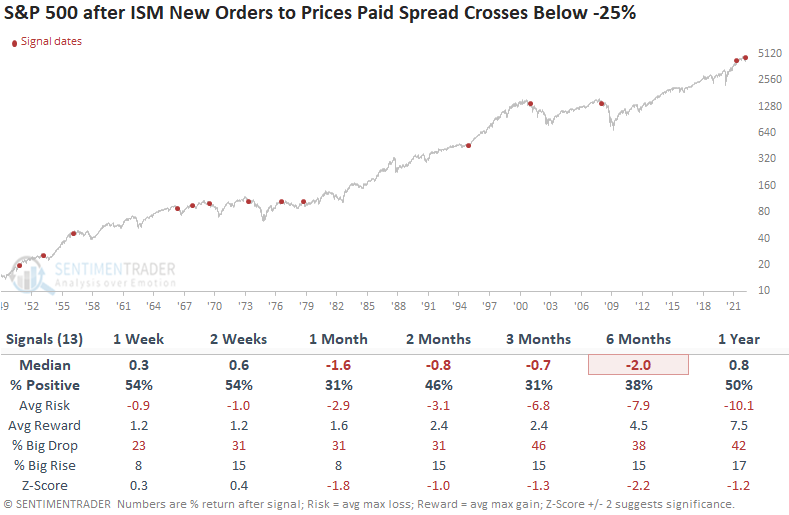
A fundamental worry
The Institute for Supply Management releases its monthly survey on manufacturing on the first business day of each month. While the manufacturing composite index gets the headlines, Dean likes to examine the relationship between two individual components.
He showed that the spread between new orders and prices paid is an excellent measure for identifying a bullish or bearish macroeconomic backdrop for the stock market. A significantly negative spread, like we saw this week, suggests an unfavorable environment as inflation impacts future growth.
The spread has fallen to the lowest level since 2008. Before that contraction, one has to go back to 1980 to find a similar comparison.
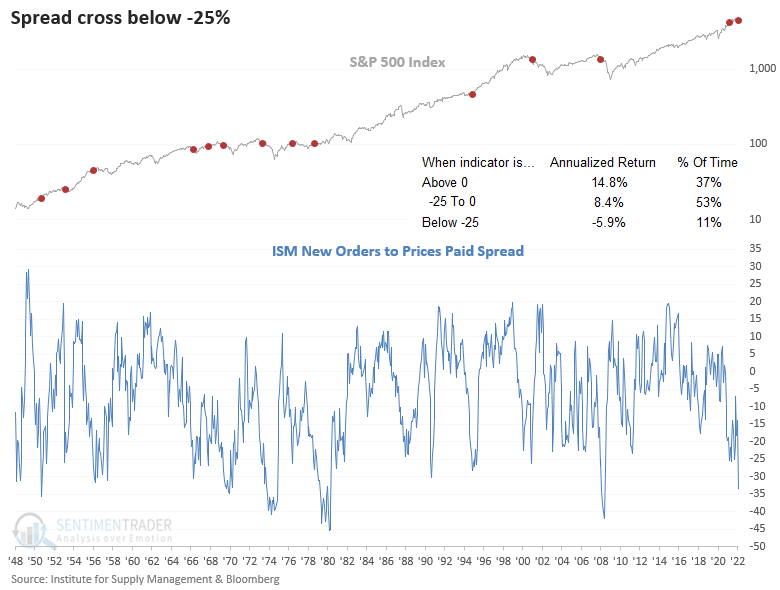
This indicator generated a signal 13 other times over the past 72 years. After the others, S&P 500 future returns, win rates, and risk/reward profiles were unfavorable across medium and long-term time frames. The previous signal shows healthy gains. However, we need to remember the Fed was conducting QE. Also note that the Fed reversed from a tightening to an easing cycle in 1995.
The sector and industry group outlook suggests a cautionary stance for the consumer discretionary sector as returns are negative across all time frames. Energy looks favorable on a relative basis. Due to data limitations, returns reflect signals since 1966.
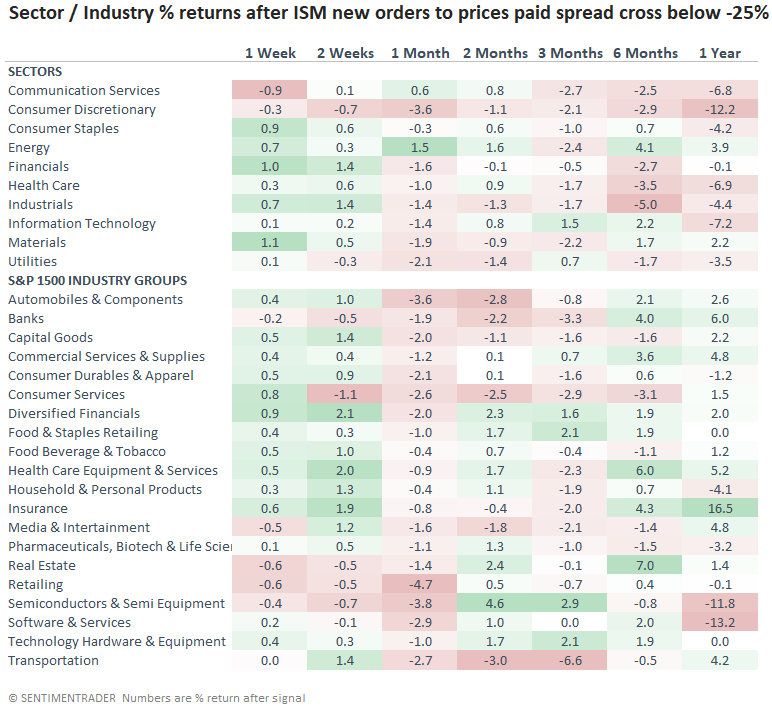
When the ISM new orders to prices paid spread contracts by 25% or more, inflationary pressures impact future growth, which results in a challenging environment for stocks. Similar setups to what we're seeing now have preceded flat to weak returns for the S&P 500 on a medium and long-term basis. A review of sectors, industries, and sub-industry groups suggests opportunities outside the consumer discretionary sector may be more favorable. We should be mindful that the economy could slow in the coming months and should keep an eye on the Macro Index Model.
The market environment is struggling to become healthy
After the most benchmarked index in the world fell into a "10-and-10" correction, buyers stepped in with force. Breadth thrusts have been recorded in indexes, entire exchanges, and even in high-yield bonds.
And yet this is all within a post-speculative sentiment bubble and a still-struggling market environment. Even after the thrusts, the environment has not managed to turn consistently positive. As of Tuesday's close, only 3 of the 8 primary factors we focus on were in healthy territory. A couple of them are flirting around their thresholds, so this can improve quickly, but it needs to be sustained.
Over the past several years, these measures have provided a good heads-up to stay out, or at least cautious, when the environment is unhealthy. When 5 or more factors are healthy, stocks tend to do their best.
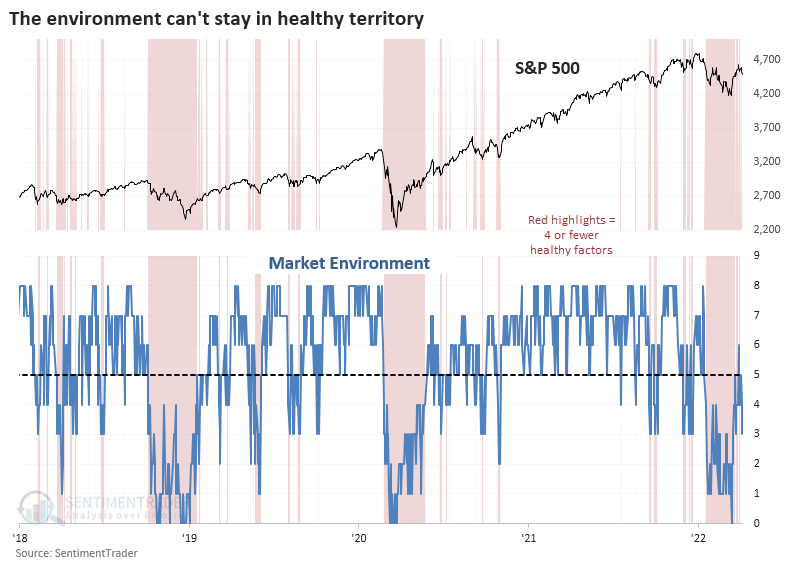
Using this as a trading system would be difficult because it can jump in and out during choppy markets. But using next-day returns, the equity curve is drastically different depending on the environment. Since 1990, $10,000 grew to more than $72,000 during healthy environments and only $17,000 during unhealthy ones. Early 2018 was kind of screwy; otherwise, these figures would be stretched even further.
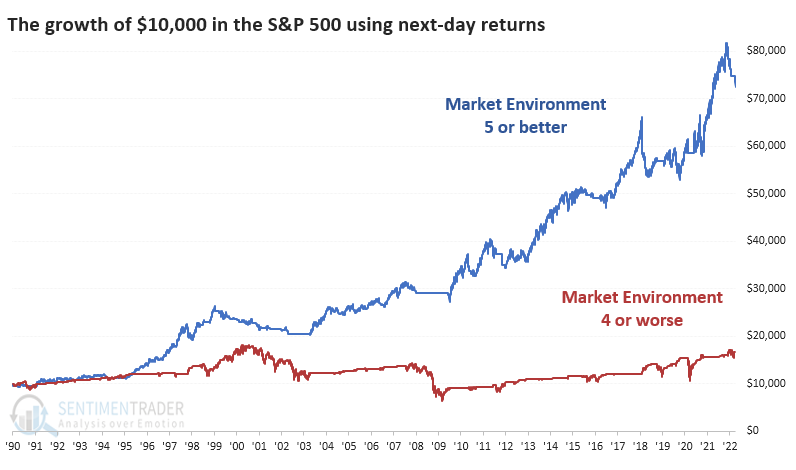
We're always more concerned about risk than reward, and looking at the drawdowns in the two curves, unhealthy environments saw a drawdown about 3 times greater than healthy ones.
There are strong suggestions that the interest from buyers over the past 3 weeks is the kind of activity that tends to generate even more buying interest during the next 1 to 3 months. We place a lot of weight on breadth thrusts in all their various forms, and many of them have triggered. Given the larger context, we'd like to see more environmental factors turn positive. The fact that they're not makes it riskier to add exposure.
Transports have plunged, not a great sign
Dean assessed the outlook for the Dow Jones Transporation Index and the broad market when the 5-day rate of change declines by more than 10%, focusing on times when the S&P 500 was within 4 months of a new high.
We haven't seen this type of downside momentum in transportation stocks since the pandemic crash in 2020.
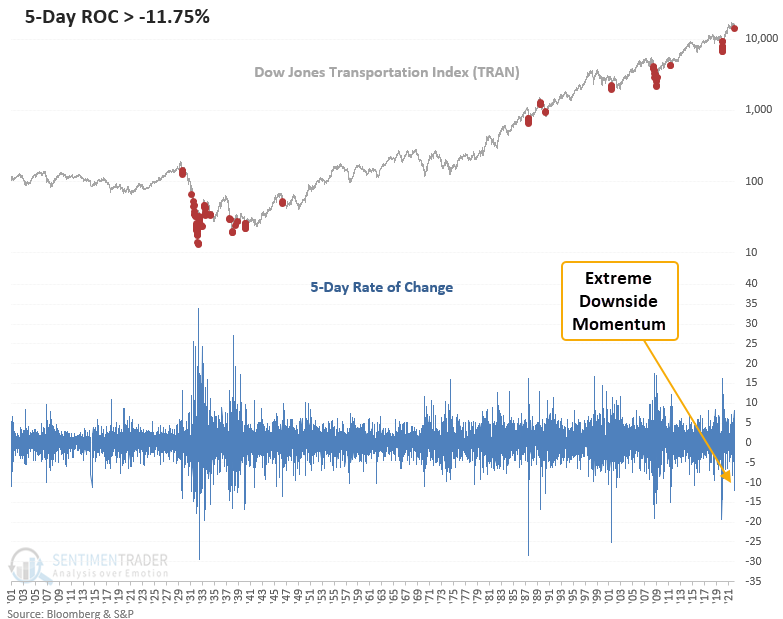
This study generated a signal 10 other times over the past 93 years. After the others, the transportation Index showed unfavorable returns, win rates, and risk/reward profiles in the 1 to 13-week range. However, the 6-12-month windows look much better. Except for the 1945 signal, the transports recorded a lower close at some point in the next few months.
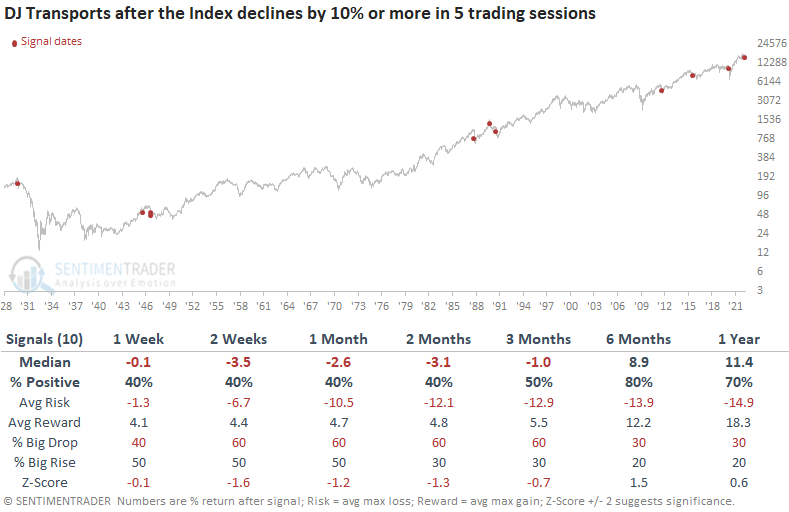
When he applied the signals to the S&P 500, the results look much better across all time frames, especially the 6-month window. Since the financial crisis low in 2009, the transportation industry has experienced 3 cyclical slowdowns that have not resulted in a broad economic recession. So, we need to be careful about what the transportation industry might signal concerning the overall market or a potential recession.
Homebuilders are struggling under rising rates
The S&P 1500 homebuilders recently traded down more than 27% from a 2-year high. At the same time, the S&P 500 index was trading down less than 5% from its high.
Dean looked at the severe underperformance by the builders relative to the broad market, which has been a hot topic among market commentators of late. According to the National Association of Home Builders, housing's combined contribution to GDP accounts for roughly 15-18%.
The previous similar divergence between the builders and the S&P 500 occurred in September 2018, which happens to be the last time Fed policy was less friendly.
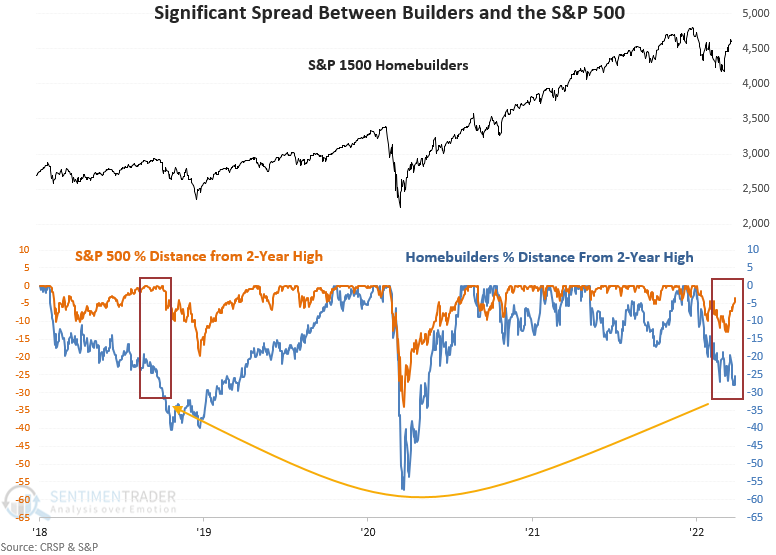
This signal has been triggered 39 other times over the past 57 years. After the others, S&P 500 future returns, win rates, and risk/reward profiles were uninspiring across medium and long-term time frames, especially in the 6-month window.
When he applied the signal dates to the S&P 1500 homebuilders, future returns, win rates, and risk/reward profiles look abysmal across all time frames. In the cases where the signal triggered well ahead of a market peak in the broad market, it didn't matter for builders. They continued to fall.
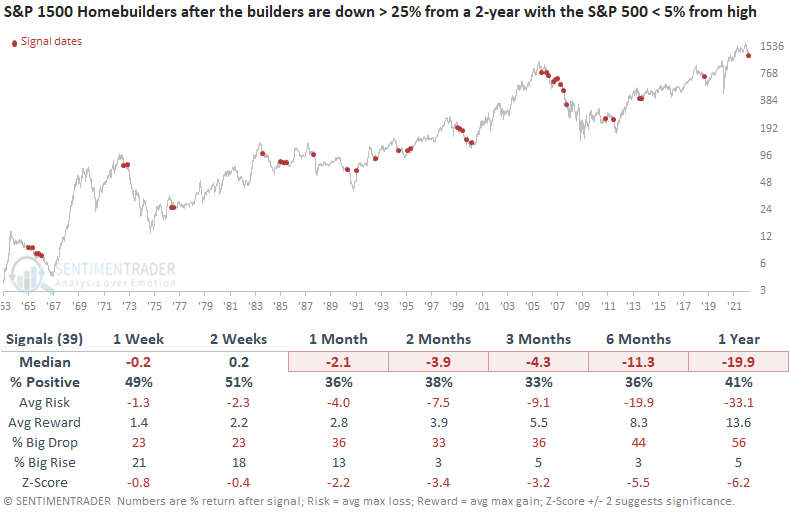
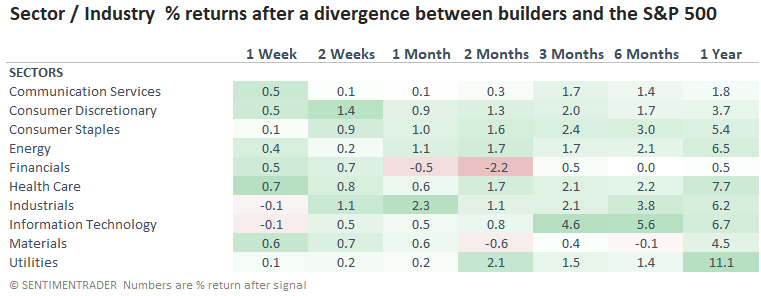
Applying the signals to sectors and industry groups, the return table highlights a weak environment for financials. So, we need to be mindful that the severe underperformance by the builders is foreshadowing a potential slowdown in the economy that impacts value-oriented groups. The current slope of the yield curve is starting to agree.
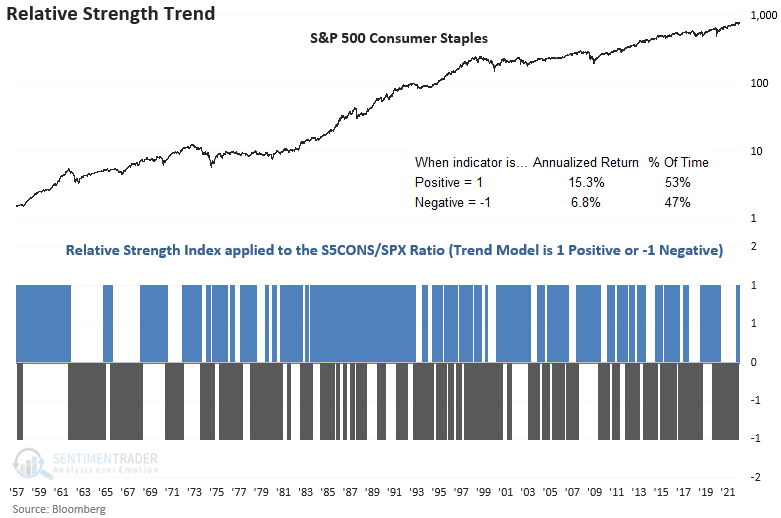
Staples, on the other hand, are showing relative strength
Dean noted that he likes to use the Relative Strength Index (RSI) indicator on the ratio between two securities to identify relative strength trends. When the RSI ratio exceeds 70, the relative momentum trend is positive.
This RSI ratio trend model reversed from negative to positive on 1/20/22 when the RSI ratio crossed above 70. Favorable RSI ratio trend conditions show significantly higher annualized returns for the consumer staples sector, with a return of 15.3%. In contrast, when the RSI ratio trend is negative, the sector annualizes at 6.8%.
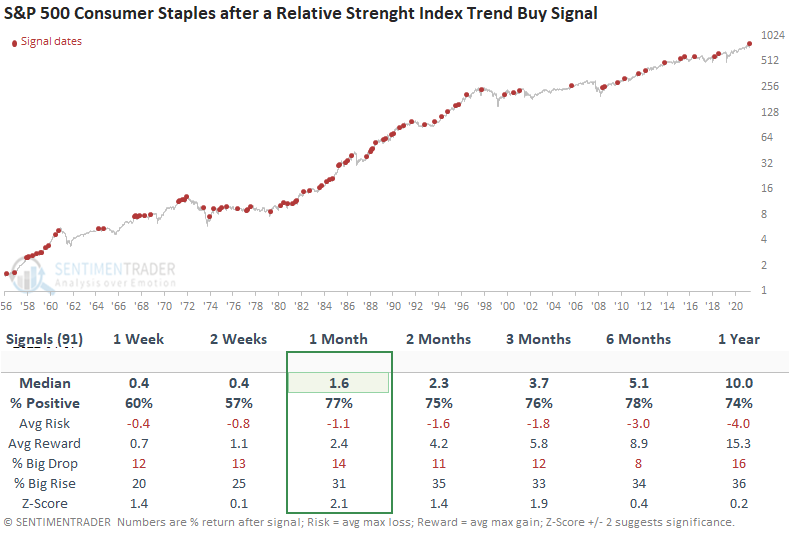
When the RSI for Consumers Staples itself (not relative to the S&P) crossed 70 this week, the model gave a buy signal.
This model generated a signal 91 other times over the past 65 years. After the others, consumer staples' future returns, win rates, and risk/reward profiles were solid across all time frames, especially the 1-month window. Since 1974, the model shows only one drawdown of greater than 5% in the 1-month time frame, 1990.
About the Weekly Wrap...
The goal of the Weekly Wrap is to summarize our recent research. Some of it includes premium content (underlined links), but we're highlighting the key focus of the research for all. Sometimes there is a lot to digest, with this summary meant to highlight the highest conviction ideas we discussed. Tags will show any symbols and time frames related to the research.