
TradingEdge for Dec 31 - Optimism is ebbing, traders are revering options bets, positive metal calendar, grading ourselves

Key points:
- Optimism in the AAII survey is unusually low given the market's trend and seasonality
- Wall Street strategists are more optimistic, pricing in 5% gains for 2022
- Options traders are reversing bearish bets on Discretionary stocks
- They're doing the same on stocks in general
- Silver is about to enter its best part of the calendar
- Platinum, too (but not the euro)
- Grading our market studies in 2021
Main Street is crabbier than usual
Sentiment toward stocks reached its peak soon after the beginning of the year. The speculative orgy heading into February coincided with a peak in some higher-risk assets but not the major indexes.
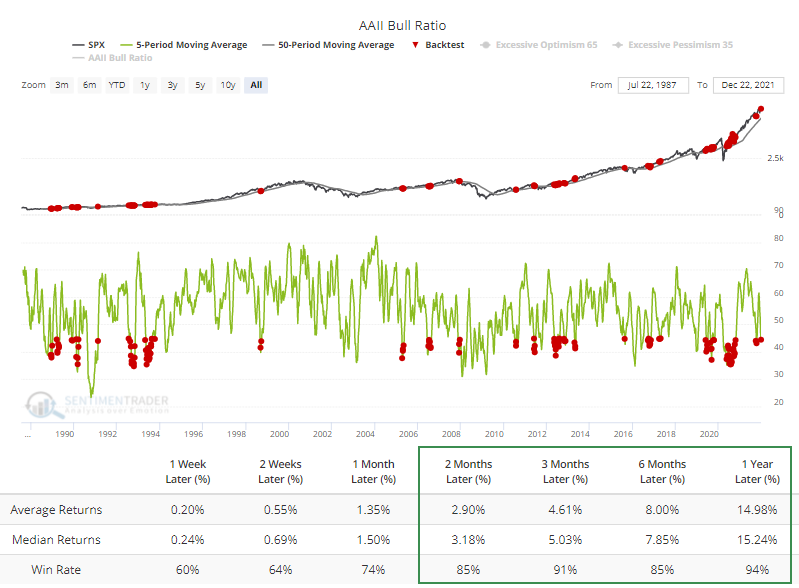
Even as those indexes have trudged higher, sentiment hasn't become as optimistic as it was early in the year. In particular, the crabby old folks who frequent the surveys from the American Association of Individual Investors have been faithful to their nature. The AAII Bull Ratio has held below 50% for 5 straight weeks.
When the 5-week average Bull Ratio is below 45% while the S&P 500 is above its rising 50-week moving average, the Backtest Engine shows that the S&P gained 91% of the time, 123 out of 135 weeks, over the next 3 months. There was a nasty loss during the 2008 financial crisis, but other than that, returns were mostly pristine.
Not only is it unusual to see this behavior when the S&P 500 is holding near all-time highs, but even crabby people tend to turn more optimistic during the holidays. Not this year - this is only the 2nd year time the inception of the AAII survey that the Bull Ratio was negative for the first 4 weeks of December. The other was the recessionary year of 1990.
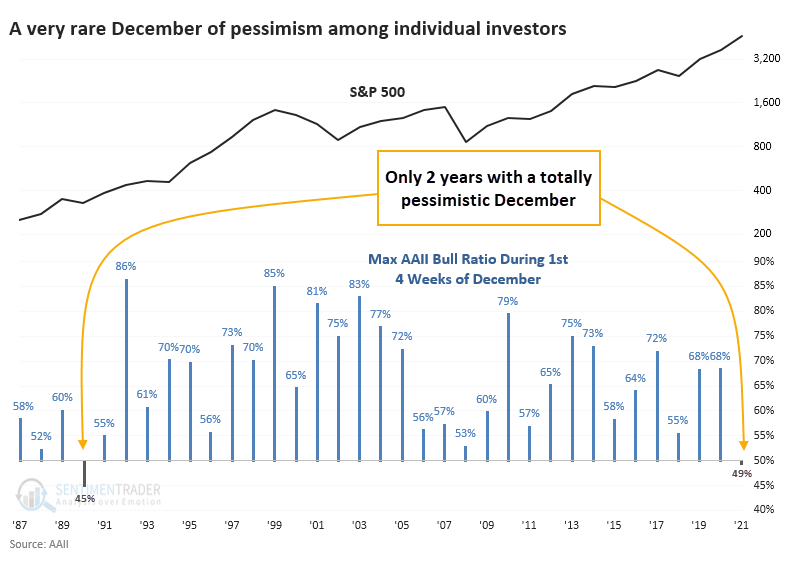
After the Decembers with the least optimistic investors, the S&P 500 performed well. Stocks stumbled following the 1990 bout of pessimism, then soared. Short-term returns were mixed, but over the next 6-12 months, the S&P only showed a rare loss.
There is often a disconnect between what these folks say and what they do. Despite tepid optimism in recent months, their stock allocation is near all-time highs. Go figure.
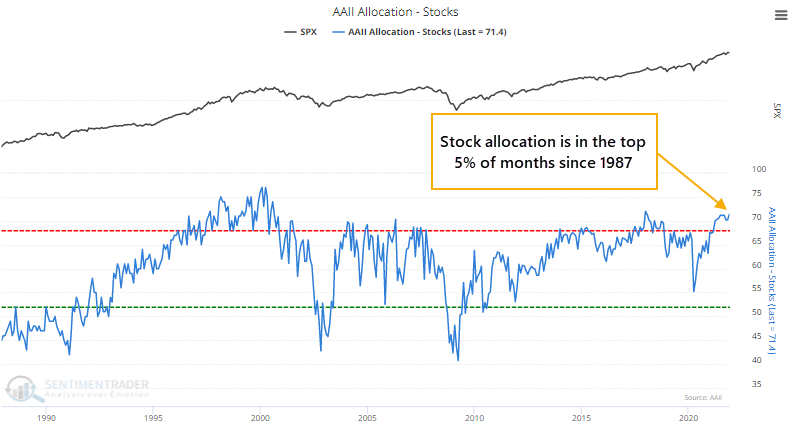
Their monthly allocation to assets tends to get stuck at extremes for extended periods, and using it as a guide to future returns is tricky. When there was a wide disparity between their allocation and their opinion, it favored their allocation. Besides the financial crisis, their high stock allocation was rewarded more than their pessimism.
Wall Street isn't infected with Main Street pessimism
While Main Street may be pessimistic, Wall Street isn't - analysts are busy upgrading price targets, and strategists expect the S&P 500 to add to its gains in the new year. Strategists' average price target for the S&P 500 over the next year is nearly 5% higher than where the S&P was on Monday, suggesting the index is undervalued. LOL.
There are a whole host of caveats with this, including that Bloomberg only sporadically surveys Wall Street, so this could change quickly, but their estimates would likely be increased, not decreased.
Based on current figures, when the S&P is more than 4.5% below strategists' year-ahead estimated price, the index returned an annualized +9.5%, versus a wretched -9.8% when the index was at least 4.5% above strategists' estimate.
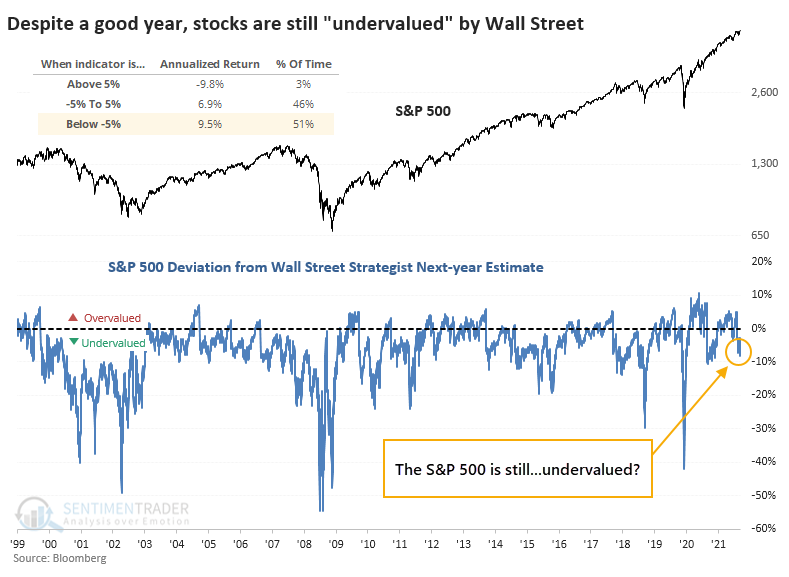
Looking at all years when there were 3 trading days left in the year, and the S&P was within 1% of a multi-year high, this is one of a handful that shows the S&P was still undervalued. And that was mostly a good sign for forward returns, especially in the first couple weeks of the new year. The only loser, in early 2015, reversed its losses in February.
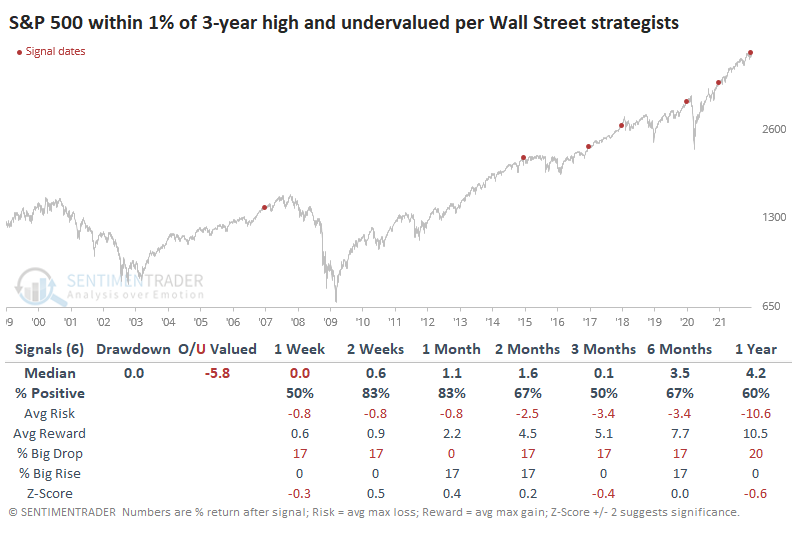
There were only 3 years when the S&P was within 1% of a high, and strategists thought the index was overvalued. All preceded declines.
Wall Street analysts and strategists are considered among the smartest of smart money. That isn't always the case, but when it comes to strategists, the S&P 500 does tend to revert toward their price targets over time. Granted, they have a 9% return as a baseline and rarely stray too far. When the S&P gets too far above or below their estimates, the index tends to snap back. The idea that it's currently about 5% below strategists' estimates suggests it has more room to rally.
Options traders reverse course on Discretionary stocks
When investors are bullish on stocks, they buy call options to bet on rising prices. Conversely, when they are bearish on stocks, they buy put options to bet on declining stocks. The put/call ratio can be used as a contrary indicator to identify an environment where sentiment has become too pessimistic on the future direction of stocks. When opinions become too bearish, stocks tend to rally.
Dean showed that the aggregated put/call ratio indicator measures the summed options data for constituents of the index/ETF.
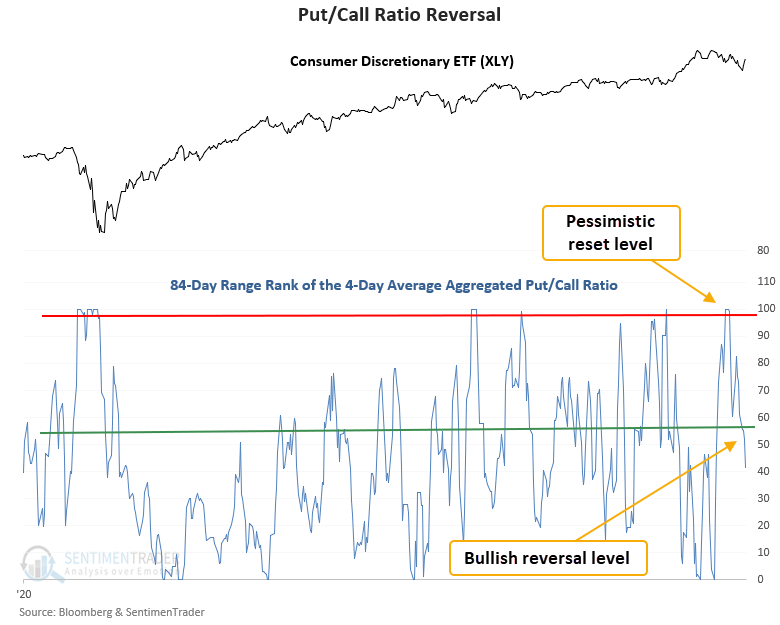
Dean applies two derivative indicators to the aggregated put/call ratio because the series is volatile and can have an upward bias over time. The first is a moving average to smooth the erratic nature of the series. The second is a range rank that I apply to the average put/call ratio. The range rank indicator solves the problem of an upward bias in the put/call ratio. i.e., An extreme level today may not have been an extreme level in previous instances. As a reminder, the range rank measures the current value relative to all other values over a lookback period. 100 is the highest, and 0 is the lowest.
The put/call ratio trading model applies an 84-day lookback period to a 4-day average of the XLY aggregated put/call ratio. The pessimistic reset condition is confirmed when the range rank indicator crosses above the 99th percentile. A new buy signal occurs when the range rank crosses back below the 59th percentile. At the same time, the 5-day rate of change for the XLY ETF must be >= 2%. i.e., market momentum is positive.
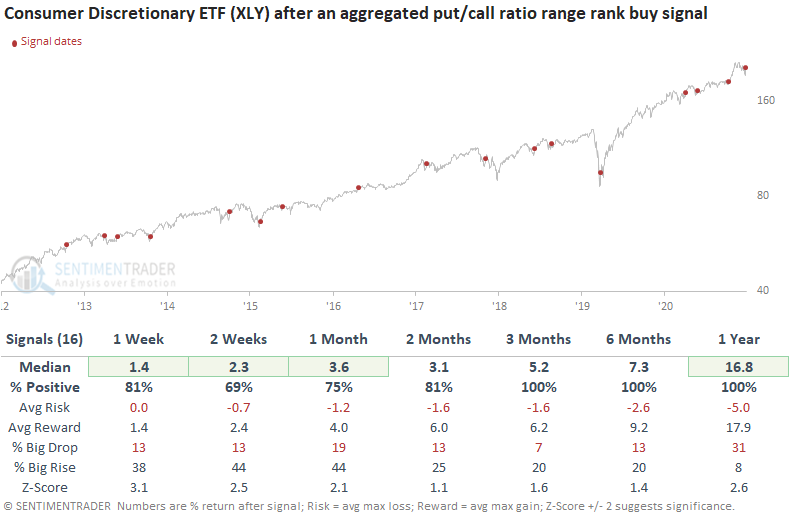
This signal has triggered 16 other times over the past 9 years. After the others, future returns and win rates were excellent across all time frames, especially the 1-week window. The aggregated ETF put and call volume data are new time series with a start date in 2013. So, history is limited to mostly bull-market environments.
And the market as a whole
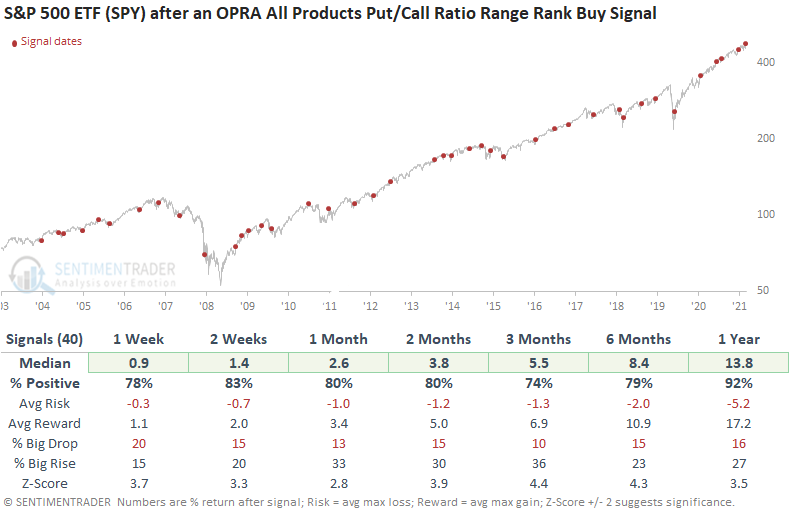
Dean also noted that the Total U.S. Put/Call Option Volume Ratio can be used as a contrary indicator to identify an environment where sentiment has become too pessimistic on the future direction of stocks. When opinions become too bearish, stocks tend to rally.
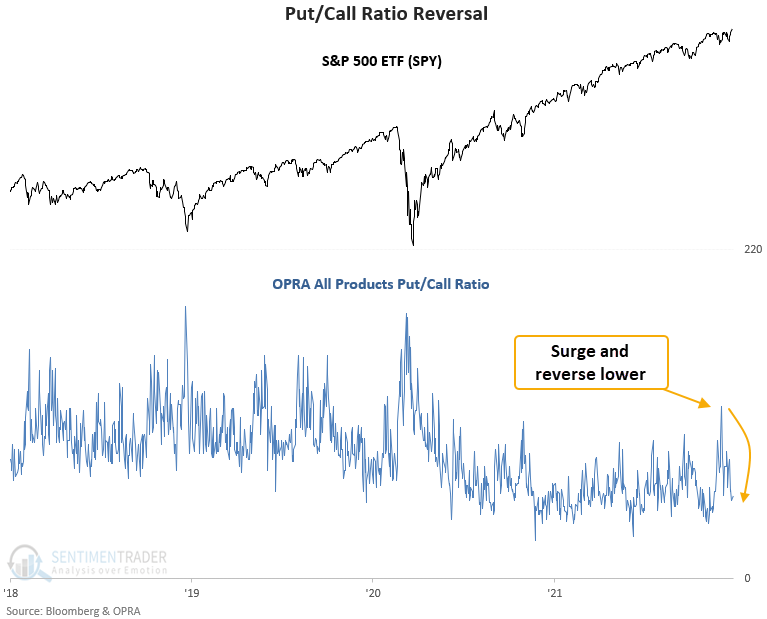
This signal triggered 40 other times over the past 18 years. After the others, future returns, win rates, and risk/reward profiles were excellent across all time frames, especially the 2-week window. And, the 2-week window shows a max drawdown of 3.4%.
More signs of risk-on behavior
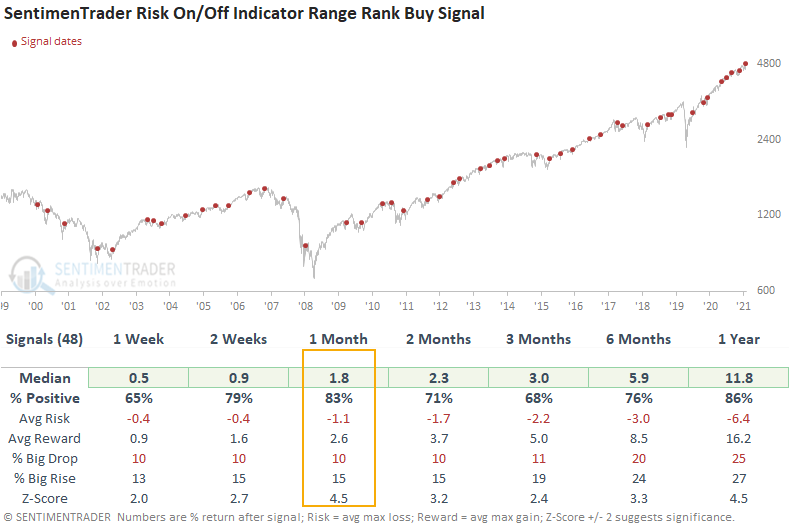
The SentimenTrader risk on/off indicator utilizes a weight-of-the-evidence approach by combining 21 diverse components into a single model to assess the current market environment. A level above 50% is considered risk-on.
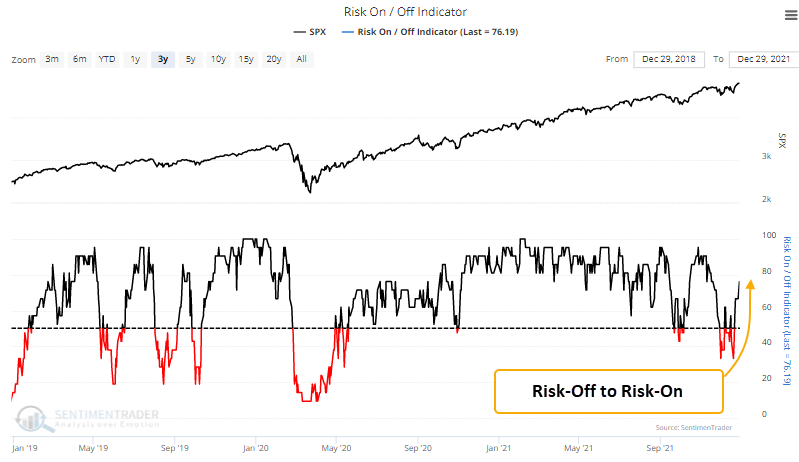
When Dean applied a range rank to the indicator, identified a bearish to bullish reversal. This same signal triggered in October, leading to a substantial 1-month gain.
This signal triggered 48 other times over the past 22 years. After the others, future returns, win rates, and risk/reward profiles were excellent across all time frames, especially the 4-week window. Since 2012, the 2-week time frame has registered 25 out of 27 winners.
Silver's golden window
Jay showed that silver is about to enter its best seasonal window of the year. The chart below displays the annual seasonal trend for silver futures.
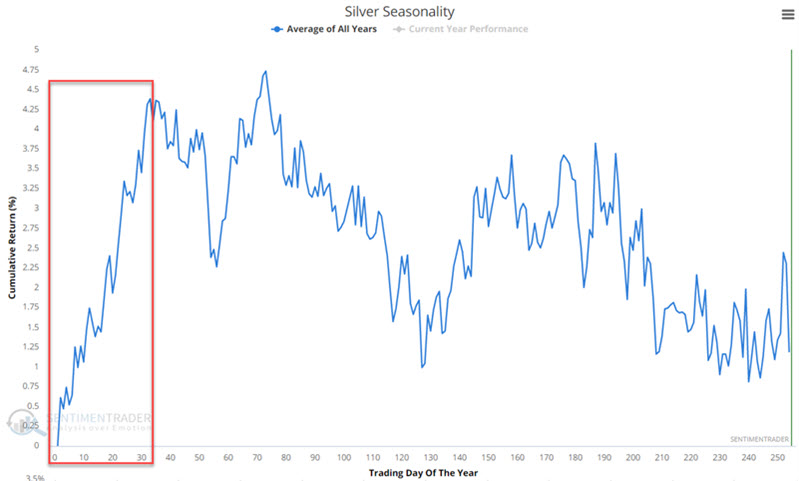
Our seasonally favorable period extends from the close on Trading Day of Year (TDY) #249 through Trading Day of Year #33 in the new year. In 2021-22 this period extends from the close on 12/28/2021 through 2/18/2022.
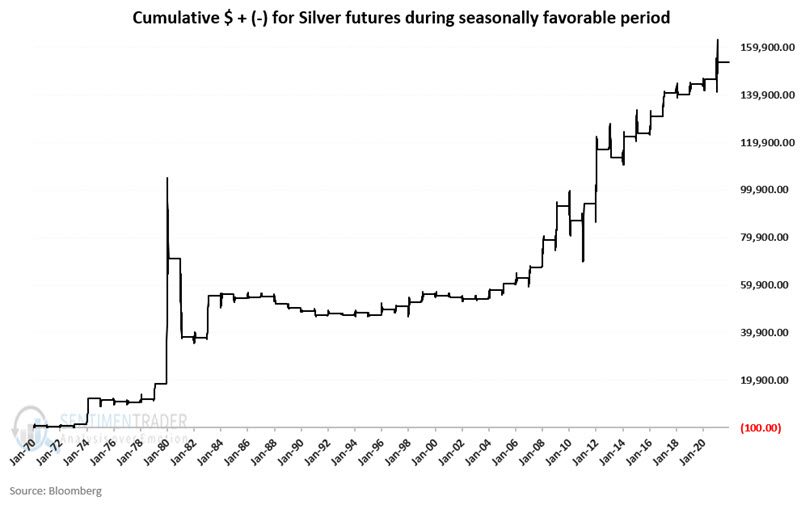
The chart below displays the cumulative $ return for silver futures during this seasonally favorable period.
The one glaring problem with all of this is that most individuals are not well suited to trade silver futures.
SLV (iShares Silver Trust) is an ETF intended to track the price of silver futures. Traders can buy and sell shares of SLV just as they would shares of stock. While this approach lacks the leverage of futures trading, it makes an investment in silver more accessible to many individual traders.
The chart below displays the year-by-year % return for SLV ONLY during our seasonally favorable period.
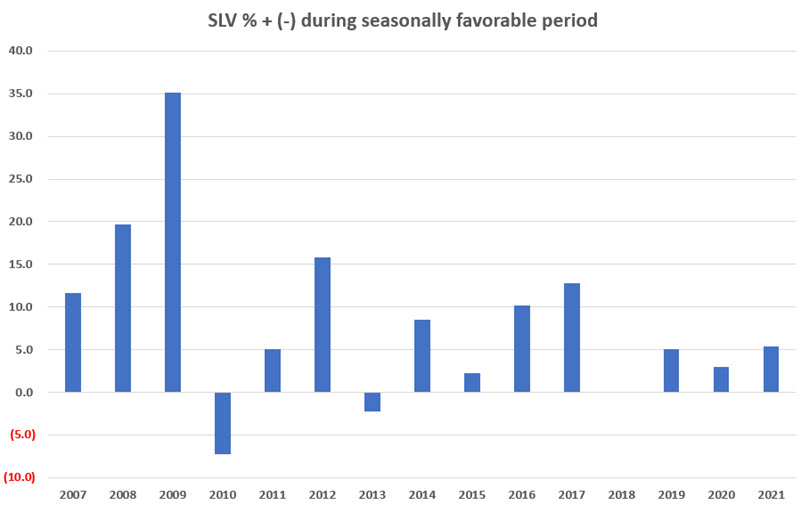
Since SLV started trading, SLV has gained +213% during seasonally favorable periods and lost -51% during all other trading days.
Silver tends to rally early in the year; however, results can vary widely from year to year. While results have been consistently favorable in the past roughly 18 years, there is no guarantee that this degree of favorability will continue. Silver futures offer the potential for significant gains but also a catastrophic loss for the unprepared and/or under-capitalized trader. The SLV ETF offers traders an unleveraged way to play the long side of silver.
Platinum, too
Jay also looked at the positive window looming for platinum. The chart below displays the annual seasonal trend for platinum futures.
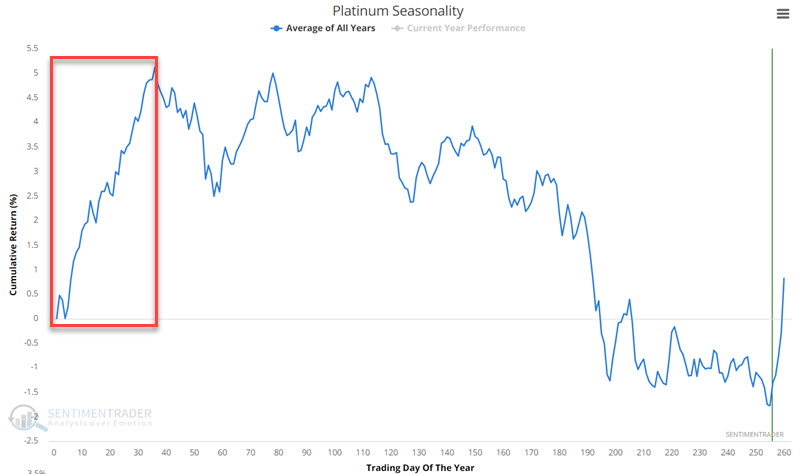
Our seasonally favorable period for platinum includes the last two trading days of the current year through the first 36 trading days of the following year. For the current cycle, this period starts at the close on 12/29/2021 and extends through the close on 2/24/2022.
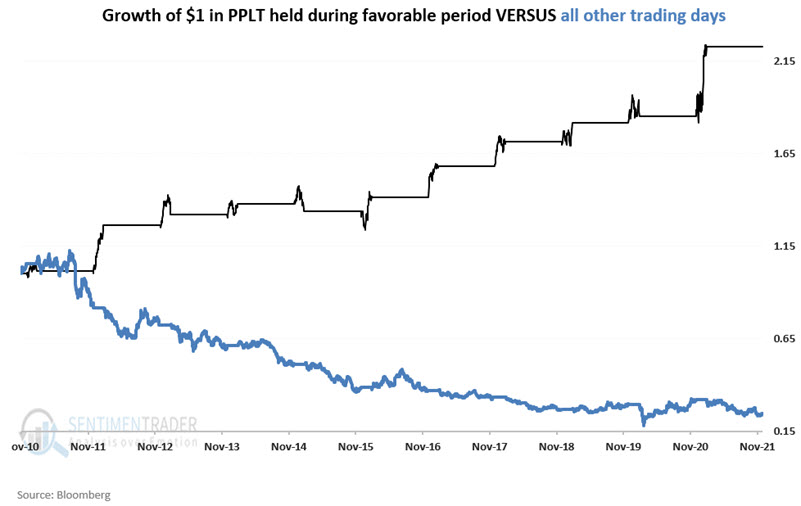
PPLT (Aberdeen Standard Physical Platinum Shares ETF) is an ETF intended to track the price of platinum futures. Traders can buy and sell shares of PPLT just as they would shares of stock. While this approach lacks the leverage of futures trading, it makes a platinum investment more accessible to many individual traders.
To fully appreciate platinum's performance during the seasonally favorable period, the chart below displays:
- The growth of $1 only during the seasonally favorable period
- Versus the growth of $1 during all other trading days
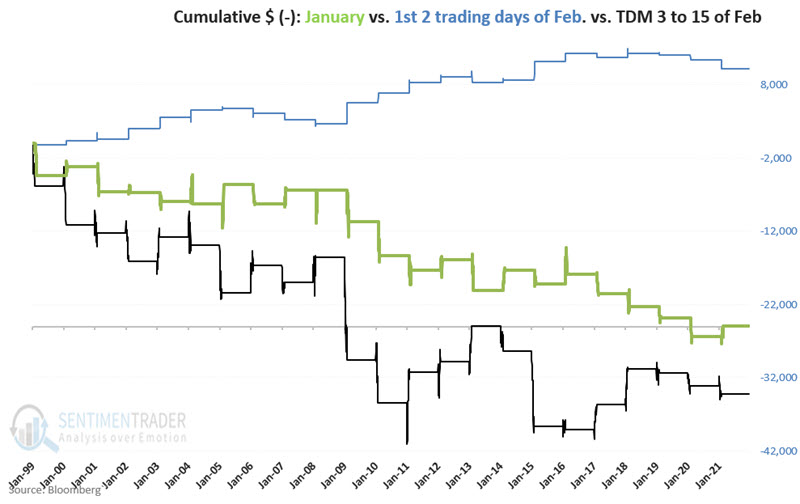
But not the euro
As always, when dealing with seasonality, it is essential to acknowledge that each year is its own roll of the dice. And that there are no sure things. Jay showed the annual seasonal trend for euro futures with that caveat in mind.
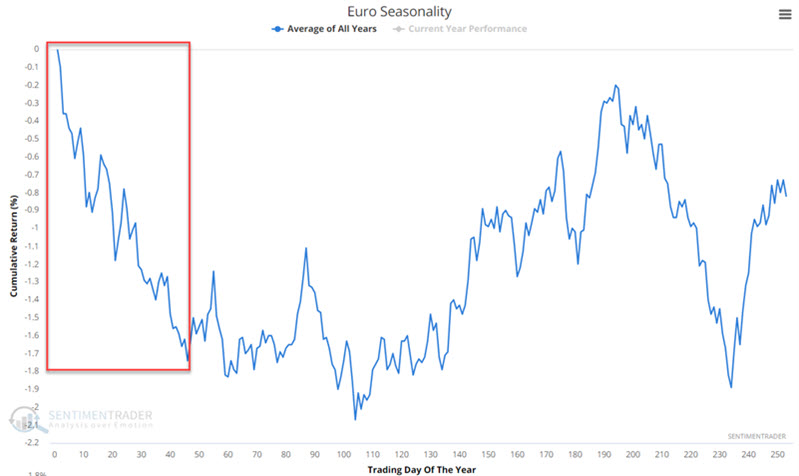
Our seasonal periods include:
- Unfavorable: the entire month of January
- Favorable: the first two trading days of February
- Unfavorable: the next thirteen trading days in February (i.e., through February trading day #15
The chart below combines the three factors above. The long-term tendency to decline during the two unfavorable periods is pretty apparent, as is the "oasis" nature of February's first two trading days.
Grading our market studies in 2021
As we've done near the end of prior years, it's time to take a look at our Archived Studies for 2021.
For every study we do at SentimenTrader that has a solid conclusion, we track it in the Active Studies. To remain accountable and transparent, after the studies' effective time frames have passed, we go back and rate them based on whether they were a good guide or not, and they then show up in the Archived Studies. There are 860 studies that have been rated.
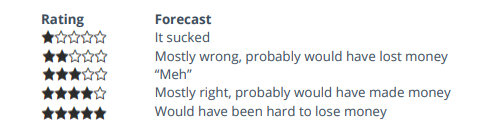
Near the end of each year, we objectively review studies that were closed during the year. The ratings are based on how the indicated market performed over the time frame that was most consistent in the study. They range from 1 to 5 stars.
Below, we can see a breakdown of study results for 2021. Using a conservative rating approach, the studies continue to show a positive expectation. The results from this year were effective, though it was the worst year out of the past 5. The biggest problem was from early in the year when nothing seemed to matter, and stocks drove higher day after day. The S&P 500 rolled right past signs of historic speculation and split market conditions.
Out of 105 studies that were graded, totally incorrect ones accounted for 26% of the total, the worst out of any year. But 40% of the studies got 5 stars - not the best year, but pretty good. This was a binary year, when things either really worked, or really didn't. Not much middle ground.
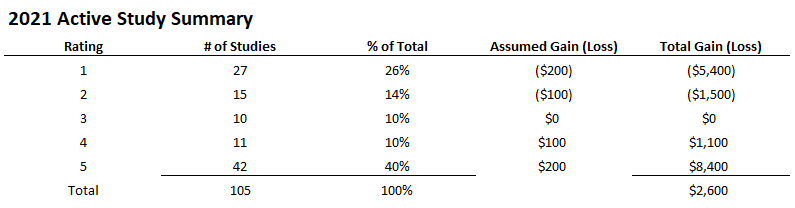
Assuming that we would have lost as much on the bad studies as we gained on the good ones - basically, that our stop losses were equal to our profit targets - then we would have made $2,600, or about a 26% return on the $10,000 total "invested" assuming we put $100 on the market for each of the 105 studies.
This is not a trading system and would be hard or impossible to implement if it was. It's just a shorthand way of trying to determine if the studies have been helpful over the years.
As long as the expectation of our studies continues to be consistently positive, then we feel there is value in analyzing markets this way. We think it's unique to our service since most others don't objectively track and grade their analysis, hoping nobody notices. It's not always easy, because sometimes it doesn't work, and nobody likes to admit failure. But acknowledging the difficulties and looking at things the way they are instead of how we want them to be is a good way to improve, and that's something we're always looking to do.
As we head into the new year, most of our studies are titled to the positive side, thanks to recent momentum and (mostly) positive breadth and seasonality, as well as a curious amount of pessimism in a mostly healthy market environment. This could change relatively quickly, especially after the first couple weeks of the new year.
About the Weekly Wrap...
The goal of the Weekly Wrap is to summarize our recent research. Some of it includes premium content (underlined links), but we're highlighting the key focus of the research for all. Sometimes there is a lot to digest, with this summary meant to highlight the highest conviction ideas we discussed. Tags will show any symbols and time frames related to the research.