
TradingEdge for Jun 11 - Surging Small Caps and Overseas Stocks, Overbought Bonds


The goal of the Weekly Wrap is to summarize our recent research. Some of it includes premium content (underlined links), but we're highlighting the key focus of the research for all. Sometimes there is a lot to digest, with this summary meant to highlight the highest conviction ideas we discussed. Tags will show any symbols and time frames related to the research.
| STOCKS | ||
|  |  |
The probability of a new bear market is rising.
Now that data from May have been finalized, the Bear Market Probability model has risen to its highest level since January 2020.
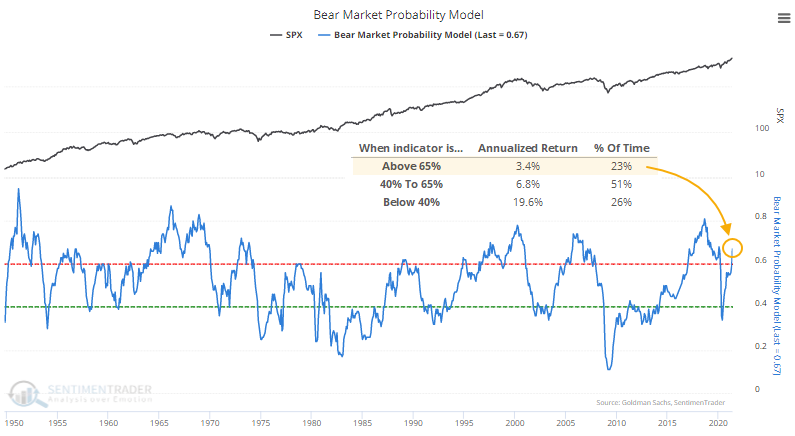
When the model is above this threshold, the S&P 500 has returned an annualized +3.4%. That's not disastrous, but it's well below average.
Our current cycle from below 40% to above 65% took only 11 months, the shortest one ever. The previous shortest cycle was the one in November 1972 (a cycle of 12 months), which also preceded the biggest failure going forward, for what that's worth.
There isn't a lot in the table above that's concerning. Shorter-term returns were weak, but a couple of them within an already tiny sample bucked that weakness and saw consistent strength. Over the next year, all but two record double-digit gains. It will be a more pressing concern if Bear Market Probability climbs above 70%.
RISING MARKETS ARE ENCOURAGING SMALL TRADERS...AGAIN
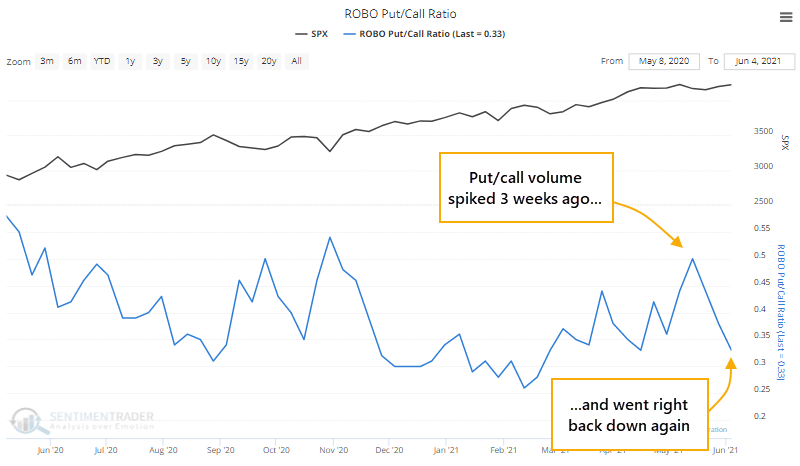
With renewed interest in meme stocks and leveraged bets, the smallest of options traders are coming back.
After a record orgy of speculative excess in February, many of these traders lost significant sums. But last week, there was a jump in small trader call buying and a drop in put buying. That means the ROBO Put/Call Ratio plunged near its lows once again. The ratio compares volume in put buying to open from the smallest of traders to the volume of their call buying. The lower the ratio, the less hedging activity is happening.
If we focus just on this past year, then any after any week when the ratio has dropped toward its lower boundary, returns in the S&P were significantly worse than when the ratio was near the upper end of its range.
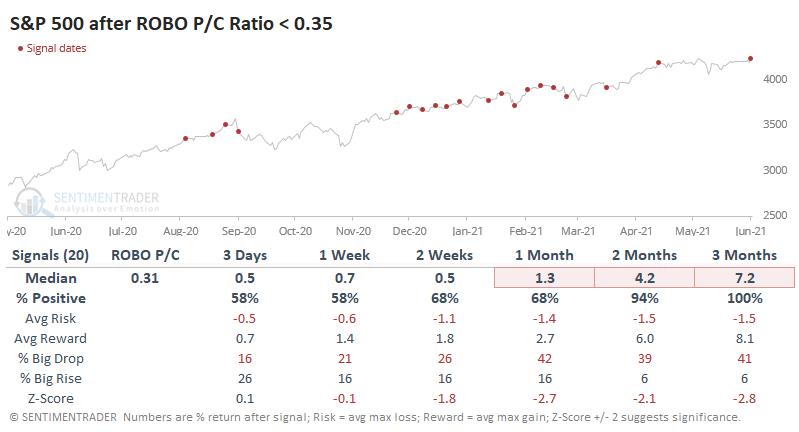
Historically, all of the option data is still showing extreme enthusiasm in individual stocks. If you blocked out the past year and looked at last week's reading compared to anything from the prior 20 years, we'd be pounding the table about speculative excess. So, while activity is down significantly from the February peak, it's still high compared to any other time period, and last week shows that traders are still willing to jump on the leveraged bandwagon yet again.
SMALL STOCKS ARE COMING BACK, TOO
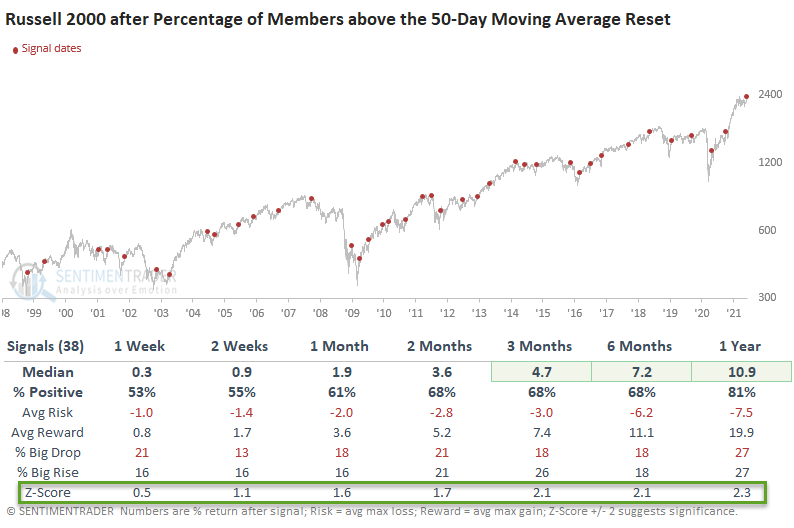
Dean showed that the Russell 2000 Index, a broad measure of small-cap stocks, has been moving sideways for the better part of the last three months.
That allowed for a reset in its breadth, specifically the percentage of stocks in the index trading above their 50-day moving averages. So, Dean looked at times when the indicator resets below 35% (fewer than 35% of stocks trading above their 50-day averages) and then increases above 69% like it did this week.
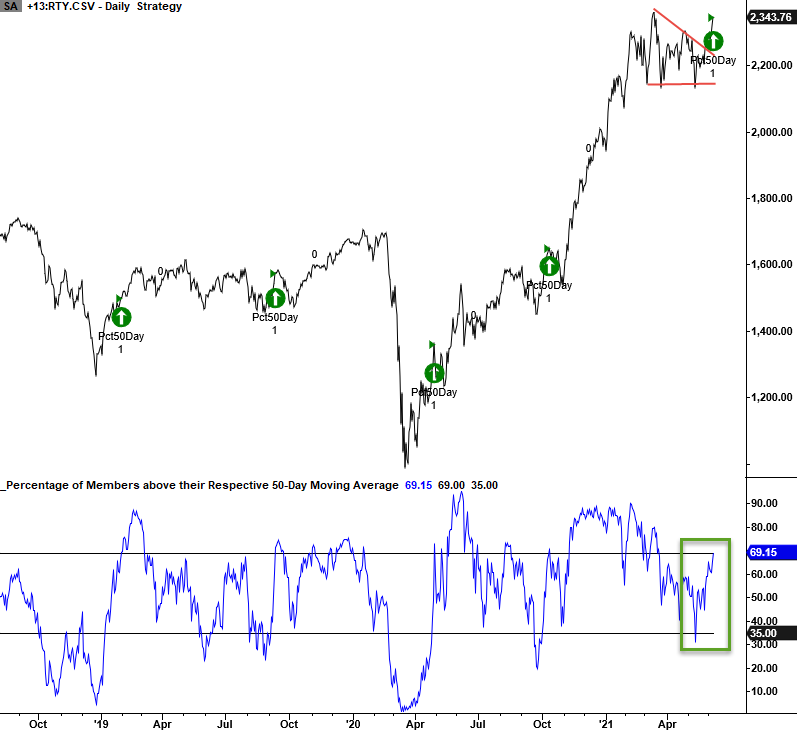
The fact that the percentage of members above the 50-day moving average never reset below an oversold level of 20% reflects the strong participation before the current consolidation.
Future returns in the Russell were good in the 2-12 month window with a favorable risk/reward profile across several timeframes. The 2-3 month timeframe has been profitable for nine consecutive signals.
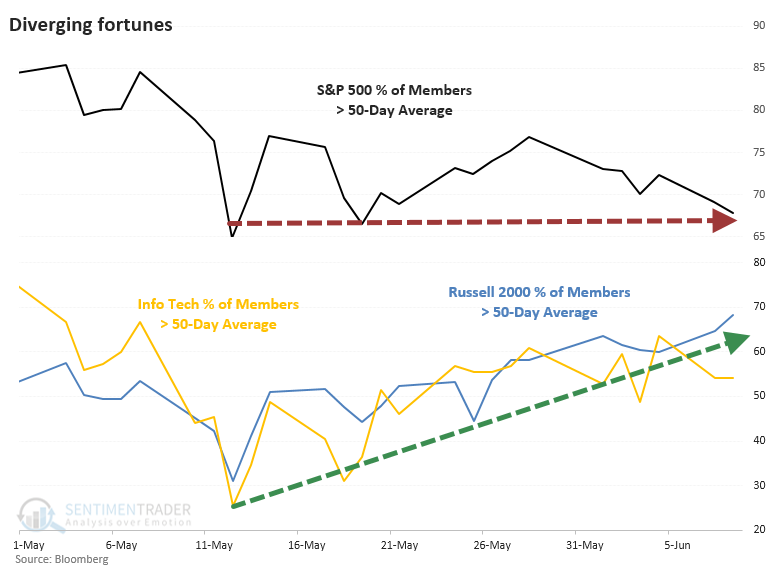
This internal improvement in the Russell highlights a remarkable rotation under the surface.
Since some riskier stocks took a mini-tumble into early May, many of them have stormed back. On May 12, only 31% of stocks in the Russell 2000 were holding above their 50-day moving averages. In the Info Tech sector, only 25% of stocks were above their averages. Both have seen participation more than double since then, while the S&P 500 has stagnated internally, as pointed out by the esteemed Liz Ann Sonders.
For the S&P, this was a horrible sign. Over the next two months, it managed to rally only twice out of eleven attempts, and both of those crapped out soon after. For the other two indexes, however, it wasn't as ominous.
When we look at the ratios between indexes, that's where this turns interesting. Looking at future returns between the Russell 2000 versus the S&P 500, there was a clear bias toward Small-Caps.
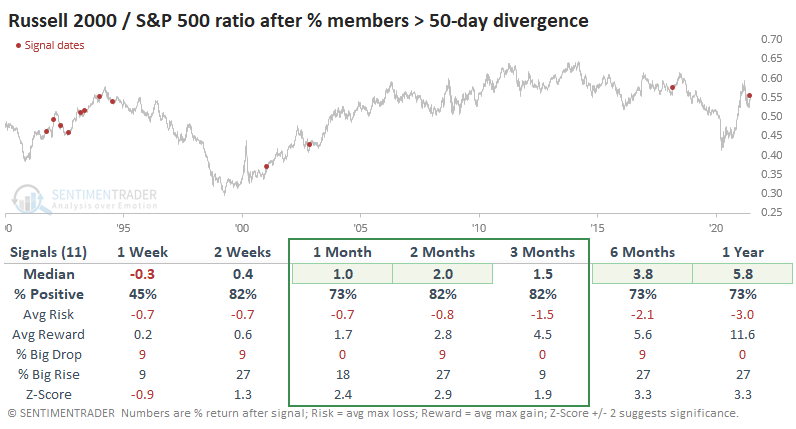
The biggest oops was when this scenario popped up early in 2001. The post-bubble puke wasn't yet finished, and anyone relying on this positive divergence in breadth between indexes would have suffered terrible losses, absolutely and relatively.
Overall, though, the suggestion is that while it is a negative sign for the broader market, investors may find some relative solace in the very stocks that have been holding up best, particularly Small-Caps.
GLOBAL MARKETS ARE PERKING UP
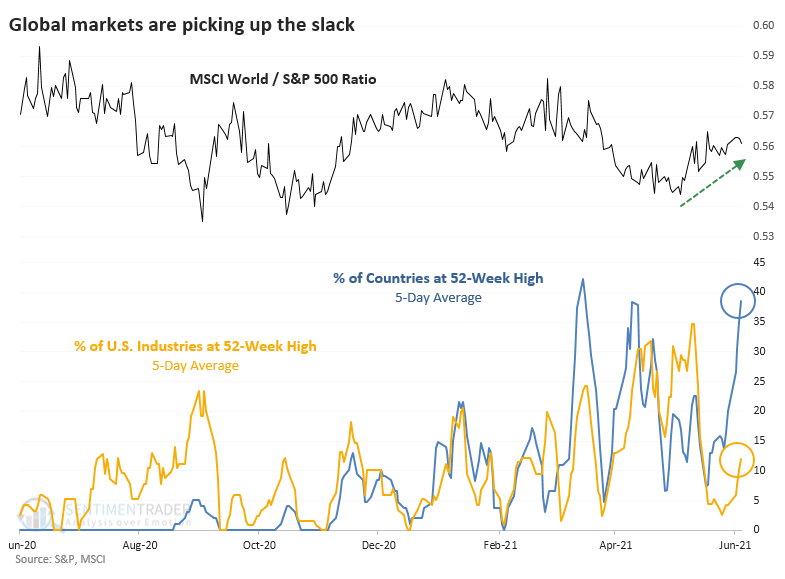
Global markets are picking up, and many of them have been hitting new highs.
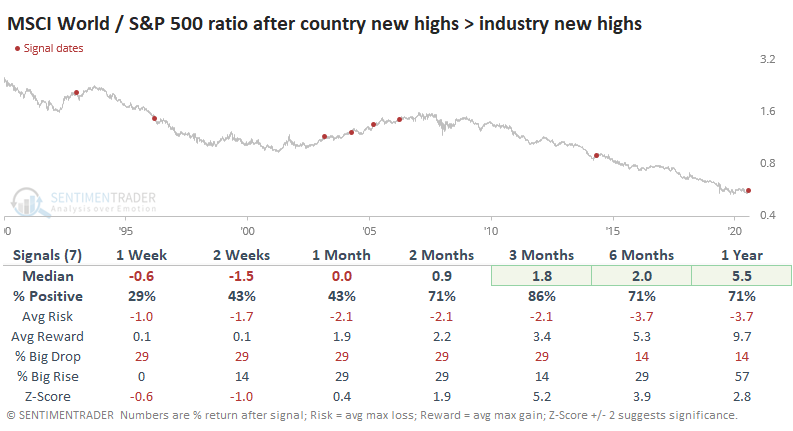
The momentum has been enough to push 30% or more of global indexes to fresh highs in recent weeks. This is interesting because the percentage of developed countries at a 52-week high has greatly exceeded the percentage of U.S. industries at a new high. This is a stark change from last summer.
It's not like scenarios like this were a bad sign for the S&P 500 going forward. On the contrary, it usually rose, or if it lost ground, those losses were minor.
More consistently, the ratio between the MSCI World Index (excluding the U.S.) versus the S&P 500 tended to fall back in the short-term, then rise over the medium-term. There was only one loss over the next three months. That one was a complete failure.
STOCKS AND SECTORS - ENERGY AND BRAZIL
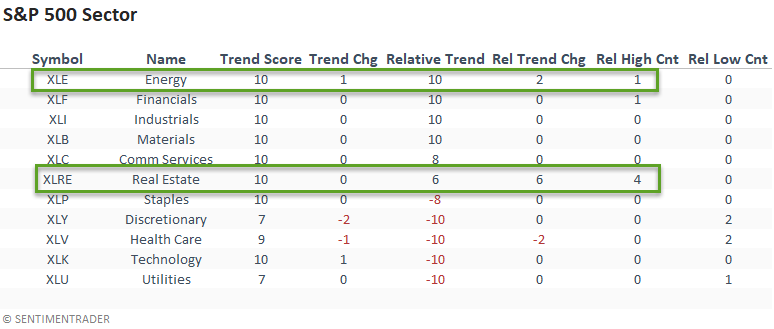
Dean updated a look at industry, sector, and country absolute and relative trends.
The market continues to favor a value/cyclical tilt. Energy re-claimed a perfect relative trend score ranking with solid outperformance versus the broad market. Performance in the cap-weighted real estate sector showed a noticeable improvement in the relative trend score and new relative highs on 4/5 days.
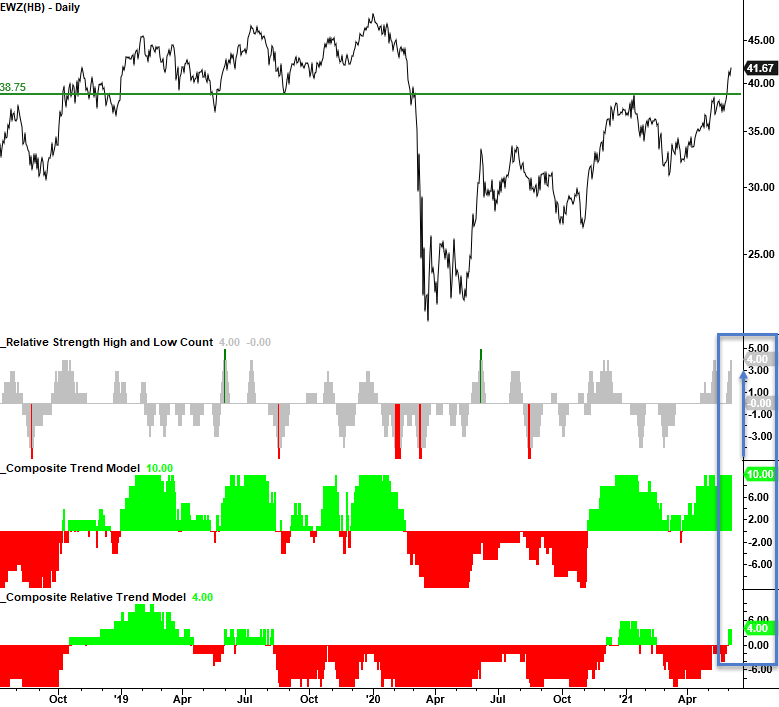
When he sorted the list by relative trend score change, it showed an improvement from emerging market ETFs. Brazil and Taiwan are leading the way.
Brazil had the best week of any emerging market country with a noticeable jump in the relative trend score and new relative highs on 4/5 days. The EWZ ETF broke above a significant pivot high and now has a clear path until the next resistance area around the 47-48 level.
STOCKS AND SECTORS - MEXICO
Mexico, a developing market, maintains a solid absolute and relative trend profile. On Monday, we got additional trend confirmation as internal participation increased with a surge in new highs.
The percentage of members registering a 4-week high spiked to 54.29%, so Dean assessed the forward return outlook when the percentage crosses above 50%.
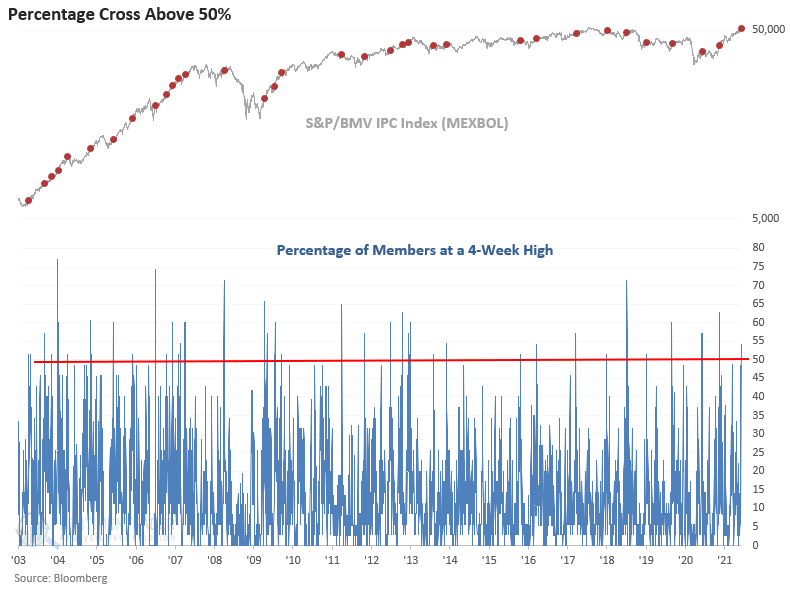
The 2-3 month timeframe looks solid, especially during the last major emerging market cycle between 2003-2007. As always, one must keep an eye on the dollar when allocating capital to emerging markets.
The EWW fund rallied 72% of the time over the next 36 days, with a 2.6-to-1 profit factor.
STOCKS AND SECTORS - THE VALUE FACTOR
Dean looked at what happens when the S&P 500 closes at a new all-time high as the 10-year yield closes at a 3-month low, which triggered on Thursday.
After screening out repeat signals by requiring the 10-year bond yield to register a new 3-month high before an additional signal could trigger, he saw that stocks generally held up well going forward. There were certain sectors, like Energy and Financials, that did particularly well. Also, factors like Value.
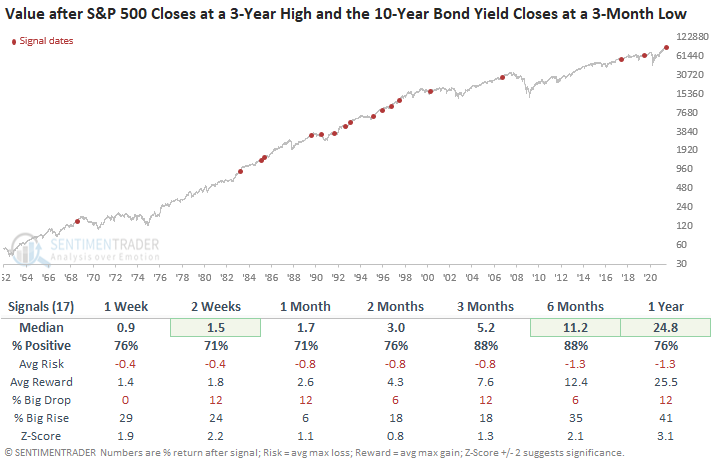
Over the next 3-6 months, Value stocks rose after 15 out of 17 signals, with well above-random average returns and an excellent risk/reward skew.
| BONDS | ||
 | ||
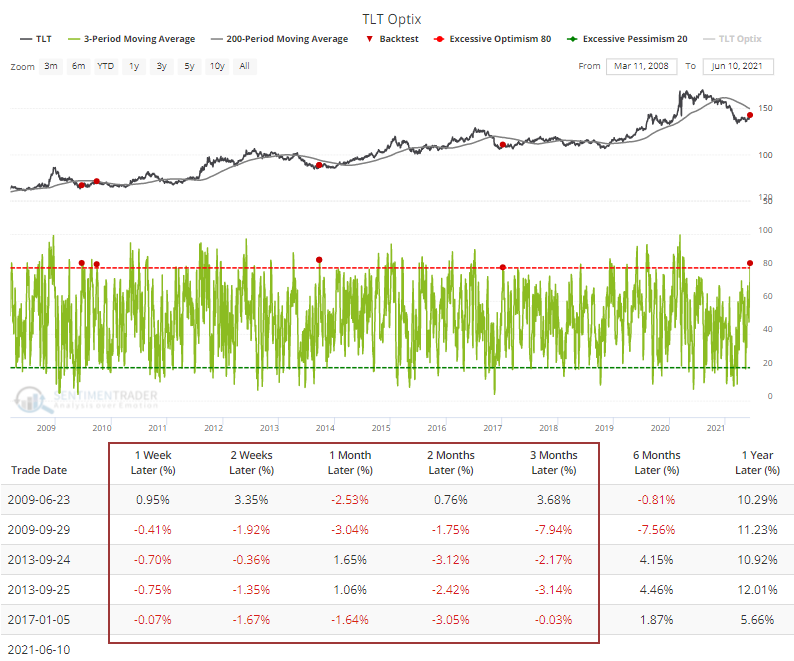
Inflation worries? Bah! Bond traders don't seem to care.
Over the past 3 days, our Optimism Index for the TLT fund climbed above 80%, the highest in over a year. Whenever it has been this high, TLT struggled a bit, especially in the shorter time frames.
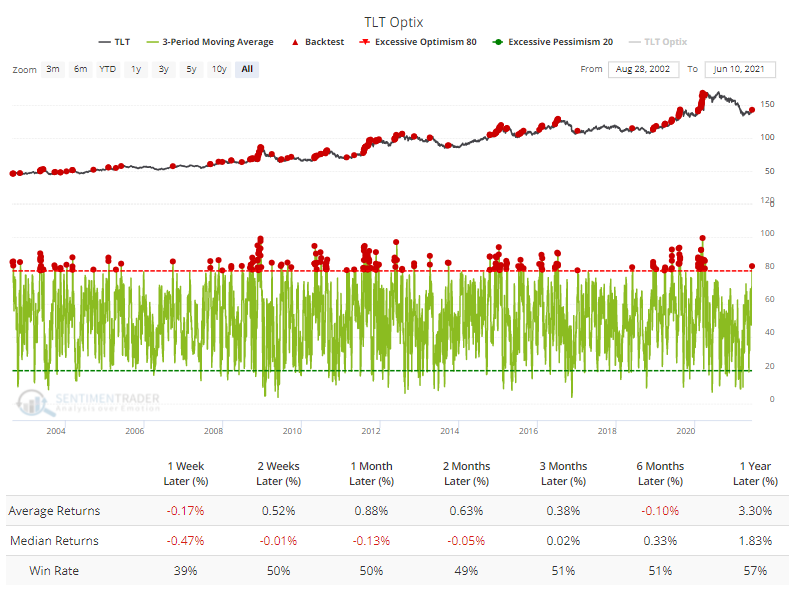
What's more notable is that according to the Backtest Engine, when TLT was mired in a downtrend at the time, this kind of optimism was not rewarded.
| COMMODITIES | ||
 |  | |
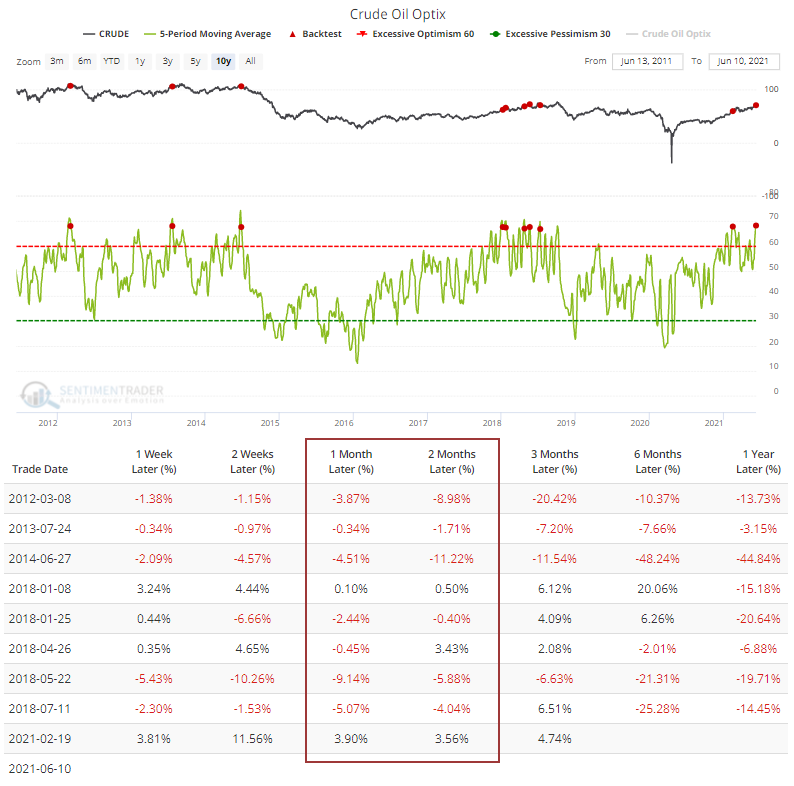
Energy stocks have held up well lately thanks to steadily rising oil prices. That has helped push sentiment on the commodity to one of its highest levels in years.
The 5-day average of our Optimism Index pushed above 68.5% and then crossed below. Over the history of the sentiment indicator, this has preceded lukewarm returns over the next 2-4 weeks.
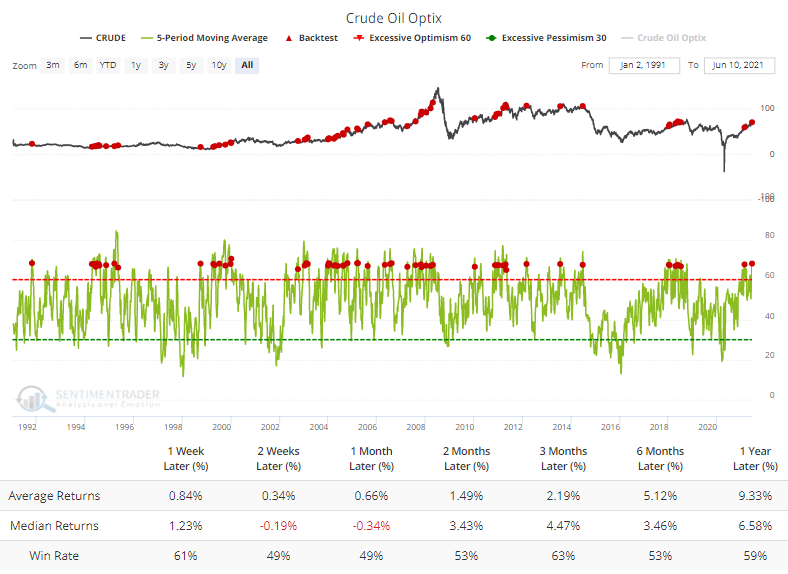
It's more of a concern when looking at the past decade, since oil's peak before the financial crisis. Almost every one of the signals preceded a drop in oil, according to the Backtest Engine. Bulls need to hope that we're in a new market environment.
GOLD AFTER STOCK/YIELD EXTREMES
As noted above, on Thursday, the S&P 500 closed at a new high while 10-year yields fell to a multi-month low. Once again, this was not a great sign for gold, especially in the short term.
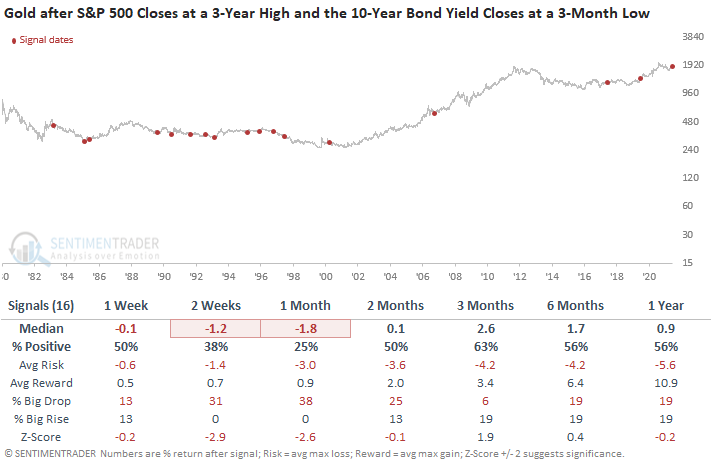
Out of the 16 available signals, gold closed lower either two or four weeks later after 13 of them.